
Recomendados
Recomendados
Más contenido relacionado
Similar a Hospital growth and competition
Similar a Hospital growth and competition (20)
Último
Último (20)
Hospital growth and competition
- 1. HMO Penetration, Hospital Competition, and Growth of Ambulatory Surgery Centers John Bian, Ph.D. and Michael A. Morrisey, Ph.D. Using metropolitan statistical area (MSA) argued that such facilities pose unfair cost panel data from 1992-2001 constructed advantages to hospitals by drawing profit from the 2002 Medicare Online Survey able surgeries and procedures away from Certification and Reporting (OSCAR) hospitals (Winter, 2003). There are also System, we estimate the market effects of concerns that ASCs may lead to unneces health maintenance organization (HMO) sary surgeries and procedures because of penetration and hospital competition on the the financial incentives inherent in physi growth of freestanding ambulatory surgery cian-owned ASCs and that their narrow centers (ASCs). Our regression models with service availability may compromise qual MSA and year fixed effects suggest that a 10 ity of care (Casalino, Devers, and Brewster, percentage-point increase in HMO penetra 2003; Mitchell and Sass, 2006). tion is associated with a decrease of 3 ASCs While the growth of specialty hospitals per 1 million population. A decrease from has been contentious with concerns cen 5 to 4 equal-market-shared hospitals in a tering on physician ownership and favor market is associated with an increase of 2.5 able selection of healthy patients (Mitchell, ASCs per 1 million population. 2006; Guterman, 2006; Stensland and Winter, 2006; Greenwald et al., 2006), the INTRODUCTION growth of ASCs has been much more rapid. Surprisingly, there has been little Freestanding ASCs have been a grow empirical research on ASCs and virtually ing phenomenon in the U.S. health care none that has examined the effects of mar market for the past 20 years. Winter (2003) ket conditions on the growth of ASCs. The indicated that the number of Medicare- concerns about the growth of ASCs, how certified freestanding ASCs had increased ever, are much the same. Winter (2003) from about 400 in 1983 to over 3,300 in examined differences in the case mix of 2001. These facilities typically consist of Medicare patients receiving ambulatory a small number of operating rooms and surgeries and procedures between hospital provide a specific set of surgical proce outpatient departments and ASCs, suggest dures (Casalino, Devers, and Brewster, ing that ASCs might have treated patients 2003). Their expanding role in the U.S. with less intense case mix. Two studies health care delivery system has been con examined the association of ASCs with troversial. Some have argued that these hospital surgery markets. Casalino et al. “focused factories” lower the unit cost of (2003) reported the perceptions of medical surgical care by performing a narrow set group, hospital and health plan executives of procedures in a remarkably efficient on the effects of ASCs on hospital markets, fashion (Herzlinger, 2004). Others have but were not able to quantitatively sup The authors are with the University of Alabama at Birmingham. port these perceptions. Lynk and Longley The statements expressed are those of the authors and do not necessarily reflect the views or policies of the University (2002) examined the impact of ASC entry of Alabama at Birmingham or the Centers for Medicare & Medicaid Services (CMS). on hospital surgery volume in two commu- HealTH CaRe FINaNCINg RevIew/Summer 2006/Volume 27, Number 4 111
- 2. nities. They concluded that hospital outpa accompanied by increasingly consolidated tient surgery volume declined as a result hospital markets and emerging hospital of the new ASC entry and that doctors with systems (Cueller and Gertler, 2003), may an ownership position in the new ASCs have also encouraged providers to shift reduced outpatient surgery volume of hos deliveries of surgeries and procedures pitals where the doctors had admitting from the inpatient to ambulatory settings privileges. Two other studies explained as a method of cost control. the factors influencing the growth of ASCs. ASCs have developed over time, as enti Casalino and colleagues (2003) suggested ties that are organizationally distinct form that the absence of State certificate-of-need hospital outpatient surgery departments. (CON) laws and the presence of large Most ASCs are freestanding facilities single-specialty groups in a health care that are not owned outright by hospitals. market were likely factors associated with However, they are required by Medicare the development of ASCs. A preliminary to be licensed by the States in order to report by the Medicare Payment Advisory be Medicare-certified providers (Casalino Commission (2004a), using cross-sectional et al., 2003). Almost all ASCs are for- data, suggested that markets with high profit, located in large metropolitan areas, er managed care penetration had slower and equipped with two or more operat growth of ASCs. ing rooms (Medicare Payment Advisory This study contributes to the existing lit Commission, 2004b). Many ASCs special erature on ASCs. In this analysis, we start ize in one or two types of surgical services with an overview of rapid growth of ASCs such as ophthalmology, gastroenterology, over the past two decades. We then present and orthopedic surgeries or procedures a model of how changes in health care mar (Winter, 2003; Medicare Payment Advisory ket characteristics may affect the growth Commission, 2004b). ASCs are assumed of ASCs. In particular, we focus on two to be a lower cost alternative to hospital key market characteristics—managed care outpatient surgery departments possibly penetration and hospital market concentra because of their specialization and lower tion. Finally, we empirically analyze the overhead costs. However, they are paid effects of the two key market characteris more generously by Medicare in 8 of tics on the growth of Medicare-certified the 10 surgical procedure categories that freestanding ASCs, using a balanced 1992 account for the highest share of Medicare 2001 MSA level panel dataset constructed payments to ASCs (Winter, 2003). Thus, from the 2002 Medicare OSCAR system. differences in Medicare facility payment rates between ASCs and hospital outpatient BaCKgROUND surgery departments may create potential incentives for ASCs to selectively perform Advances in anesthetics and the devel certain types of more profitable surgeries opment of minimally invasive surgical or procedures (Winter, 2003). techniques since the 1980s have made Medicare pays surgeons the same pro it possible to move many surgeries and fessional surgical services regardless of procedures from an inpatient to an ambu delivery settings. Surgeons who have an latory setting (Detmer and Gelijns, 1994). ownership interest in an ASC, however, Contemporaneous changes in health care can earn a share of profit from their invest market characteristics, particularly the ment in the ACS in addition to their profes proliferation of managed care activities sional fee. Thus, there is some incentive 112 HealTH CaRe FINaNCINg RevIew/Summer 2006/Volume 27, Number 4
- 3. for surgeons to steer patients away from bypass grafts and $4,865 less for cesarean- community hospital outpatient facilities to sections than did the indemnity plans also ASCs where they have an ownership inter offered to employees. est. Federal laws (Stark I and II) generally If ASCs have a cost advantage over hospi prohibit physicians from referring their tal outpatient departments because of their patients to facilities in which the physi quality and efficiency (Casalino, Devers, cians have an ownership (U.S. Department and Brewster, 2003; Herzlinger, 2004), one of Health and Human Services, 2004). would expect managed care plans to seek However, ASCs are exempted from this contracts with them. This demand would prohibition (Iglehart, 2005). lead more ASCs to enter the market. Thus, Some State regulations such as CON laws we hypothesize that greater managed care are likely to influence the growth in ASCs penetration will lead to more ASCs in a (Casalino et al., 2003). CON laws require market. that a covered entity obtain approval from A tenant of standard economics is that the State before undertaking major capital prices are more likely to be driven down investments such as new construction, to marginal costs when there are more renovation, or expansion into new service competitors in the market. Melnick and lines. Some States do not have CON laws colleagues (1992) were the first to show while in others the dollar threshold for that a managed care plan (in California) investments to come under CON reviews was able to negotiate lower hospital prices is set higher than the amounts needed when there were more hospitals in the to open some types of ASCs. However, local market. Bamezai et al. (1999) showed a preliminary report suggests that CON that managed care penetration had a larger laws, as currently in place, may only be restraining effect on hospital cost growth weakly associated with the growth of ASCs when there was greater hospital competi (Medicare Payment Advisory Commission, tion in the market. Their results implied 2004a). that a market with four equally sized hos pitals would have hospital cost growth CONCePTUal OveRvIew that was 6 percentage points lower than a similar market with only two equal sized While advances in surgical technolo hospitals (Morrisey, 2001). More recently, gies undoubtedly have driven the overall the U.S. Government Accountability Office growth of ASCs, changing market charac (2005) examined the transaction prices teristics may have much to do with the dif paid to hospitals by insurers participating ferential growth of ASCs across markets. in the Federal Employees Health Benefits Two factors of particular interest are the Plan. They found that hospitals in the least growth in managed care influence and the competitive quartile of MSAs had prices consolidation of hospital markets. that were 18 percent higher than those in The comparative advantage of managed the most competitive quartile of MSAs. care plans is their ability to negotiate lower Other things equal, higher prices should prices in exchange for greater service lead to the entry of new competitors. ASCs volume.1 Altman, Cutler, and Zeckhauser serve as substitutes to hospitals for outpa (2003) found that HMOs offered to tient surgery. Thus, we hypothesize that Massachusetts State employees in 1994 greater hospital concentration will lead to 1995 paid $20,808 less for coronary artery more ASCs in a market. 1 For a review of hospital markets, refer to Morrisey (2001). HealTH CaRe FINaNCINg RevIew/Summer 2006/Volume 27, Number 4 113
- 4. MeTHODS Dependent variable Data Sources The dependent variable is ASCs per 10,000 population, calculated as the num We used four secondary data sourc ber of ASCs in an MSA divided by the es for our empirical analysis. The main MSA population and multiplied by 10,000. data source is an extract from the 2002 We were unable to capture two impor Medicare OSCAR system, which reported tant pieces of information on ASCs that data on all Medicare-certified freestand were potentially relevant to this study. The ing ASCs in operation at the end of 2001. first is specialties of ASCs. Market effects (Hereafter, ASCs refers to Medicare-certi might vary by type of procedure because fied freestanding ASCs.) Relevant informa of their differential profitability implica tion in the OSCAR includes facility opening tions to ASCs. Thus, analyzing the growth dates as well as State and county location. of ASCs only in aggregate may bias our However, the OSCAR data provide no infor results to the null. The second is mergers mation on the volume of services provided and closures information on ASCs. There by ASCs. have been ASC mergers and closures. For The three complementary data sources example, during the period from 1997-2002, included an HMO enrollment file that there was an average of 58 ASC mergers reported the number of HMO enrollees and/or closures per year, while 279 new at the county level from 1992-2001, the ASCs were opened per year (Medicare American Hospital Association (AHA) Payment Advisory Commission, 2004a). annual survey of hospitals including infor While information on new and terminated mation such as the number of hospital providers is available in the OSCAR data, admissions from 1992-2001, and the Area complete information on mergers is more Resource Files (ARF), a public use file, that difficult to obtain. compiles county-level information such as the supply of physicians, population esti explanator y variables mates, and demographic and economic characteristics from 1993 and 1995-2003. Two market characteristics are key (We used multiple-year ARFs to construct to our hypotheses about ASC growth. a longitudinal database.) The first was managed care penetration. We defined an MSA as the health care mar Managed care includes HMOs, preferred ket and identified them based on the 2001 provider organizations, and their deriv designations by the Office of Management atives. However, the literature suggests and Budget. We aggregated all county-level that preferred provider organizations have data to the MSA level and constructed a been much less effective than HMOs in 1992-2001 MSA-level balanced panel dataset controlling health care costs (Bamezai by merging ASC data with HMO penetra et al., 1999; Morrisey, Jenen, and Gabel, tion, AHA survey files, and ARF data. (Data 2003). Thus, we focused only on HMO from non-MSA counties were excluded from penetration in this study. Publicly available the analysis.) In 2001, there were a total of HMO enrollment data are reported by the 322 MSAs in the U.S., but the final panel location of the headquarters of the HMO dataset included only 317 MSAs each year and, therefore, are misleading. We use because HMO penetration data were not a penetration measure constructed from available in 5 MSAs. HMO enrollment data previously reported 114 HealTH CaRe FINaNCINg RevIew/Summer 2006/Volume 27, Number 4
- 5. by Baker (1997). The number of HMO Multivariate Statistical analysis enrollees (all ages combined) were report ed once in 1992 and 1993 using data from The main concern about estimating the the Group Health Association of American market effects on ASCs is that unobserv (GHAA), twice (July by the Interstudy and able market heterogeneity and secular December by GHAA) in 1994, and twice time trends (i.e., unobservable factors cor (January and July both by the Interstudy) related with both the dependent variable from 1995-2001. We calculated HMO pen and the two key explanatory variables) etration as a ratio of the total number of could yield biased estimates. With this HMO enrollees to the total population in concern in mind, we estimate ordinary each MSA. For the years during which the least squares regression models with MSA number of HMO enrollees were reported and year fixed effects. This two-way fixed twice, we used the average number of effects specification may mitigate potential HMO enrollees. biases arising from any time-invariant MSA- The second key market characteristic level covariates (e.g., geographic location was community hospital concentration, of ASCs, differential preference or tastes of measured by the Herfindahl-Hirschman surgery delivery setting) as well as impor Index (HHI) from AHA admissions data tant time trends (e.g., advances in medical (U.S. Department of Justice Web site). The technology, nationwide policy changes). In HHI is defined as the sum of the squared addition, we control for a set of observed admission market shares of all community time-varying MSA-level demand and sup hospitals in an MSA. (The value of HHI ply covariates in the regression models. ranges from 0 to 1. The higher value of Our regression model took the following HHI indicates a more concentrated mar form: ket.) A potential limitation of using indi ASCit = α + β HMOit + γ HHIit + δ Zit + vidual hospital market share to measure σi + τt + μit competition is that it may overstate mar where the number of ASCs per 10,000 pop ket competition by failing to account for ulation in MSA i in year t is a function of the rapid development of hospital systems HMO penetration, hospital concentration (Cuellar and Gertler, 2003). (HHI), a vector of other market conditions Other MSA-level covariates, all construct (Z) as well as year (τ) and MSA (σ) fixed ed from ARF data, included per capita spe effects. The Z vector includes measures cialty surgeons (specializing in colon/rectal of the number of specialty surgeons per surgery, general surgery, neurological sur 10,000 population, the number of non- gery, obstetrics-gynecology subspecialties, Federal physicians per 10,000 population, ophthalmology, orthopedic surgery, otolar the proportion of the MSA population age yngology, plastic surgery, thoracic surgery, 65 or over, per capita income, and the and urology), per capita total non-Federal unemployment rate. Standard errors were physicians (i.e., excluding physicians full adjusted via Huber robust standard errors time employed by the Federal Government), correction (White, 1980). the proportion of population age 65 or over, In sensitivity analyses, we ran the model per capita income, and the unemployment using lagged right hand side variable to rate among those age 16 or over. account for ASC delays in adjusting to market conditions. In addition, we ran HealTH CaRe FINaNCINg RevIew/Summer 2006/Volume 27, Number 4 115
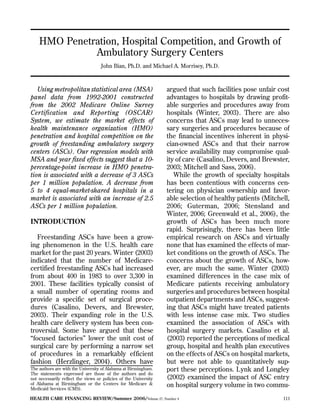
- 6. Figure 1 Growth of Ambulatory Service Centers (ASCs) in Metropolitan Statistical Areas: 1992-2001 3,000 2,916 2,967 Number of ASCs Number of ASCs in the U.S.1 2,694 2,743 2,455 2,502 2,500 2,239 2,279 2,026 2,064 2,000 1,814 1,846 Number of ASCs 1,652 1,680 1,499 1,521 1,500 1,320 1,339 1,156 1,173 1,000 500 0 1992 1993 1994 1995 1996 1997 1998 1999 2000 2001 Year 1 Reported by the Online Survey Certification and Reporting System (OSCAR). SOURCE: 2002 Medicare OSCAR System. the model interacting HMO penetration HMO penetration almost doubled from and hospital concentration to see if ASCs 11.8 percent in 1992 to 20.1 percent in 1999, depended on the interaction of HMO pen but declined slightly after 1999. Hospital etration and hospital competition. market concentration remained relatively stable until 1996, but began to increase ReSUlTS afterward, reflecting an increase in hos pital mergers in the late 1990s (e.g., the Trends and Market Characteristics number of community hospitals used to calculate HHI in this study decreased from Table 1 shows the total number of ASCs 3,037 in 1992 to 2,791 in 2001). in MSAs growth rate from 1,156 in 1992 Figure 2 shows the results of two bivari to 2,916 in 2001, whereas the correspond ate comparisons relating changes in HMO ing number of ASCs in MSAs reported by penetration and hospital market concen the 2002 OSCAR grew from 1,173 to 2,967 tration to the growth in ASCs per 10,000 (Figure 1). Thus, our data captured almost population because the MSA fixed effects all operating ASCs in MSAs in 2001. The approach only uses within-MSA varia number of ASCs per 10,000 population tion for estimation. For each of the three increased at a similar rate from 0.07 to 0.17 variables, we first calculated the absolute during the same period. (Twenty of the change within MSAs between 1992 and 317 MSAs had no ASC during the study 2001. We then plotted the change in ASCs period.) per 10,000 population by the lowest and 116 HealTH CaRe FINaNCINg RevIew/Summer 2006/Volume 27, Number 4
- 7. Table 1 Trends of Growth of Ambulatory Surgery Centers (ASCs) and Market Characteristics at the Metropolitan Statistical Area (MSA)1 Level: 1992-2001 Characteristic 1992 1993 1994 1995 1996 1997 1998 1999 2000 2001 Total Number of ASCs 1,156 1,320 1,499 1,652 1,814 2,026 2,239 2,455 2,694 2,916 ASCs Per 10,000 Population 0.066 0.074 0.084 0.092 0.108 0.122 0.134 0.147 0.158 0.169 HMO Penetration 0.118 0.127 0.138 0.147 0.165 0.182 0.194 0.201 0.196 0.190 Hospital Concentration (HHI) 0.361 0.363 0.366 0.368 0.378 0.386 0.391 0.394 0.398 0.399 Per Capita Specialty Surgeons2 (Per 10,000 Population) 4.431 4.492 4.446 4.570 4.709 4.811 4.872 4.723 4.781 4.829 Per Capita Non-Federal Physicians (Per 10,000 Population) 23.971 24.612 24.627 26.205 26.867 27.561 28.088 28.723 28.682 28.801 Proportion of Population > 64 Years 0.125 0.126 0.127 0.127 0.127 0.127 0.128 0.128 0.126 0.126 Per Capita Income (in $10,000) 1.781 1.880 1.946 2.039 2.177 2.285 2.362 2.552 2.666 2.734 Unemployment Rate 0.072 0.067 0.061 0.056 0.054 0.050 0.046 0.043 0.042 0.048 1 N=317. 2Surgery specialties include colon/rectal surgery, general surgery, neurological surgery, obstetrics-gynecology subspecialties, ophthalmology, orthopedic surgery, otolaryngology, plastic surgery, thoracic sur gery, and urology. NOTES: HMO is health maintenance organization. HHI is Herfindalh-Hirschman Index (higher HHI means less competitive a market). SOURCES: 2002 Medicare OSCAR System, HMO Enrollment File, 1992-2001 American Hospital Association Annual Survey Files, and Area Resource Files. HealTH CaRe FINaNCINg RevIew/Summer 2006/Volume 27, Number 4 117
- 8. Figure 2 Differential Growth of Ambulatory Surgery Centers (ASCs) Corresponding to Differential Changes in Market Characteristics: 1992 and 2001 0.16 Lowest Quartile Highest Quartile 0.14 0.131 0.1313209 0.131 0.1307792 People Changes in ASCs per 10,000 people 0.12 0.10 0.080 0.0795391 0.08 0.071 0.0713082 0.06 Changes 0.04 0.02 0.0 Δ HMO Penetration Δ HHI Changes in Market Characteristics NOTES: HMO is health maintenance organization. HHI is Hertindahl-Hirschman Index. SOURCES: 2002 Medicare OSCAR System, HMO Enrollment File, and 1992-2001 American Hospital Annual Survey File. highest quartiles of the change in each mates of both models were similar in mag of the two market variables. Although the nitude, direction, and significance, we only two bivariate comparisons of changes from focused on the results of the concurrent the beginning (1992) to the end (2001) model. After controlling for the numbers of of the study period did not use any of the surgeons and physicians and demograph information from the years in between, ics and economic characteristics, greater nor did they control for other explanatory HMO penetration was associated with a variables that may be correlated with both reduction in ASCs per 10,000 population (p ASCs and the two market characteris < 0.01). To put this in context, a 10-percent tics. However, the figure suggests that the age-point increase in HMO penetration growth of ASCs had a negative association was estimated to result in 3.0 fewer ASCs with increased HMO penetration and a per million population. positive association with increased hospital Greater hospital concentration was asso market concentration. ciated with greater ASC presence (p < 0.01). An increase in the value of the HHI of 0.05 Results of Multivariable Regression is the equivalent of a reduction from 5 to 4 analysis equal sized hospitals in a market. The coef ficient estimate implies that this increase The estimates from the concurrent and in hospital concentration would result in lag models with MSA and year fixed effects 2.5 more ASCs per million population in a are presented in Table 2. Because the esti market. In a model that interacted the HHI 118 HealTH CaRe FINaNCINg RevIew/Summer 2006/Volume 27, Number 4
- 9. Table 2 Estimated Effects of Market Characteristics on Growth of Ambulatory Surgery Centers (ASCs) From Least Squares Regression with Metropolitan Statistical Areas (MSAs) Level and Year Fixed Effects: 1993-2001 Dependent Variable1 Concurrent Model Laggged Model HMO Penetration ***0.3.00 ***-0.278 (0.065) (0.069) Hospital Concentration (HHI) ***0.494 **0.435 (0.156) (0.170) Per Capita Specialty Surgeons (Per 10,000 Population) -0.020 -0.013 (0.012) (0.012) Per Capita Non-Federal Physicians (Per 10,000 Population) 0.003 0.002 (0.004) (0.003) Proportion of Population > 64 Years **-3.098 ***-3.740 (1.249) (1.412) Per Capita Income (in $10,000) ***-0.060 ***-0.079 (0.019) (0.025) Unemployment Rate **-1.065 -0.693 (0.446) (0.520) Year 1993 0.013 __ (0.009) __ 1994 *0.021 *0.018 (0.011) (0.011) 1995 **0.031 *0.030 (0.014) (0.013) 1996 ***0.055 ***0.052 (0.015) (0.015) 1997 ***0.071 ***0.076 (0.019) (0.018) 1998 ***0.088 ***0.095 (0.021) (0.020) 1999 ***0.104 ***0.114 (0.023) (0.023) 2000 ***0.112 ***0.134 (0.021) (0.025) 2001 ***0.132 ***0.145 (0.022) (0.024) Number of MSAs 317 317 Number of Years 10 9 Huber Standard Errors Correction Yes Yes 1 ASCs per 10,000 population. * Statistical significance at 10 percent. ** Statistical significance at 5 percent. *** Statistical significance at 1 percent. NOTES: Standard errors are in parentheses. HMO is health maintenance organization. HHI is Herfindahl-Hirschman Index. MSA is metropolitan statistical area. SOURCES: 2002 Medicare OSCAR System, HMO Enrollment File, 1992-2001 American Hospital Association Annual Survey Files, and Area Resource Files. with HMO penetration, the coefficient of (p < 0.05). All the estimates of year indica- the interaction term was statistically insig- tors were positive, statistically significant, nificant and the other coefficients in the and monotonically increasing from 1994 model were essentially unchanged. 2001, indicating a strong secular trend of The estimated effects of other covariates increased ASCs over time. show that the growth of ASCs is also sig nificantly associated with demographic and DISCUSSION economic characteristics. ASCs were less likely to enter a market with a higher pro- This study has sought to provide insight portion of the elderly (p < 0.05), a market into the growth of ASCs in the U.S. from with higher per capita income (p < 0.01), or 1992-2001, during which period the num a market with a higher unemployment rate ber of ASCs increased from approximately HealTH CaRe FINaNCINg RevIew/Summer 2006/Volume 27, Number 4 119
- 10. 1,150 to over 2,900 in the MSAs studied. have been sufficient competition among Two hypotheses were advanced to explain local community hospitals to keep ambu the diffusion of ASCs across metropoli latory surgical prices low. Again, without tan areas. First, we argued that greater information on prices, we are unable to managed care penetration would result in directly confirm this speculation. greater entry of ASCs. This hypothesis Our study has some limitations. First, was rejected by the analysis. We found we only have information on the number that ASCs were less likely to enter markets of ASCs in each year. We do not know the with greater HMO penetration. There are specialty or specialties of each ASC, nor at least three explanations for this result. do we know the volume of services pro One explanation is that ASCs are not the vided. As a result, we have only the crudest efficient, low-cost providers of care that sense of the market presence of each ASC. their advocates claim. If HMOs aggressive Clearly, further work would benefit from ly seek value in contracting, the negative the use of claims data from CMS or private relationship between HMO penetration sectors that would allow a more detailed and ASC entry would suggest that HMOs examination of the role that ASCs play in do not find ASCs attracting contracting providing outpatient surgical care. Second, partners. A second explanation is that because of the crudeness of the ASC data, HMOs have been able to negotiate lower we have not invested in developing an prices with existing hospital providers of MSA specific mapping of the hospital net outpatient surgeries. As a result, the nego work formation that has occurred over this tiated lower prices have deterred ASCs period. As a result, our measures of hos to enter and service the market. Without pital contraction are understated. Third, information on prices we are unable to although a preliminary report (Medicare test this speculation. A third explanation Payment Advisory Commission, 2004a) is that greater HMO penetration has led to using cross-sectional data suggested that greater reliance on ASCs as outpatient sur CON regulations did not appear to be a gery providers, but our data are too crude major factor in ASC growth, we have not to show this reliance. We only know the tested the impact of CON regulations, but number of ASCs in each MSA in each year. instead have relied on MSA fixed effects to If managed care penetration is associated control for these generally stable legislative with exclusive contracting with one large programs. However, if CON regulations ASC, to the exclusion of others, we could have an impact on the growth of ASCs, and have fewer (but larger) ASCs in the local there were changes in CON regulations market and all our data would indicate specifically aimed at curbing the growth of would be fewer ASCs. ASCs, our estimated effects of HMO pen The second hypothesis was that there etration and hospital concentration might would be more ASCs in more concentrated be biased. hospital markets. This hypothesis was con The traditional hospital market is in firmed by the analysis. A metropolitan mar the midst of significant changes with the ket with 4 equal sized hospitals rather than ongoing diffusion of ASCs, the entry of 5, other things equal, was likely to have 2.5 specialty hospitals, and the development of additional ASCs per million people. This other traditionally hospital based services suggests that ASCs have been more likely that are being offered independently of to enter markets in which there may not the hospital. Much more research needs 120 HealTH CaRe FINaNCINg RevIew/Summer 2006/Volume 27, Number 4
- 11. to be directed at understanding the market Iglehart, J.K.: The Emergence of Physician-Owned forces at play, and the effects of these new Specialty Hospitals. New England Journal of Medicine 352(1):78-84, January 2005. types of providers on the volume and qual Lynk, W.J. and Longley, C.S.: The Effect of Physician- ity of care provided. Owned Surgicalcenters on Hospital Outpatient Surgery. Health Affairs 21(4):215-221, July/August aCKNOwleDgMeNT 2002. Melnick, G.A., Zwanziger, J., Bambezai, A. et al.: The authors would like to thank Laurence The Effects of Market Structure and Bargaining Position on Hospital Prices. Journal of Health Baker and Kathleen Dalton for generously Economics 11(3):217-233, October 1992. providing part of the data for our analysis. Mitchell, J.M.: Effects of Physician-Owned Limited- In addition, we appreciate many construc Service Hospitals: Evidence From Arizona. Health tive comments from Kathleen Dalton on Affairs W5:481-488, October 2005. Internet address: this manuscript. http://content.healthaf fairs.org/cgi/reprint/ hlthaff.w5.481v1. (Accessed 2006.) Mitchell, J.M. and Sass, T.R.: Physician Ownership ReFeReNCeS of Ancillary Services: Indirect Demand Inducement or Quality Assurance? Journal of Health Economics Altman, D., Cutler, D., and Zeckhauser, R.: Enrollee 14(3):263-289, August 1995. Mix, Treatment Intensity, and Cost in Competing Indemnity and HMO Plans. Journal of Health Medicare Payment Advisor y Commission: Economics 22(1):23-45, January 2003. Characteristics of Independent Diagnostic Testing Facilities and Ambulatory Surgical Centers. April Baker, L.C.: The Effect of HMOs on Fee-for-Service 2004a. Internet address: http://www.medpac.gov/ Health Expenditures: Evidence From Medicare. public_meetings/transcripts/0404_allcombined_ Journal of Health Economics 16(4):453-481, August transcripts.pdf. (Accessed 2006.) 1997. Medicare Payment Advisor y Commission: Bamezai, A., Zwanziger, J., Melnick, G.A., et al.: Ambulatory Surgical Center Services. Report to Price Competition and Hospital Cost Growth in Congress: Medicare Payment Policy. Washington, the United States, 1989-1994. Journal of Health DC. 2004b. Economics 8(3):233-243, May 1999. Morrisey, M.A.: Competition in Hospital and Health Casalino, L.P., Devers, K.J., and Brewster, L.R.: Insurance Markets: A Review and Research Agenda. Focused Factories? Physician-Owned Specialty Health Services Research 36(1 Pt 2):191-221, April Facilities. Health Affairs 22(6):56-67, November/ 2001. December 2003. Morrisey, M.A., Jensen, G.A., and Gabel, J.: Managed Cuellar, A.E. and Gertler, P.J.: Trends of Hospital Care and Employer Premiums. International Journal Consolidation: The Formation of Local Systems. of Health Care Finance and Economics 3(2):95-116, Health Affairs 22(6):77-87, November/December June 2003. 2003. Stensland, J. and Winter, A.: Do Physician-Owned Detmer, D.E. and Gelijns, A.C.: Ambulatory Surgery: Cardiac Hospitals Increase Utilization? Health A More Cost-Effective Treatment Strategy? Archives Affairs 25(1):119-129, January/February 2006. of Surgery 129(2):123-127, February 1994. U.S. Government Accountability Office: Competition Greenwald, L., Cromwell, J., Adamache, W., et al.: and Other Factors Linked to Wide Variation in Specialty Versus Community Hospitals: Referrals, Health Care Prices. GAO Report Number 05-856, Quality, and Community Benefits. Health Affairs August 2005. 25(1):106-118, January/February 2006. U.S. Department of Health and Human Services: Guterman, S.: Specialty Hospitals: A Problem or a Medicare Program: Physicians’ Referrals to Health Symptom? Health Affairs 25(1):95-105, January/ Care Entities with Which They Have Financial February 2006. Relationships (Phase II). March 2004. Internet Herzlinger, R.E.: Specialization and Its Discounts: address: http://www.cms.hhs.gov/quar terly The Pernicious Impact of Regulations Against providerupdated/downloads/CMS18101FC.pdf Specialization and Physician Ownership on the U.S. (Accessed 2006.) Healthcare System. Circulation 109(20):2376-2378, May 2004. HealTH CaRe FINaNCINg RevIew/Summer 2006/Volume 27, Number 4 121
- 12. U.S. Department of Justice: The Herfindahl- Hirschman Index. Internet address: http://www. usdoj.gov/atr/public/testimony/hhi.htm. (Accessed 2006.) White, H.: A Heteroskedasticity-Consistent Covariate Matrix Estimator and a Direct Test for Heteroskedasticity. Econometrica 48(4):817-838, May 1980. Winter, A.: Comparing the Mix of Patients in Various Outpatient Surgery Settings. Health Affairs 22(6):68-75, November/December 2003. Reprint Requests: John Bian, Ph.D., University of Alabama at Birmingham, MT 640, 1530 3rd Avenue S, Birmingham, AL 35294. E-mail: jbian@uab.edu 122 HealTH CaRe FINaNCINg RevIew/Summer 2006/Volume 27, Number 4