
Recomendados
Recomendados
Más contenido relacionado
La actualidad más candente
La actualidad más candente (20)
Destacado
Destacado (16)
Similar a Jmeter
Similar a Jmeter (20)
Más de prabakaranbrick
Último
Último (20)
Jmeter
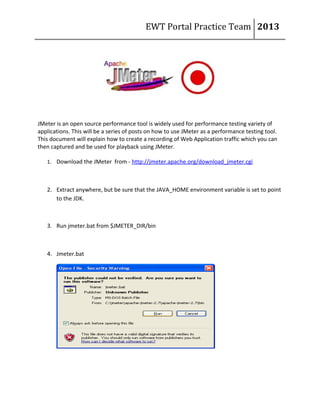
- 1. EWT Portal Practice Team 2013 JMeter is an open source performance tool is widely used for performance testing variety of applications. This will be a series of posts on how to use JMeter as a performance testing tool. This document will explain how to create a recording of Web Application traffic which you can then captured and be used for playback using JMeter. 1. Download the JMeter from - http://jmeter.apache.org/download_jmeter.cgi 2. Extract anywhere, but be sure that the JAVA_HOME environment variable is set to point to the JDK. 3. Run jmeter.bat from $JMETER_DIR/bin 4. Jmeter.bat
- 2. EWT Portal Practice Team 2013 5. When JMeter is launched the default items loaded are Test Plan and Work bench. To start with recording using JMeter, A thread group has to be added to the Test Plan 6. Navigate to Test Plan –> Right Click –> Add –> Threads (users) –> Thread Group Add Http Requests defaults to the thread group 7. Navigate to SAS thread group –> Right Click –> Config element –> Http Requests default
- 3. EWT Portal Practice Team 2013 8. Configure Http Requests default – Enter the URL that the script has to be generated for in the field Server Name or IP Add a Http Proxy server to the Work Bench
- 4. EWT Portal Practice Team 2013 9. Configure the Http Proxy Server with below values Port: 8080 (default value) Target Controller: Test Plan > Thread Group Grouping: Put each group in a new Transaction controller 10. Now configure your favorite browser to send the requests on the port 8080. In case of Internet explorer the steps are as below: Launch IE –> Navigate to tools –> Internet options –> Connections –> LAN Settings –> Check the field “Use a proxy server for your LAN and enter the details as Address: localhost and port 8080. Screenshot attached for reference 11. Now everything is set to start recording the user actions in JMeter Reference : http://www.jroller.com/dissonance/entry/jmeter_quickstart_for_load_testing