Essen bioscience neuromics 9_17_12
•Descargar como PPTX, PDF•
2 recomendaciones•1,518 vistas

Providing tools that insure excellent Cell Based Assays is a cornerstone of our business strategy. Lauren McGillicuddy and her team at Essen Bioscience have been using our E18 Primary Rat Cortical Neurons to develop NeuroTrakTM assays enabling kinetic quantification of neurite dynamics (initiation, branching, extension, retraction). NeuroTrack is one of several CellPlayerTM assays that can be run in IncuCyte ZoomTM.

Recomendados
Recomendados
Más contenido relacionado
Similar a Essen bioscience neuromics 9_17_12
Similar a Essen bioscience neuromics 9_17_12 (20)
Más de Pete Shuster
Más de Pete Shuster (20)
Último
Último (20)
Essen bioscience neuromics 9_17_12
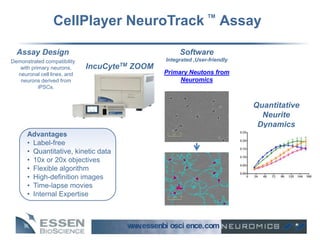
- 1. CellPlayer NeuroTrack ™ Assay Assay Design Software Demonstrated compatibility Integrated ,User-friendly with primary neurons, IncuCyteTM ZOOM neuronal cell lines, and Primary Neutons from neurons derived from Neuromics iPSCs. Quantitative Neurite Dynamics Advantages • Label-free • Quantitative, kinetic data • 10x or 20x objectives • Flexible algorithm • High-definition images • Time-lapse movies • Internal Expertise w .essenbi osci ence.com ww
- 2. Tracking Neurite Dynamics Neurite Outgrowth Fukata et al., Neuroscience Research, Vol. 43, Issue 4, August 2002, Pages 305–315 w .essenbi osci ence.com ww
- 3. Tracking Neurite Dynamics Fundamental Role In Neurite Outgrowth • Embryonic development • Neuronal differentiation • Nervous system function • Neuropathological disorders • Neuronal injury and regeneration • Neurotoxicity Fukata et al., Neuroscience Research, Vol. 43, Issue 4, August 2002, Pages 305–315 w .essenbi osci ence.com ww
- 4. Neurite Outgrowth Analysis: High Content Imaging Approach Fix cells - Single time point - Paraformaldehyde fixation -risk loss of fine neurites Antibody Labeling (immunofluorescence) - Protocols require a few hours at minimum - Multiple antibodies Image Acquisition and Analysis - High Content Imager and software w .essenbi osci ence.com ww
- 5. Neurite Outgrowth Analysis: High Content Imaging Approach Fix cells - Single time point - Paraformaldehyde fixation -risk loss of fine neurites Antibody Labeling (immunofluorescence) - Protocols require a few hours at minimum - Multiple antibodies Image Acquisition and Analysis - High Content Imager and software Labor intensive, complex, results in data from a single time point. w .essenbi osci ence.com ww
- 6. NeuroTrack ™ Assay Protocol Cortical Neurons Hippocampal Neurons Neuro-2a Cells iCell Neurons® Select Cells: We recommend Techno Plastic Products (TPP) Plate Cells: tissue culture plates for optimal clarity. Change media 18-24hrs post cell plating. Apply test Media Change: agents (compounds, growth factors). Place vessels in IncuCyte Zoom and image at user Image cells: defined intervals. w .essenbi osci ence.com ww
- 7. Measuring Neurite Dynamics with NeuroTrack ™ Non-labeled E18 rat cortical neurons plated on poly-D-lysine HD Phase Segmentation T=24hrs T=72hrs T=120hrs w .essenbi osci ence.com ww
- 8. NeuroTrack is compatible with primary neurons in phase w .essenbi osci ence.com ww
- 9. NeuroTrack ™ Quantifies Neurite Dynamics in Real-Time w .essenbi osci ence.com ww
- 10. Measuring Neurite Dynamics with NeuroTrack ™ Time lapse series of images and masks Quantitative data Time lapse movies Neurite Length 150 16k cells/well Neurite length (mm/mm2 ) Neurite Length/Cell Body Cluster Neurite length (mm/cell body cluster) 12k cells/well 0.8 Branch Points 100 8k cells/well 4k cells/well 4k cells/well 0.6 4000 8k cells/well 16k cells/well Branch Points (1/mm2 ) 12k cells/well 50 12k cells/well 0.4 3000 16k cells/well 8k cells/well 4k cells/well 0.2 2000 0 0 24 48 72 96 120 144 Time post plating (hours) 0.0 1000 0 24 48 72 96 120 144 Time post plating (hours) 0 0 24 48 72 96 120 144 Time post plating (hours) w .essenbi osci ence.com ww
- 11. Assay Validation: NeuroTrack ™ vs. Endpoint Assay A B • Data points represent mean ± SD, n=30 NeuroTrack quantitation of living neurites in HD phase is comparable to the quantitation of fixed and stained A) NeuroTrack phase image with mask neurites in a high content imager. B) β-tubulin staining in fixed cells w .essenbi osci ence.com ww
- 12. Low Intra Assay Variability Non-labeled E18 rat cortical neurons plated on poly-D-lysine 96-well Plate View • Data points represent mean ± SD, n=96 w .essenbi osci ence.com ww
- 13. E18 Rat Cortical Neurons: NeuroTrack ™ Assay Optimization w .essenbi osci ence.com ww
- 14. Cytochalasin D treatment of E18 cortical neurons highlights the importance of a kinetic read-out • Cytochalasin D depolymerizes the actin cytoskeleton. Cytochalasin D Treatment: Neurite Length • Neurite length (mm/cell body cluster) It has been shown that treatment of neurons with high 0.25 Cytochalasin D concentrations of Cytochalasin D results in the rapid concentration development of multiple axon-like structures. * 0.20 1 µM 0.3 µM • However, a NeuroTrack time course reveals that these 0.15 Vehicle structures are transient due to neurite disintegration and cell 0.10 0.1 µM death. 0.05 • In contrast, low concentrations of Cytochalasin D inhibit overall mean ± SD, n=6, 9 images /well 0.00 neurite outgrowth. 0 24 48 72 96 120 144 Time post plating (hours) w .essenbi osci ence.com ww
- 15. Cytochalasin D treatment of E18 cortical neurons highlights the importance of a kinetic read-out • Cytochalasin D depolymerizes the actin cytoskeleton. Cytochalasin D Treatment: Neurite Length Neurite length (mm/cell body cluster) • It has been shown that treatment of neurons with high 0.25 Cytochalasin D concentrations of Cytochalasin D results in the rapid concentration development of multiple axon-like structures. * 0.20 1 µM 0.3 µM • However, a NeuroTrack time course reveals that these 0.15 Vehicle structures are transient due to neurite disintegration and cell 0.10 0.1 µM death. 0.05 • In contrast, low concentrations of Cytochalasin D inhibit overall mean ± SD, n=6, 9 images /well 0.00 neurite outgrowth. 0 24 48 72 96 120 144 Time post plating (hours) A B A: Cortical neurons treated with vehicle (T=66hrs) B: Cortical neurons treated with1 µM Cyto D (T=66hrs) *Bradke and Dotti, Science, 1999 • Data points represent mean ± SD, n=6 w .essenbi osci ence.com ww
- 16. Cytochalasin D treatment of E18 cortical neurons highlights the importance of a kinetic read-out • Cytochalasin D depolymerizes the actin cytoskeleton. Cytochalasin D Treatment: Neurite Length Neurite length (mm/cell body cluster) • It has been shown that treatment of neurons with high 0.25 Cytochalasin D concentrations of Cytochalasin D results in the rapid concentration development of multiple axon-like structures. * 0.20 1 µM 0.3 µM • However, a NeuroTrack time course reveals that these 0.15 Vehicle structures are transient due to neurite disintegration and cell 0.10 0.1 µM death. 0.05 • In contrast, low concentrations of Cytochalasin D inhibit overall mean ± SD, n=6, 9 images /well 0.00 neurite outgrowth. 0 24 48 72 96 120 144 A B Time post plating (hours) A B B A: Cortical neurons treated with vehicle (T=66hrs) B: Cortical neurons treated with1 µM Cyto D (T=66hrs) *Bradke and Dotti, Science, 1999 • Data points represent mean ± SD, n=6 w .essenbi osci ence.com ww
- 17. Measure Neurite Dynamics and Cytotoxicity • Measure cytotoxicity and neurite outgrowth kinetically in the same well. YoPro-3® (Life Technologies) is a cell impermeant cyanine dimer nucleic acid stain that binds dsDNA. Apoptosis and necrosis result in a loss of membrane integrity. YoPro-3 ® stains cell nuclei only when cells have lost membrane integrity, viable cells remain unstained. YoPro-3® + cytotoxic compound We have optimized the use of YoPro-3 ® for use in monitoring cytotoxicity kinetically in primary cortical neurons. Control 0.1 µM R0-31-8220 1 µM R0-31-8220 w .essenbi osci ence.com ww
- 18. Measure Neurite Dynamics and Cytotoxicity • Measure cytotoxicity and neurite outgrowth kinetically in the same well. YoPro-3® (Life Technologies) is a cell impermeant cyanine dimer nucleic acid stain that binds dsDNA. Apoptosis and necrosis result in a loss of membrane integrity. YoPro-3 ® stains cell nuclei only when cells have lost membrane integrity, viable cells remain unstained. YoPro-3® + cytotoxic compound We have optimized the use of YoPro-3 ® for use in monitoring cytotoxicity kinetically in primary cortical neurons. Control 0.1 µM R0-31-8220 1 µM R0-31-8220 w .essenbi osci ence.com ww
- 19. Neurite Outgrowth + Cytotoxicity Measuring cytotoxicity and neurite length in response to PKC inhibition: 24 hours post plating, E18 rat cortical neurons were treated with different concentrations of the PKC inhibitor, Ro-31-8220, in the presence of Yo-Pro3 ®. Neurite Length/Cell Body Cluster Neurite length (mm/cell body cluster) 0.5 Vehicle 0.004 µM Ro-31-8220 0.4 0.02 µM Ro-31-8220 0.3 0.1 µM Ro-31-8220 0.5 µM Ro-31-8220 0.2 1 µM Ro-31-8220 0.1 0.0 0 24 48 72 96 120 144 Time post plating (hours) • Data points represent mean ± SD, n=6, 9 images/well w .essenbi osci ence.com ww
- 20. Neurite Outgrowth + Cytotoxicity Measuring cytotoxicity and neurite length in response to PKC inhibition: 24 hours post plating, E18 rat cortical neurons were treated with different concentrations of the PKC inhibitor, Ro-31-8220, in the presence of Yo-Pro3 ®. Neurite Length/Cell Body Cluster Cell Death Neurite length (mm/cell body cluster) YoPro-3 Red Object Count/mm2 0.5 300 Vehicle 0.004 µM Ro-31-8220 0.4 1 µM Ro-31-8220 0.02 µM Ro-31-8220 0.5 µM Ro-31-8220 200 0.3 0.1 µM Ro-31-8220 0.1 µM Ro-31-8220 0.5 µM Ro-31-8220 0.02 µM Ro-31-8220 0.2 1 µM Ro-31-8220 100 0.004 µM Ro-31-8220 Vehicle 0.1 0.0 0 0 24 48 72 96 120 144 0 24 48 72 96 120 144 Time post plating (hours) Time post plating (hours) • Data points represent mean ± SD, n=6, 9 images/well w .essenbi osci ence.com ww
- 21. CellPlayer NeuroTrack™ Assay • The HD Phase optics, integrated software algorithm and live-cell Label-free: imaging obviates the need to fix and label cells. • Time lapse measurement of neurite dynamics under physiological Kinetic: conditions. Images can be assembled into time-lapse movies. Compatible with multiple • Validated with rodent primary neurons, iPSC derived neurons and neuronal cell types: Neuro-2A cells. • Automated data acquisition and integrated metric calculations Easy to use software: provide convenient access to complex data. Multiplex: • Monitor a fluorescent label as well as neurite dynamics. w .essenbi osci ence.com ww
Notas del editor
- An Overview of the assay:-compatible in every neuronal cell type we tested-run exclusively on ZOOM-as in all incucyte assays images are captured at user defined intervals-from the phase images, a mask is applied, from the mask, quantitation is derived-advantages (Flexible algorithm means compatible with multiple cell types)
- What are neurite dynamics?A term that includes neurite outgrowth, in which a neuron extends processes to create neural networksHere you see the stages of outgrowth, in which axons and dendrites formNeurite is a non-specific term including both axons and dendritesIn addition to outgrowth, loss of neurite length is included in neurite dynamics, and is also important to studies of development and degenerative diseasesNote: NeuroTrack does not distinguish between axons/dendrites
- Neurite dynamics have an important role in….
- Generally paraformaldehyde used—not a user friendly chemical.Long time required for incubation with antibodies
- POINT: Labor intensive process, complex, plenty of troubleshooting involved, and all for data that comes from only a single timepoint!Essen combined the capabilities of ZOOM and the talent of the programming engineers to improve the system for measuring neurite dynamics.
- This is the alternative protocol NeuroTrack (NT) provides scientists.Step 1: Select cells. Very important fact that NT is compatible with such a wide range of models, as they have very different morphology.
- These are non labeled E18 rat cortical neurons plated on poly-D-lysine at 3 different timepoints post-plating1. Really there is a minimal amount of user involvement needed to create a very good mask like the one you see here. There are just enough parameters to customize to the user’s cell type, but it’s not an overwhelming process. HCI systems in comparison have much more complex, time consuming processes. A good processing definition on NeuroTrack can be made in under 10 minutes.
- NT masks these very fine primary neurites with the same precision as large, thick neurites.
- This is a slide showing the NeuroTrack process– From the phase images, it generates the user-customized mask, and from this mask quantitative data is produced in real-time.
- This slide summarizes the flow of information in a NeuroTrack assay—the phase images of the cells can be made into time lapse movies, and the masks automatically produce data of the metrics just described.
- Scientists at Essen performed assay validation in an experiment where they took plates of cells at three different timepoints, imaged in ZOOM, and immediately fixed, immunostained with Beta-tubulin, the standard for labeling neurites in fluorescence. These plates they took to the University of Michigan to image in their Image Xpress Micro. They utilized their corresponding software to measure neurite length and compared the results with the ZOOM analysis. In these graphs of three different timepoints you see that “NeuroTrack quantitation…..in a high content imager.”
- The intra-assay variability was quantified using “non….on polydlysine” plated at 8k cells/wellError bars represent standard deviationCoefficient of variation remains well under 10%.96 well plate view demonstrates low variability.A corresponding power analysis demonstrated that N=6 with 9 images per well is suggested. (for an assay of 80% power to show a 10% change in neurite length)
- Movie at optimal density.
- POINT: shows the importance of a kinetic readout, how it completes the story of cytochalasin D’s effectsThese results were replicated 2 more times at Essen and agree with reports from the literature.
- Below you see the pictures, longer structures in B. (~25% longer)
- Masked.
- Another important application of a fluorescent marker. Images show control cells and two concentrations of a PKC inhibitor and the resulting increase in red fluorescent objects.
- Here is a close up of the red blended image—we chose to use the lowest concentration of YoPro that the Basic Analyzer was capable of masking, so concentration of YoPro-3, and thus the fluorescence is very low. This concentration of YoPro-3 (and concentrations even higher) have been shown to produce no effect on cell viability or neurite outgrowth.
- Example of how to use this reagent. We used Ro-31-8220 which is a known PKC inhibitor. Protein kinase C is upstream of neurite outgrowth and survival signal transduction pathway, and adding a PKC inhibitor caused the predicted effect of decreased neurite length per cell body cluster with increasing concentration of inhibitor. It’s very useful to know if and when cell death is occurring during this assay.
- So this data was produced using a Basic Analyzer processing definition to show that the higher concentrations of Ro-31-8220 have higher cell death, and this cell death is the cause of the loss of neurite length.