Polygenic inheritance
•Descargar como PPTX, PDF•
3 recomendaciones•4,021 vistas

This PPT consists of 24 slides explaining Polygenic Inheritance . Some traits are controlled by two or more genes. These traits differ from Mendelian traits and donot show discrete alternative or contrasting forms and show continuous ranges. Examples of such traits are wheat seed colour, plant height, Human skin colour controlled by at least three genes showing many shades of dark and fare, human height, human eye colour etc

Recomendados
Más contenido relacionado
La actualidad más candente
La actualidad más candente (20)
Similar a Polygenic inheritance
Similar a Polygenic inheritance (20)
Más de ICHHA PURAK
Más de ICHHA PURAK (20)
Último
Último (20)
Polygenic inheritance
- 1. POLYGENIC INHERITANCE /QUANTITATIVE INHERITANCE CUMULATIVE/ADDITIVE GENE ACTION By Dr. ICHHA PURAK UNIVERSITY PROFESSOR IN BOTANY RANCHI WOMEN’S COLLEGE,RANCHI
- 2. QUANTITATIVE TRAITS (METRIC)/ VS QUALITATIVE TRAITS CONTINUOUS VARIATION VS DISCONTINUOUS VARIATION POLYGENE VS OLIGOGENE MULTIPLE FACTOR HYPOTHESIS : SEED COLOUR WHEAT /OAT 1:4:6:4:1 HUMAN SKIN COLOUR CONTROLLED BY THREE GENES 1: 6 : 15 : 20 : 15 : 6 :1 HUMAN HEIGHT
- 3. Gregor Mendel studied many traits that have distinct alternative (quite contrasting or remarkable )forms for instance Red vs white flowers and Tall vs dwarf plants Such phenotypic classes are called discontinuous, can be termed as qualitative traits showing discrete alternative forms ,are governed by one gene and its two alleles (R and r or T and t) . These are known as oligogenes or major genes But many traits are more complex than these and basically can take a number of continuous values such as height in human, weight, yield in crops, skin colour in human beings (many different shades between very dark and very fare ), I Q etc. controlled by many genes interacting with each other and also with environment. The study of such quantitative traits controlled by many genes and also by environment is called Quantitative genetics ( Inheritance) The inheritance of quantitative traits is typically viewed in terms of polygenic inheritance. Genes that contribute to quantitative traits are referred to as polygenes (Minor genes) or QTLs ( Quantitative Trait Loci).
- 4. Polygenic inheritance (Cumulative/Additive gene action) As for example skin colour in human has a number of shades of fair and dark. In these traits there are no alternative forms, instead different ranges are present and are called as continuous ranges. In plants also height, seed colour, seed size etc. are common examples. Such traits are known as polygenic or quantitative traits and are generally controlled by 2,3 or more genes and phenotype is resulted by cumulative effect of many genes, but here again the inheritance of one gene takes place in mendelian pattern and as a result very few individuals fall into parental categories. Polygenic traits are not expressed as absolute or discrete characters as that of Mendelian pea traits. Polygenic traits are recognizable as gradation of small differences (a continuous variation). The results form a bell shaped curve having extremes on two sides and mean values (common phenotypes).
- 5. Inheritance of Quantitative characters Some characters show discontinuous variation, while a majority of biologically important traits exhibit continuous variation and are subjected to measurements such traits are referred as quantitative (Metric) traits. Features of Quantitative traits 1. Continuous variation 2. Studied by measuring their intensity 3. Markedly affected by environment 4. Genetic analysis a) Not possible by classical Mendelian approach b) based on statistical (biometrical) procedure 5. Governed by several genes with small additive effects 6.These alleles neither dominate or supreess other allele.Each allele contribues its share 7. Positive alleles contribute in additive fashion .Negative alleles do not add 8. The Environment interacts with the genotype to produce the final phenotype
- 6. HISTORICAL WORK RELATED WITH POLYGENIC INHERITANCE Yule (1906) stated that each of several genes affecting a quantitative trait had small and cumulative effect and do not show dominance but continuous variation --example seed size Phaseolous vulgaris (Rajma) Nelsson Ehle (1908) presented multiple factor hypothesis to explain his results on inheritance of seed colour in wheat and oats. Nelson Ehle (1908) demonstrated existence of several genes where small cumulative effects governing single trait commonly known as polygenes (Minor genes) because they give only small effect. In contrast Mendelian genes having large effect on the character they govern are called oligogenes (Major genes)
- 7. While studying seed colour in wheat and oat Ehle (1908) obtained ratio 15:1 in F2 generation. However on closer examination of coloured seeds, he found that there was marked difference in intensity of their colour and therefore he classified the seeds on the basis of intensity of colour into 4 distinct classes 1) dark red 2) medium dark red 3) medium red 4) light red and 5) white in ratio 1:4:6:4:1 and so superficially 15:1 ratio. Seed colour in Wheat/Oat is governed by -Two genes R1 & R2 -Upper case/dominant alleles R1 & R2 produce colour - lowercase /recessive alleles r1 &r2 do not produce colour - Each positive allele produce a small amount of colour -Effects of all positive alleles are cumulative/additive - Intensity of grain colour is determined by number of positive alleles both R1 and R2
- 8. Parents M R1R2R1R2 X F r1r2r1r2 P gametes R1R2 r1r2 F1 R1r1R2r2 medium red F1 gametes Genetic Expression ↓ → Female Male R1R2 R1r2 r1R2 r1r2 R1R2 R1R2 R1R2 ● 1 R1r2 R1R2 ○ 2 r1R2 R1R2 ○ 3 r1r2 R1R2 4 α R1r2 R1R2 R1r2 ○ 5 R1r2 R1r2 6 α r1R2 R1r2 7 α r1r2 R1r2 8 % r1R2 R1R2 r1R2 ○ 9 R1r2 r1R2 10 α r1R2 r1R2 11 α r1r2 r1R2 12 % r1r2 R1R2 r1r2 13 α R1r2 r1r2 14 % r1R2 r1r2 15 % r1r2 r1r2 16 ●
- 9. Genotype Frequency No of dominant alleles Phenotye Frequency R1R2R1R2 1 4+0 Dark Red 1(1) R1r1R1R2 R1R2R1r2 2 2 3+1 3+1 Medium Dark red 4(2,3,5,9) R1r1R2r2 R1R1r2r2 r1r1R2R2 4 1 1 2+2 2+2 2+2 Medium Red 6(4,6,7,10,11,13) R1r1r1r2 r1r2R2r1 2 2 1+3 1+3 Light Red 4(8,12,14,15) r1r1r2r2 1 0+4 white 1(16) However seed colour of wheat and oat do not show continuous variation .Classified into a few distinct groups on intensity of colour. Characters governed by polygenes (multiple factors) but showing discrete (more than two) variations are called Quasi- quantitative characters.
- 10. AB Ab aB ab AB AAB B 1 AABb 2 AaBB 3 AaBb 4 Ab AABb 5 AAbb 6 AaBb 7 Aabb 8 aB AaBB 9 AaBb 10 aaBB 11 aaBb 1 2 ab AaBb 13 Aabb 14 aaBb 15 Aabb 16 4 D -1 --------------------------------------------1 3 D+1R-2,3,5,9 ------------------------------- 4 2D+2R- 4,6,7,10,11, 13--------------------6 1D+3R-8,12,14,15 -------------------------- 4 4R-16 ---------------------------------------------1 (1:4:6:4:1) Quantitative character is governed by several genes, the positive alleles of all genes governing the trait are similar to each other in their action and these effects are additive or cumulative in nature
- 11. F2 Phenotype -5 classes 1. 4 dominant -----1/16 dark Red----------1 2. 3 dominant and 1 recessive ----4/16 Medium dark red-----------4 3. 2 dominant and 2 recessive ---6/16 Medium Red -----------6 4. 1 dominant and 3 recessive ----4/16 light red ---------------- 4 5. 4 recessive ----1/16 white--------------------- 1
- 12. Formula to calculate number of classes expected in F2 generation and frequency of progeny that fell in the extreme class The number of classes (Continuous variation) depend upon number of genes involved in expression of trait If N genes are heterozygous in F1 hybrid, In F2 there will be 2N+1 (phenotypic classes) 1 gene --------- 2x1+1= 3 2genes---------- 2x2+1= 5 3 genes--------- 2x3+1= 7 4genes--------- 2x4+1= 9 The fraction of individuals falling into each of extreme classes will be 1/4th to the power N (1x4)N (1x4)2 =1/16 , (1/4) 3 = 1/64 --------- parental types. Bell shaped graph can be obtained if frequency of different classes are plotted.
- 13. Usually polygenic traits are distinguished by 1. Polygenic traits are usually quantified by measurement rather than counting. 2. Two or more gene pairs contribute to the phenotype. 3. Phenotypic expression of polygenic traits varies over a wide range. Human polygenic traits include Height, Weight, Eye Color, Intelligence, Skin Color etc. Second example : Skin colour in human 3 genes are involved Let us assume that skin colour is controlled by three genes A,B & C and their recessive alleles a,b,&c The colour of human skin is determined by the amount of dark pigment (melanin) it contains
- 14. The pigment melanin is responsible for dark coloration in the skin and there are at least three genes, which control for human skin color. Using a hypothetical example where the production of melanin is controlled by contributing alleles (denoted here as A, B and C), resulting in dark skin color, and therefore light skin color is produced by non contributing alleles (denoted here as a, b and c), it is possible to see how the spectrum of different skin colors can result in the offspring. It is important to remember here that in polygenic inheritance, alleles do not display dominance over others, rather, each contributing allele gives an additive effect rather than a masking effect, and so the way that the alleles interact is different to those in Mendelian genetics. The additive effect means that each contributing allele produces one unit of color.
- 15. In an example using two parents, heterozygous for each of the melanin-producing genes (AaBbCc x AaBbCc), it is possible to see how the additive effects and combinations of alleles results in all the possible genotypes In this simplified example, there are 64 possible allele combinations, which result in the production of 7 different colored skin tones. The skin tones which are least likely to occur are those resulting from entirely homozygous genotypes. The lightest skin tone, 0 (aabbcc), which lacks any alleles contributing melanin pigment, or the darkest skin tone, 6 (AABBCC), which contains all possible contributing alleles; each of these phenotypes occurs at a probability of 1/64.
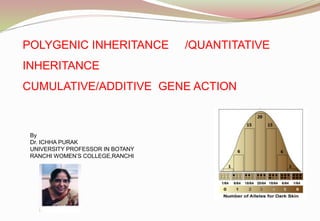
- 16. As the number of contributing alleles changes within the allele combinations, the units of melanin pigment increases and decreases; the probability of the second lightest or darkest skin tones (1 or 5) is 6/64, the third lightest or darkest skin tones (2 or 4), is 15/64 and an entirely intermediate skin tone (3) is the most common at 20/64. As shown in the histogram above, this pattern fits the normal distribution.
- 17. Cross between very dark skin and very fair skin Intermediate skin colour expected in F1 and then two intermediate skin colour individuals are mated – 8 types of male and 8 types of female gametes – 64 combinations of which 1/64 extremely fair and 1/64 extremely dark are the only parental types and rest show 5 different grades of pigmentation. So resulted phenotypic ratio is 1:6:15:20:15 :6:1 It is clear that 1. only few 1/64+1/64=2/64 fall into parental categories 2. Expression level of phenotype depends upon the number of contributing alleles (Dominant/Recessive) 3. On plotting F2 data inverted bell shaped curve/graph resulted
- 19. The role of many genes (polygenic inheritance) in production of a continuum of phenotypes. Courtsey: The Science of Biology, 4th Edition.W H Freeman
- 20. Human skin colour controlled by 3 genes Aa Bb Cc 7 classes 1. 6 Dominant alleles - very dark 2. 5 Dominant alleles + 1 Recessive allele 3. 4 Dominant alleles +2 Recessive alleles 4. 3 Dominant alleles + 3 Recessive alleles 5. 2 Dominant alleles +4 Recessive alleles 6. 1 Dominant allele + 5 Recessive allele 7. 0 Dominant allele + 6 Recessive allele - very fair Different shades Each dominant allele add colour
- 22. 3rd Example :Human Height Human height is an extremely complex polygenic inheritance pattern. About 400 genes are supposed to control this trait. It is therefore quite difficult to predict the height of offsprings. Two parents having short height may have tall child. Two tall parents may have child of short height. The height shows a number of ranges In addition ,height is known as a multifactorial trait,which means that the trait is influenced by multiple genes and is being affected by environment. Final height of a child depends on general health ,food habits,exposure to diseases etc
- 23. Other example Colour of Eye colour in Human
- 24. THE END THANKS