SlideShare una empresa de Scribd logo
1 de 8
Descargar para leer sin conexión
Q4 2013 » Putnam Perspectives

Capital Markets Outlook
Jason R. Vaillancourt, CFA
Co-Head of Global Asset Allocation

Investment themes

Key takeaways
•	If U.S. politics do not derail the recovery, pent-up demand
can drive faster economic growth.

If U.S. politics do not derail the
recovery, pent-up demand can
drive faster economic growth.

l

U.S. small cap
EQUITY

U.S. large cap

l

U.S. value

l

U.S. growth

l

Europe

l

Japan

l

Emerging markets

FIXED INCOME

U.S. government

l
l

U.S. tax exempt
U.S. investment-grade corporates

l
l

U.S. mortgage-backed

l

U.S. floating-rate bank loans

l

U.S. high yield

l

Non-U.S. developed country

l

Emerging markets

l

COMMODITIES

l

CASH

l

CURRENCY SNAPSHOT

Dollar vs. euro: Favor euro (from favor dollar last quarter)
Dollar vs. pound: Neutral (from favor dollar last quarter)
Dollar vs. yen: Neutral (from favor dollar last quarter)

Overweight

Small overweight

Asset class

Neutral

Arrows in the table indicate the change
from the previous quarter.

Underweight

Putnam’s outlook

Small underweight

•	Fixed-income outflows appear likely to continue, pushing
rates higher.

The Federal Reserve’s Open Market
Committee (FOMC) has enough smarts and
market savvy to realize that it had a green
light to begin the slow exit from its Large
Scale Asset Purchase (LSAP) program at
its September meeting, but they chose to
pass up the opportunity. This should be
viewed as a somewhat troubling development since it seems to suggest that the Fed
interprets current economic data as showing
that slow growth and the risk of deflation
remain problematic. Evidence for this concern
could include the fact, as we pointed out last
quarter, that the rate of unemployment has
been falling primarily because the labor force
participation rate has continued to decline, not
because of robust hiring.
Perhaps the move by the Fed to delay
tapering foreshadowed the likelihood that
Janet Yellen would take the helm at the Fed
once Larry Summers was out of the picture.
The evidence would suggest that Yellen is
even more of a policy dove than Bernanke.
It is also quite likely that the Fed anticipated
that some market disruption might arise from
the then-looming partial federal government shutdown and a potentially messy
debate regarding extension of the debt
ceiling. Indeed, in a number of speeches since
September, FOMC voting members have
expressed an offset to fiscal policy as a reason
to delay tapering, suggesting that politics has
become a factor that the Fed must consider in
setting policy. Understanding the subtleties of
this shift in strategy and communication will
be of critical importance in upcoming quarters
and beyond.
Q4 2013 |  Capital Markets Outlook

Figure 1. � ousehold formation and capital
H
expenditures have been slow to rebound

2.5%

34%

2.0%

31%

1.5%

28%

1.0%

25%

0.5%

22%

0.0%

19%

-0.5%

16%

3/1/03 2004

2005

2006

2007

2008

2009

2010

2011

2012 9/30/13

Beyond watching the actions of the Fed, we are also
carefully monitoring our indicators of global growth. U.S.
GDP growth during the recovery, underway since the
middle of 2009, is among the weakest in recent history,
averaging a little over 2% for the past four years, well
below the previous long-term trends of 3% to 3.5%. For
years, investors have been looking for the economy to
shift to a faster gear, what economists sometimes refer to
as “escape velocity.”

It would take additional
spending, driven by
rising expectations, for
the economy to provide
the setting for stronger
earnings growth.
Percentage change in
occupied housing units
Net percentage of business
owners planning new
capital expenditures 
Source: U.S. Census Bureau and National Federation
of Independent Business. Household formation data
represent monthly year-over-year percentage change in
occupied housing units from February 2003 to June 2013.
Capital expenditures data represent the net percentage
of business owners planning a capital expenditure over
the next 3–6 months, based on NFIB monthly surveys
from February 2003 to September 2013.

The good news is that a reacceleration into 2014 seems
to be on track, with the litany of global macro risks beginning to recede, provided that U.S. politics does not derail
the recovery. The thrust that could push the economy
higher may come from pent-up demand from households
and businesses. Household formation fell sharply during
this downturn and only began to pick up again in 2012 as
more people felt confident to move into their own apartments or to buy houses, which are the preconditions for
future growth in consumer spending. Businesses, similarly, have been slow to ramp up capital expenditures and
hiring. The big question today is whether CEOs and CFOs
perhaps see the same signals that the Fed perceived. Do
they have high expectations warranting greater investment and hiring, or do they detect weakness that calls
for continued caution? It would take additional spending,
driven by rising expectations, for the economy to provide
the setting for stronger earnings growth.

Such a shift appeared likely in mid 2011, until the escalation of the European sovereign credit crisis, Japanese
tsunami, and U.S. credit downgrade triggered turmoil.
Hopes also increased in 2012, before Europe again
tottered on the edge of a deleveraging crisis and the U.S.
government went to the precipice of the fiscal cliff. In both
cases, the pace of GDP growth declined, bordering on
what might be called “stall speed.”
The difference between a 2% and a 3% growth rate may
not seem like much, but it influences what has historically
been a strong relationship between real GDP growth and
corporate profits. Over the past five quarters, the revenue
growth of S&P 500 companies has barely been above 1%,
providing little impetus to bottom-line earnings growth.

2
PUTNAM INVESTM ENTS |  putnam.com

Fixed-income outflows appear likely to
continue, pushing rates higher.

strategy becomes much more important. The Fed has
been grappling with a communications strategy in subsequent meetings. The process of normalizing monetary
policy actually began at the end of 2012 when the Fed
adopted a more data-dependent strategy for keeping
rates low, as opposed to its previous approach, a fixed
time commitment. This process continued at the end of
April 2013 when the first hints emerged that the Fed might
begin to slow its asset purchase program. The next step
would be to actually begin to taper, leading to an eventual
cessation of QE, and then to the ultimate step of removing
its zero interest-rate policy.

A reasonable rule of thumb is that over time, 10-year
government bond yields can be approximated by the
long-term rate of real growth in the economy, plus both
an inflation premium and a term premium (what investors
should be paid for moving further out on the yield curve).
By this metric, U.S. Treasury yields have been substantially
below where they “should” be. This has largely been the
case since the Fed initiated extraordinary policy measures
in 2008, in the middle of the financial crisis, when the
federal funds rate went to an unprecedented range of
0%–0.25%. Extraordinary measures reached a high point
in mid 2012 with larger bond purchases and the openended commitment to low interest rates, at a time when
the 10-year Treasury yield reached the historic low of
nearly 1.4%.

Two things that seem relatively certain given the
unprecedented monetary stimulus in place are, first, that
when the cost of money is distorted, market dislocations
will eventually emerge, and, second, that volatility will
be higher. Fund flows offer a possibility for dislocation.
Fixed-income mutual funds took in nearly $1 trillion from
2009 to 2012. Should this money flow out again at a rapid
pace, it could have major implications across fixed-income
sectors. We continue to keep a watchful eye out for where
those vulnerabilities might eventually surface, as we also
look for opportunities to capitalize on higher volatility.

After the 2012 Economic Policy Symposium at Jackson
Hole, Wyoming, a paper presented by Columbia University Professor Michael Woodford had a substantial impact
on FOMC thinking. The paper argued that once interestrate policy has reached the zero bound, communication

Figure 2. � xtraordinary policies have held
E
Treasury yields below fair value
Actual 10-year Treasury yield vs. hypothetical fair-value yield
6.0%

When the cost of money
is distorted, market
dislocations will eventually
emerge, and volatility will
be higher.

5.0%

Hypothetical fair-value yield

4.0%

10-year Treasury yield

3.0%
2.0%
1.0%
9/09

9/10

9/11

9/12

9/13

3

Sources: Putnam Global Asset Allocation and Bloomberg.
Fair Value Model represents hypothetical yield of Treasury
calculated by adding the trailing 5-year average real GDP
growth (Source: U.S. Bureau of Economic Analysis), and the
University of Michigan Survey of one-year forward inflation expectations (Source: University of Michigan Survey
Research Center).
Q4 2013 |  Capital Markets Outlook

Asset class views

In Europe, the sharp austerity measures put in place a
few years ago are now less of a drag on growth, and the
economy is consequently emerging from its recession.
Like the United Kingdom, tough economic conditions have
forced Continental European companies to restructure as
never before, bolstering their ability to improve earnings
and operate more efficiently. Stocks in Europe have risen
but are still cheap relative to fixed-income investments and
U.S. stocks, in our opinion, and are also likely to show better
earnings momentum as Europe’s economy recovers.

Equity
U.S. equity U.S. equities continued to advance, but not
without turbulence, particularly in the final week of the
quarter, when investors were distracted by Washington’s
budget debate and the threat of a government shutdown.
Uncertainty about Federal Reserve policy also influenced
equities throughout the quarter, until the S&P 500 Index
surged to a record high following the Fed’s September
announcement that it would postpone tapering for at
least another month.

Japanese equities look reasonably attractive to us when
we consider company valuations and earnings momentum.
As long as the yen remains relatively weak — which it has
done since the rollout of the government’s aggressive
monetary and fiscal stimulus toward the end of 2012 — a
variety of companies in Japan will likely exhibit attractive
business characteristics. Autos and industrials performed
well in the third calendar quarter, and we think there is
room for share-price gains in these areas.

In a trend that we view as positive, cyclical sectors
again outperformed defensive stocks as investors
appeared to shift their focus from safety and yield to
fundamentals and valuation. Equity valuations are generally at the midpoint of their historic ranges, and they are
more equivalent in that price-earnings multiples are in a
tighter range across companies and sectors. In this environment, investment opportunities remain, but they are
less obvious, and fundamental research and bottom-up
stock selection become more critical, in our view.

Emerging markets have been the weakest-performing
equity class for four consecutive years. This year, the
underperformance has been substantial. While we are
generally finding better opportunities in developed
markets, we believe the current broad-based sell-off in
emerging markets, which began roughly in May, does
open the door to certain opportunities. We think spending
in the consumer sectors, including health care, could be
increasingly strong over time. In addition, given China’s
significant pollution and other environmental problems,
we believe spending on pollution remediation and control
could be significant going forward, even if China’s overall
growth continues to disappoint.

In terms of corporate earnings, given the relatively
modest rate of recent U.S. economic growth, it is compelling that businesses have been able to deliver current
levels of profit growth. In another promising development
for equity markets, U.S. businesses have focused on structural improvements to enhance profitability, rather than
rely on revenue growth.
Our outlook has become more balanced and is less
constructive than it had been several quarters ago when
we believed the U.S. equity universe offered many exploitable opportunities. While we would not describe equities
as expensive from a historical perspective, we are seeing
far fewer pockets of anomalous valuations — areas in
which stocks are extraordinarily inexpensive.

Fixed income
U.S. fixed income Interest rates, after spiking higher in
June, remained elevated for most of the third quarter, due
to uncertainty about when the Federal Reserve would
begin scaling back quantitative easing. However, seeing a
more uneven economic climate than it expected, including
a weak September non-farm payroll report along with the
potential for fiscal discord in Washington, the Fed decided
to keep its $85 billion-a-month bond-buying program in
place. Following this surprise mid-September decision,
bonds rallied and interest rates declined.

Non-U.S. equity The global economy is finding new
engines of growth in the developed markets. In the United
Kingdom, we see what we consider to be the proper
balance of fiscal retrenchment and stimulative monetary
policy, which is lending support to key sectors such as
financials. This has contributed to the momentum of the
country’s overall recovery as well as to our conviction in
several “self-help” opportunities, where companies are
pursuing aggressive internal restructuring actions that
should result in meaningfully improved profitability.

4
PUTNAM INVESTM ENTS |  putnam.com

With the Fed’s decision, investors also showed a
renewed appetite for credit risk, and sought to capitalize on the wider yield spreads offered by corporate
securities. Securitized bonds, such as interest-only
collateralized mortgage obligations (IO CMOs), also
performed well. Mortgage credit holdings — most
notably, commercial mortgage-backed securities
(CMBS) — delivered modestly positive performance,
aided by stable-to-rising commercial property values.

MARKET TRENDS
Index name (returns in USD)

EQUITY INDEXES

Q3 13

12 months
ended
9/30/13

Dow Jones Industrial Average

5.24

19.34

Nasdaq

11.01

16.71

MSCI World (ND)

8.18

20.21

MSCI EAFE (ND)

11.56

23.77

MSCI Europe (ND)

13.61

24.23

MSCI Emerging Markets (ND)

5.77

0.98

Tokyo Topix

9.06

31.35

Russell 1000

6.02

20.91

Russell 2000

10.21

30.06

Russell 3000 Growth

8.48

20.30

Russell 3000 Value

4.23

22.67

0.57

-1.68

-0.66

-5.71

Barclays Government Bond

0.12

-1.98

Barclays MBS

1.03

-1.20

Barclays Municipal Bond

-0.19

-2.21

BofA ML 3-Month T-bill

0.02

0.10

CG World Government Bond ex-U.S.

4.06

-5.65

JPMorgan Developed High Yield

2.62

7.71

JPMorgan Global High Yield

2.42

7.08

JPMorgan Emerging Markets
Global Diversified

1.19

-4.06

S&P LSTA Loan

The desire among policymakers and investors alike
is for the financial markets to return to a more normalized environment over the medium term. Consequently,
the Fed would prefer to transition from aggressively
providing liquidity to the markets to letting the markets
function on their own again. As the markets make
this transition, there will continue to be periods of
uncertainty.

15.59%

S&P 500

From a fundamental point of view, we see underlying
strength in the economy and among corporates. For
this reason, we believe we are likely to see rates continue
an upward march. As rates shift to higher levels, it could
entail a pickup in volatility, though we expect that some
stabilization of rates may be achieved by late in the year,
along with tighter credit spreads.

2.12%

1.20

5.00

4.78

-4.14

FIXED INCOME INDEXES

Barclays U.S. Aggregate Bond
Barclays 10-Year Treasury Bellwether

Non-U.S. fixed income The global macroeconomic
environment, though less solid than the United States,
appears to be stabilizing. This is particularly the case in
Europe, which we see emerging from its recession, and
in Japan, which is pursuing an aggressive policy agenda
to weaken the yen and pull the economy out of a multidecade period of deflation. China, too, reported positive
manufacturing data above economists’ expectations
late in the third quarter.
In emerging markets more generally, the Fed’s
tapering discussion caused emerging-market debt to
sell off late in the second quarter of 2013, and outflows
from this sector continued through the third quarter.
As that has happened, other issues have been exposed
that may prove to be obstacles for this asset class.
Those countries that did not use the recent era of global
quantitative easing to improve their fiscal policies now
appear to have relatively poor fundamentals and are
faced with a negative environment for raising additional
capital. However, we do not see at present a repeat
of past emerging-market crises — such as the Asian
currency crisis of 1998.

COMMODITIES

S&P GSCI

It is not possible to invest directly in an index. Past performance is not
indicative of future results.

5
Q4 2013 |  Capital Markets Outlook

Currency

Tax exempt We continue to have a constructive
outlook for municipal bonds, especially as part of a diversified portfolio and for long-term investors seeking tax-free
income. The third quarter proved to be a very volatile time
for municipal bonds, and market conditions remain less
than robust. It is worth noting that while spreads are much
narrower than they were at their peak, we believe the
recent sell-off has created more attractive opportunities in
a dislocated municipal market.

We are taking relatively less risk in active currency strategies, as the Fed’s decision not to taper its stimulative
bond-buying program and the shutdown of the U.S.
government have created an environment with fewer
opportunities, in our view. At this writing, it appears likely
that a last-minute deal on the debt ceiling will keep the
government from a technical default; however, the very
small tail risk of default has quite severe implications for
asset markets. In these conditions we have a neutral view
toward the U.S. dollar.

In our view, technical factors in the market are the
big wild card at this point. Tax-exempt municipal fund
outflows have really put a lot of downward pressure on
prices in the market. Although we have seen some institutional crossover buyers come into the market to help
support prices, we think it is unlikely that we will see volatility subside until outflows and rate volatility diminish. The
overall fundamental credit outlook of municipal bonds
appears solid. With regard to tax policy, while investors
gained certainty on tax rates for 2013, many issues remain
unresolved, including federal budget sequestration, the
debt ceiling, and the potential for broader tax reform — all
of which could affect the value of municipal bonds. As
always, we are monitoring the situation closely and positioning the portfolios accordingly, based on our analysis.

We favor a slight overweight to the euro as cyclical
economic growth is improving and the European Central
Bank (ECB) policy remains accommodative. The Fed’s
decision to maintain asset purchases has given the ECB
time by helping to lower the global term premia, relieving
pressure on European short-term interest rates, and
reducing the need for more dovish rhetoric. At the same
time, we are less negative on the British pound sterling
as U.K. economic growth data remain strong and are
challenging the forward guidance as laid out by the Bank
of England.
Our view on the Japanese yen has become more
neutral. Over the medium term, it is expected that the
Bank of Japan will have to do much more monetary
easing than currently slated, which should provide further
impetus for the dollar to rally versus the yen. We also
believe the yen and Japanese stocks may be more aligned
than was the case earlier this year.

Commodities
Our fourth-quarter outlook for commodities is negative.
We anticipate flat results in energy markets, believing that
the geopolitical tensions that made oil more expensive
before easing in September are fully reflected in current
price levels. Geopolitical risk in the Middle East represented an upside risk for an oil spike last quarter, but it is
now a potential downside risk for oil going forward.

Elsewhere, we now favor a slight overweight to the
Australian dollar and an underweight to the Canadian
dollar. In emerging markets, we favor a relative value
positioning. The surprise by the Fed and the probability
that Janet Yellen will succeed Ben Bernanke as Chairman
increases the chance of much more benign changes to
U.S. monetary policy, but large structural long positions in
local emerging debt markets remain in place, which leaves
some emerging-market currencies more susceptible to
capital outflows, we believe.

For the rest of the commodity complex outside of
energy, our signals are pointing toward a negative quarter.
Momentum has largely been negative, emerging markets
have been weak, and performance of commodity currencies suggests a further downtrend. Where we have
policy-driven investments in commodities, we would
continue to favor energy-heavy indices such as the S&P/
GSCI Index.
One of the more interesting developments for
commodity investors has been the sharp fall in correlation with equities. Commodities historically represented a
great diversifier and alternative investment, but over the
past decade, the correlation with equities has risen. The
correlation weakened considerably over the third quarter
of 2013, and we have no reason to predict that it will jump
back up to higher levels. While the long-term bull market
for commodities has faded, the portfolio construction
case could well be rising again.
6
PUTNAM INVESTM ENTS |  putnam.com

The Barclays Government Bond Index is an unmanaged index of U.S. Treasury and
government agency bonds.
The Barclays Municipal Bond Index is an unmanaged index of long-term fixed-rate
investment-grade tax-exempt bonds.
The Barclays 10-Year U.S. Treasury Bellwether Index is an unmanaged index of U.S.
Treasury bonds with 10 years’ maturity.
The Barclays U.S. Aggregate Bond Index is an unmanaged index used as a general
measure of U.S. fixed-income securities.
The Barclays U.S. Mortgage-Backed Securities (MBS) Index covers agency
mortgage-backed pass-through securities (both fixed-rate and hybrid ARM) issued by
Ginnie Mae (GNMA), Fannie Mae (FNMA), and Freddie Mac (FHLMC).
The BofA Merrill Lynch U.S. 3-Month Treasury Bill Index consists of U.S. Treasury bills
maturing in 90 days.
The Citigroup Non-U.S. World Government Bond Index is an unmanaged index
generally considered to be representative of the world bond market excluding the
United States.
The Dow Jones Industrial Average Index (DJIA) is an unmanaged index composed
of 30 blue-chip stocks whose one binding similarity is their hugeness — each has sales
per year that exceed $7 bil��lion. The DJIA has been price-weighted since its inception
on May 26, 1896, reflects large-cap companies representative of U.S. industry, and
historically has moved in tandem with other major market indexes such as the S&P 500.
The JPMorgan Developed High Yield Index is an unmanaged index of high-yield
fixed-income securities issued in developed countries.
The JPMorgan Emerging Markets Global Diversified Index is composed of U.S.
dollar-denominated Brady bonds, eurobonds, traded loans, and local market debt
instruments issued by sovereign and quasi-sovereign entities.
JP Morgan Global High Yield Index is an unmanaged index of global high-yield
fixed-income securities.
The MSCI EAFE Index is an unmanaged list of equity securities from Europe and
Australasia, with all values expressed in U.S. dollars.
The MSCI Emerging Markets Index is a free-float-adjusted market-capitalizationweighted index that is designed to measure equity market performance in the global
emerging markets.
The MSCI Europe Index is an unmanaged list of equity securities originating in any of 15
European countries, with all values expressed in U.S. dollars.
The MSCI World Index is an unmanaged list of securities from developed and emerging
markets, with all values expressed in U.S. dollars.
The Nasdaq Composite Index is a widely recognized, market-capitalization-weighted
index that is designed to represent the performance of Nasdaq securities and includes
over 3,000 stocks.
The Russell 1000 Index is an unmanaged index of the 1,000 largest U.S. companies.
The Russell 2000 Index is an unmanaged list of common stocks that is frequently used
as a general performance measure of U.S. stocks of small and/or midsize companies.
Russell 3000 Growth Index is an unmanaged index of those companies in the broadmarket Russell 3000 Index chosen for their growth orientation.
Russell 3000 Value Index is an unmanaged index of those companies in the broadmarket Russell 3000 Index chosen for their value orientation.
The S&P GSCI is a composite index of commodity sector returns that represents a
broadly diversified, unleveraged, long-only position in commodity futures.
The S&P/LSTA Leveraged Loan Index (LLI) is an unmanaged index of U.S. leveraged
loans.
The S&P 500 Index is an unmanaged list of common stocks that is frequently used as a
general measure of U.S. stock market performance.
The Tokyo Stock Exchange Index (TOPIX) is a market-capitalization-weighted index of
over 1,100 stocks traded in the Japanese market.
You cannot invest directly in an index.

7
NOTES
This material is provided for limited purposes. It is not intended as an offer or solicitation for the purchase or sale of any financial instrument,
or any Putnam product or strategy. References to specific asset classes and financial markets are for illustrative purposes only and are not
intended to be, and should not be interpreted as, recommendations or investment advice. The opinions expressed in this article represent
the current, good-faith views of the author(s) at the time of publication. The views are provided for informational purposes only and
are subject to change. This material does not take into account any investor’s particular investment objectives, strategies, tax status or
investment horizon. Investors should consult a financial advisor for advice suited to their individual financial needs. Putnam Investments
cannot guarantee the accuracy or completeness of any statements or data contained in the article. Predictions, opinions and other
information contained in this article are subject to change. Any forward-looking statements speak only as of the date they are made, and
Putnam assumes no duty to update them. Forward-looking statements are subject to numerous assumptions, risks and uncertainties.
Actual results could differ materially from those anticipated. Past performance is not a guarantee of future results. As with any investment,
there is a potential for profit as well as the possibility of loss.
This presentation or any portion hereof may not be reprinted, sold, or redistributed in whole or in part without the express written consent
of Putnam Investments. The information provided relates to Putnam Investments and its affiliates, which include The Putnam Advisory
Company, LLC and Putnam Investments Limited®.
Prepared for use in Canada by Putnam Investments Inc. [Investissements Putnam Inc.] (o/a Putnam Management in Manitoba). Where
permitted, advisory services are provided in Canada by Putnam Investments Inc. [Investissements Putnam Inc.] (o/a Putnam Management
in Manitoba) and its affiliate, The Putnam Advisory Company, LLC.
Diversification does not assure a profit or protect against loss. It is possible to lose money in a diversified portfolio.

Consider these risks before investing: International investing involves certain risks, such as currency fluctuations,
economic instability, and political developments. Investments in small and/or midsize companies increase the risk of
greater price fluctuations. Bond investments are subject to interest-rate risk, which means the prices of the fund’s bond
investments are likely to fall if interest rates rise. Bond investments also are subject to credit risk, which is the risk that the
issuer of the bond may default on payment of interest or principal. Interest-rate risk is generally greater for longer-term
bonds, and credit risk is generally greater for below-investment-grade bonds, which may be considered speculative.
Unlike bonds, funds that invest in bonds have ongoing fees and expenses. Lower-rated bonds may offer higher yields in
return for more risk. Funds that invest in government securities are not guaranteed. Mortgage-backed securities are subject
to prepayment risk. Commodities involve the risks of changes in market, political, regulatory, and natural conditions.

Scan code or visit putnam.com/outlook
for more insight on the global
investment landscape.

Visit putnam.com for news and information,
and our Perspectives blog for in-depth
analysis on a range of investment topics.

If you are a U.S. retail investor, please request a prospectus, or a summary prospectus if available, from your financial
representative or by calling Putnam at 1-800-225-1581. The prospectus includes investment objectives, risks, fees,
expenses, and other information that you should read and consider carefully before investing.
In the United States, mutual funds are distributed by Putnam Retail Management.

putnam.com� CM0100 283556 10/13

Más contenido relacionado

La actualidad más candente

Taking a long view
Taking a long viewTaking a long view
Taking a long viewWesley Fogel
 
Finlight Research - Market Perspectives - Nov 2015
Finlight Research - Market Perspectives - Nov 2015Finlight Research - Market Perspectives - Nov 2015
Finlight Research - Market Perspectives - Nov 2015FinLight Research
 
Putnam Fixed Income Outlook Q4 2013
Putnam Fixed Income Outlook Q4 2013Putnam Fixed Income Outlook Q4 2013
Putnam Fixed Income Outlook Q4 2013Putnam Investments
 
Putnam Perspective: Fixed Income Outlook Q2 2014
Putnam Perspective: Fixed Income Outlook Q2 2014Putnam Perspective: Fixed Income Outlook Q2 2014
Putnam Perspective: Fixed Income Outlook Q2 2014Putnam Investments
 
Pictet Asset Management Perspectives
Pictet Asset Management PerspectivesPictet Asset Management Perspectives
Pictet Asset Management PerspectivesForward Management
 
Winter insights q4 2013
Winter insights q4 2013Winter insights q4 2013
Winter insights q4 2013telemuscapital
 
Capital Market Outlook
Capital Market OutlookCapital Market Outlook
Capital Market Outlookeru1659
 
Finlight Research - Market perspectives - Feb 2015
Finlight Research - Market perspectives - Feb 2015Finlight Research - Market perspectives - Feb 2015
Finlight Research - Market perspectives - Feb 2015Zouheir Ben Tamarout
 
Fritzmeyersamplepresentation 110217102619-phpapp01
Fritzmeyersamplepresentation 110217102619-phpapp01Fritzmeyersamplepresentation 110217102619-phpapp01
Fritzmeyersamplepresentation 110217102619-phpapp01Rod Tyler
 
Fritz Meyer Sample Presentation
Fritz Meyer Sample PresentationFritz Meyer Sample Presentation
Fritz Meyer Sample PresentationAdvisors4Advisors
 
2 william blair global market outlook - december 2013
2 william blair global market outlook - december 20132 william blair global market outlook - december 2013
2 william blair global market outlook - december 2013123jumpad
 
BlackRock: 2014 Outlook The List - What to Know, What to Do
BlackRock: 2014 Outlook The List - What to Know, What to DoBlackRock: 2014 Outlook The List - What to Know, What to Do
BlackRock: 2014 Outlook The List - What to Know, What to DoEcon Matters
 
Finlight Research - Market Perspectives - Jun 2015
Finlight Research - Market Perspectives - Jun 2015Finlight Research - Market Perspectives - Jun 2015
Finlight Research - Market Perspectives - Jun 2015FinLight Research
 
The Fed's Asset Purchases
The Fed's Asset PurchasesThe Fed's Asset Purchases
The Fed's Asset PurchasesJeff Green
 
Finlight Research - Market Perspectives - Aug 2014
Finlight Research - Market Perspectives - Aug 2014Finlight Research - Market Perspectives - Aug 2014
Finlight Research - Market Perspectives - Aug 2014Zouheir Ben Tamarout
 
2017 Global Investment Outlook
2017 Global Investment Outlook2017 Global Investment Outlook
2017 Global Investment OutlookJay Pelosky
 
Finlight Research - Market Perspectives - Jul 2015
Finlight Research - Market Perspectives - Jul 2015Finlight Research - Market Perspectives - Jul 2015
Finlight Research - Market Perspectives - Jul 2015FinLight Research
 

La actualidad más candente (20)

Taking a long view
Taking a long viewTaking a long view
Taking a long view
 
Finlight Research - Market Perspectives - Nov 2015
Finlight Research - Market Perspectives - Nov 2015Finlight Research - Market Perspectives - Nov 2015
Finlight Research - Market Perspectives - Nov 2015
 
Putnam Fixed Income Outlook Q4 2013
Putnam Fixed Income Outlook Q4 2013Putnam Fixed Income Outlook Q4 2013
Putnam Fixed Income Outlook Q4 2013
 
Putnam Perspective: Fixed Income Outlook Q2 2014
Putnam Perspective: Fixed Income Outlook Q2 2014Putnam Perspective: Fixed Income Outlook Q2 2014
Putnam Perspective: Fixed Income Outlook Q2 2014
 
Pictet Asset Management Perspectives
Pictet Asset Management PerspectivesPictet Asset Management Perspectives
Pictet Asset Management Perspectives
 
Winter insights q4 2013
Winter insights q4 2013Winter insights q4 2013
Winter insights q4 2013
 
2013 Mid Year Outlook
2013 Mid Year Outlook2013 Mid Year Outlook
2013 Mid Year Outlook
 
Capital Market Outlook
Capital Market OutlookCapital Market Outlook
Capital Market Outlook
 
Finlight Research - Market perspectives - Feb 2015
Finlight Research - Market perspectives - Feb 2015Finlight Research - Market perspectives - Feb 2015
Finlight Research - Market perspectives - Feb 2015
 
Fritzmeyersamplepresentation 110217102619-phpapp01
Fritzmeyersamplepresentation 110217102619-phpapp01Fritzmeyersamplepresentation 110217102619-phpapp01
Fritzmeyersamplepresentation 110217102619-phpapp01
 
Fritz Meyer Sample Presentation
Fritz Meyer Sample PresentationFritz Meyer Sample Presentation
Fritz Meyer Sample Presentation
 
2 william blair global market outlook - december 2013
2 william blair global market outlook - december 20132 william blair global market outlook - december 2013
2 william blair global market outlook - december 2013
 
BlackRock: 2014 Outlook The List - What to Know, What to Do
BlackRock: 2014 Outlook The List - What to Know, What to DoBlackRock: 2014 Outlook The List - What to Know, What to Do
BlackRock: 2014 Outlook The List - What to Know, What to Do
 
Fear in the Market
Fear in the MarketFear in the Market
Fear in the Market
 
Finlight Research - Market Perspectives - Jun 2015
Finlight Research - Market Perspectives - Jun 2015Finlight Research - Market Perspectives - Jun 2015
Finlight Research - Market Perspectives - Jun 2015
 
The Fed's Asset Purchases
The Fed's Asset PurchasesThe Fed's Asset Purchases
The Fed's Asset Purchases
 
3rd Quarter 2015
3rd Quarter 20153rd Quarter 2015
3rd Quarter 2015
 
Finlight Research - Market Perspectives - Aug 2014
Finlight Research - Market Perspectives - Aug 2014Finlight Research - Market Perspectives - Aug 2014
Finlight Research - Market Perspectives - Aug 2014
 
2017 Global Investment Outlook
2017 Global Investment Outlook2017 Global Investment Outlook
2017 Global Investment Outlook
 
Finlight Research - Market Perspectives - Jul 2015
Finlight Research - Market Perspectives - Jul 2015Finlight Research - Market Perspectives - Jul 2015
Finlight Research - Market Perspectives - Jul 2015
 

Destacado

Linked In Presentation
Linked In PresentationLinked In Presentation
Linked In PresentationSarah Ables
 
Putnam Income Fund Q&A Q2 2013
Putnam Income Fund Q&A Q2 2013Putnam Income Fund Q&A Q2 2013
Putnam Income Fund Q&A Q2 2013Putnam Investments
 
SMX London 09 - Search Marketing Trends - Merinda Peppard
SMX London 09 - Search Marketing Trends -  Merinda PeppardSMX London 09 - Search Marketing Trends -  Merinda Peppard
SMX London 09 - Search Marketing Trends - Merinda PeppardMerindaPeppard
 
VERGO Marketing Brochure
VERGO Marketing BrochureVERGO Marketing Brochure
VERGO Marketing BrochureVERGOMarketing
 
NATO Social Forum: Social Media use for Goverments
NATO Social Forum: Social Media use for GovermentsNATO Social Forum: Social Media use for Goverments
NATO Social Forum: Social Media use for GovermentsMerindaPeppard
 
Efficient Frontier What\'s Around The Corner Search Trends2
Efficient Frontier What\'s Around The Corner Search Trends2Efficient Frontier What\'s Around The Corner Search Trends2
Efficient Frontier What\'s Around The Corner Search Trends2MerindaPeppard
 
How Social Media is Transforming Higher Education_ UCAS workshop 2014
How Social Media is Transforming Higher Education_ UCAS workshop 2014How Social Media is Transforming Higher Education_ UCAS workshop 2014
How Social Media is Transforming Higher Education_ UCAS workshop 2014MerindaPeppard
 

Destacado (8)

Linked In Presentation
Linked In PresentationLinked In Presentation
Linked In Presentation
 
Putnam Income Fund Q&A Q2 2013
Putnam Income Fund Q&A Q2 2013Putnam Income Fund Q&A Q2 2013
Putnam Income Fund Q&A Q2 2013
 
SMX London 09 - Search Marketing Trends - Merinda Peppard
SMX London 09 - Search Marketing Trends -  Merinda PeppardSMX London 09 - Search Marketing Trends -  Merinda Peppard
SMX London 09 - Search Marketing Trends - Merinda Peppard
 
VERGO Marketing Brochure
VERGO Marketing BrochureVERGO Marketing Brochure
VERGO Marketing Brochure
 
NATO Social Forum: Social Media use for Goverments
NATO Social Forum: Social Media use for GovermentsNATO Social Forum: Social Media use for Goverments
NATO Social Forum: Social Media use for Goverments
 
Efficient Frontier What\'s Around The Corner Search Trends2
Efficient Frontier What\'s Around The Corner Search Trends2Efficient Frontier What\'s Around The Corner Search Trends2
Efficient Frontier What\'s Around The Corner Search Trends2
 
How Social Media is Transforming Higher Education_ UCAS workshop 2014
How Social Media is Transforming Higher Education_ UCAS workshop 2014How Social Media is Transforming Higher Education_ UCAS workshop 2014
How Social Media is Transforming Higher Education_ UCAS workshop 2014
 
Presentation
PresentationPresentation
Presentation
 

Similar a Putnam Capital Markets Outlook Q4 2013

4Q2014-In-a-Bond-Bind
4Q2014-In-a-Bond-Bind4Q2014-In-a-Bond-Bind
4Q2014-In-a-Bond-BindRon New
 
Market Perspectives - June 2019
Market Perspectives - June 2019Market Perspectives - June 2019
Market Perspectives - June 2019Mark Biegel
 
2012 global credit outlook sovereign debt problems weigh on a mostly tepid fo...
2012 global credit outlook sovereign debt problems weigh on a mostly tepid fo...2012 global credit outlook sovereign debt problems weigh on a mostly tepid fo...
2012 global credit outlook sovereign debt problems weigh on a mostly tepid fo...Pim Piepers
 
Putnam Perspectives: Capital Markets Outlook Q3 2014
Putnam Perspectives: Capital Markets Outlook Q3 2014Putnam Perspectives: Capital Markets Outlook Q3 2014
Putnam Perspectives: Capital Markets Outlook Q3 2014Putnam Investments
 
Current Thinking, Q1 2014
Current Thinking, Q1 2014Current Thinking, Q1 2014
Current Thinking, Q1 2014Kevin Lenox
 
clear channel swap
clear channel swapclear channel swap
clear channel swapDylan Bateh
 
2017 Investment Outlook & Issues_FINAL_booklet format
2017 Investment Outlook & Issues_FINAL_booklet format2017 Investment Outlook & Issues_FINAL_booklet format
2017 Investment Outlook & Issues_FINAL_booklet formatJuliane Morris, MBA, CWS
 
What recent and past actions have Canada and the US taken to counter.pdf
What recent and past actions have Canada and the US taken to counter.pdfWhat recent and past actions have Canada and the US taken to counter.pdf
What recent and past actions have Canada and the US taken to counter.pdfmeejuhaszjasmynspe52
 
Putnam Fixed Income Outlook Q1 2013
Putnam Fixed Income Outlook Q1 2013Putnam Fixed Income Outlook Q1 2013
Putnam Fixed Income Outlook Q1 2013Putnam Investments
 
Putnam Perspectives: Fixed-Income Outlook Q3 2014
Putnam Perspectives: Fixed-Income Outlook Q3 2014Putnam Perspectives: Fixed-Income Outlook Q3 2014
Putnam Perspectives: Fixed-Income Outlook Q3 2014Putnam Investments
 
Market Perspectives - December 2016
Market Perspectives - December 2016Market Perspectives - December 2016
Market Perspectives - December 2016Mark Biegel
 
Econ 435 Paper
Econ 435 PaperEcon 435 Paper
Econ 435 PaperSean Ling
 
Monetary policy and Main Street
Monetary policy and Main StreetMonetary policy and Main Street
Monetary policy and Main StreetA.W. Berry
 
Deloitte Report "Global Powers of Retail 2014"
Deloitte Report "Global Powers of Retail 2014"Deloitte Report "Global Powers of Retail 2014"
Deloitte Report "Global Powers of Retail 2014"Oliver Grave
 
pl_najwieksze_sieci_handlowe_Global_Powers_of_ _Retailing_2014
pl_najwieksze_sieci_handlowe_Global_Powers_of_ _Retailing_2014pl_najwieksze_sieci_handlowe_Global_Powers_of_ _Retailing_2014
pl_najwieksze_sieci_handlowe_Global_Powers_of_ _Retailing_2014Blossom Out
 

Similar a Putnam Capital Markets Outlook Q4 2013 (20)

Putnam Outlook Q3 2013
Putnam Outlook Q3 2013Putnam Outlook Q3 2013
Putnam Outlook Q3 2013
 
TAP QuarterlyLetter 201603
TAP QuarterlyLetter 201603TAP QuarterlyLetter 201603
TAP QuarterlyLetter 201603
 
4Q2014-In-a-Bond-Bind
4Q2014-In-a-Bond-Bind4Q2014-In-a-Bond-Bind
4Q2014-In-a-Bond-Bind
 
Market Perspectives - June 2019
Market Perspectives - June 2019Market Perspectives - June 2019
Market Perspectives - June 2019
 
2012 global credit outlook sovereign debt problems weigh on a mostly tepid fo...
2012 global credit outlook sovereign debt problems weigh on a mostly tepid fo...2012 global credit outlook sovereign debt problems weigh on a mostly tepid fo...
2012 global credit outlook sovereign debt problems weigh on a mostly tepid fo...
 
Economic Outlook | LIC Preneed Forum 2012
Economic Outlook  | LIC Preneed Forum 2012Economic Outlook  | LIC Preneed Forum 2012
Economic Outlook | LIC Preneed Forum 2012
 
Putnam Perspectives: Capital Markets Outlook Q3 2014
Putnam Perspectives: Capital Markets Outlook Q3 2014Putnam Perspectives: Capital Markets Outlook Q3 2014
Putnam Perspectives: Capital Markets Outlook Q3 2014
 
Current Thinking, Q1 2014
Current Thinking, Q1 2014Current Thinking, Q1 2014
Current Thinking, Q1 2014
 
clear channel swap
clear channel swapclear channel swap
clear channel swap
 
2017 Investment Outlook & Issues_FINAL_booklet format
2017 Investment Outlook & Issues_FINAL_booklet format2017 Investment Outlook & Issues_FINAL_booklet format
2017 Investment Outlook & Issues_FINAL_booklet format
 
What recent and past actions have Canada and the US taken to counter.pdf
What recent and past actions have Canada and the US taken to counter.pdfWhat recent and past actions have Canada and the US taken to counter.pdf
What recent and past actions have Canada and the US taken to counter.pdf
 
Putnam Fixed Income Outlook Q1 2013
Putnam Fixed Income Outlook Q1 2013Putnam Fixed Income Outlook Q1 2013
Putnam Fixed Income Outlook Q1 2013
 
Putnam Perspectives: Fixed-Income Outlook Q3 2014
Putnam Perspectives: Fixed-Income Outlook Q3 2014Putnam Perspectives: Fixed-Income Outlook Q3 2014
Putnam Perspectives: Fixed-Income Outlook Q3 2014
 
Market Perspectives - December 2016
Market Perspectives - December 2016Market Perspectives - December 2016
Market Perspectives - December 2016
 
Econ 435 Paper
Econ 435 PaperEcon 435 Paper
Econ 435 Paper
 
Monetary policy and Main Street
Monetary policy and Main StreetMonetary policy and Main Street
Monetary policy and Main Street
 
June
JuneJune
June
 
Deloitte Report "Global Powers of Retail 2014"
Deloitte Report "Global Powers of Retail 2014"Deloitte Report "Global Powers of Retail 2014"
Deloitte Report "Global Powers of Retail 2014"
 
pl_najwieksze_sieci_handlowe_Global_Powers_of_ _Retailing_2014
pl_najwieksze_sieci_handlowe_Global_Powers_of_ _Retailing_2014pl_najwieksze_sieci_handlowe_Global_Powers_of_ _Retailing_2014
pl_najwieksze_sieci_handlowe_Global_Powers_of_ _Retailing_2014
 
FNB
FNBFNB
FNB
 

Más de Putnam Investments

Putnam Investment's 2015 Financial Advisors and Social Media Survey
Putnam Investment's 2015 Financial Advisors and Social Media SurveyPutnam Investment's 2015 Financial Advisors and Social Media Survey
Putnam Investment's 2015 Financial Advisors and Social Media SurveyPutnam Investments
 
Putnam Social Media Survey 2014
Putnam Social Media Survey 2014Putnam Social Media Survey 2014
Putnam Social Media Survey 2014Putnam Investments
 
Putnam Perspectives: Equity Outlook Q3 2014
Putnam Perspectives: Equity Outlook Q3 2014Putnam Perspectives: Equity Outlook Q3 2014
Putnam Perspectives: Equity Outlook Q3 2014Putnam Investments
 
Putnam Perspectives: Fixed Income Outlook Q1 2014
Putnam Perspectives: Fixed Income Outlook Q1 2014Putnam Perspectives: Fixed Income Outlook Q1 2014
Putnam Perspectives: Fixed Income Outlook Q1 2014Putnam Investments
 
Putnam Lifetime Income Survey 2013
Putnam Lifetime Income Survey 2013Putnam Lifetime Income Survey 2013
Putnam Lifetime Income Survey 2013Putnam Investments
 
Putnam Fixed Income Outlook q313
Putnam Fixed Income Outlook q313Putnam Fixed Income Outlook q313
Putnam Fixed Income Outlook q313Putnam Investments
 
Fostering innovation to improve retirement security
Fostering innovation to improve retirement securityFostering innovation to improve retirement security
Fostering innovation to improve retirement securityPutnam Investments
 
Putnam municipal bond funds Q&A Q2 2013
Putnam municipal bond funds Q&A Q2 2013Putnam municipal bond funds Q&A Q2 2013
Putnam municipal bond funds Q&A Q2 2013Putnam Investments
 
Putnam Global Income Trust Q&A Q2 2013
Putnam Global Income Trust Q&A Q2 2013Putnam Global Income Trust Q&A Q2 2013
Putnam Global Income Trust Q&A Q2 2013Putnam Investments
 
Putnam Equity Income Fund Q&A Q2 2013
Putnam Equity Income Fund Q&A Q2 2013Putnam Equity Income Fund Q&A Q2 2013
Putnam Equity Income Fund Q&A Q2 2013Putnam Investments
 
Putnam Dynamic Risk Allocation Fund Q&A Q2 2013
Putnam Dynamic Risk Allocation Fund Q&A Q2 2013Putnam Dynamic Risk Allocation Fund Q&A Q2 2013
Putnam Dynamic Risk Allocation Fund Q&A Q2 2013Putnam Investments
 
Putnam Absolute Return Funds Q&A Q2 2013
Putnam Absolute Return Funds Q&A Q2 2013Putnam Absolute Return Funds Q&A Q2 2013
Putnam Absolute Return Funds Q&A Q2 2013Putnam Investments
 
Robert L. Reynolds: New thinking, new solutions
Robert L. Reynolds: New thinking, new solutionsRobert L. Reynolds: New thinking, new solutions
Robert L. Reynolds: New thinking, new solutionsPutnam Investments
 
Putnam Lifetime Income Scores III
Putnam Lifetime Income Scores IIIPutnam Lifetime Income Scores III
Putnam Lifetime Income Scores IIIPutnam Investments
 
Taxes after the fiscal cliff: Planning opportunities in 2013
Taxes after the fiscal cliff: Planning opportunities in 2013Taxes after the fiscal cliff: Planning opportunities in 2013
Taxes after the fiscal cliff: Planning opportunities in 2013Putnam Investments
 
Putnam Investments: You can take it with you
Putnam Investments: You can take it with youPutnam Investments: You can take it with you
Putnam Investments: You can take it with youPutnam Investments
 

Más de Putnam Investments (20)

The Parquet by the numbers
The Parquet by the numbersThe Parquet by the numbers
The Parquet by the numbers
 
Putnam Investment's 2015 Financial Advisors and Social Media Survey
Putnam Investment's 2015 Financial Advisors and Social Media SurveyPutnam Investment's 2015 Financial Advisors and Social Media Survey
Putnam Investment's 2015 Financial Advisors and Social Media Survey
 
Putnam Social Media Survey 2014
Putnam Social Media Survey 2014Putnam Social Media Survey 2014
Putnam Social Media Survey 2014
 
Putnam Perspectives: Equity Outlook Q3 2014
Putnam Perspectives: Equity Outlook Q3 2014Putnam Perspectives: Equity Outlook Q3 2014
Putnam Perspectives: Equity Outlook Q3 2014
 
Putnam Perspectives: Fixed Income Outlook Q1 2014
Putnam Perspectives: Fixed Income Outlook Q1 2014Putnam Perspectives: Fixed Income Outlook Q1 2014
Putnam Perspectives: Fixed Income Outlook Q1 2014
 
Who is the social advisor?
Who is the social advisor?Who is the social advisor?
Who is the social advisor?
 
Putnam Lifetime Income Survey 2013
Putnam Lifetime Income Survey 2013Putnam Lifetime Income Survey 2013
Putnam Lifetime Income Survey 2013
 
Putnam Social Media Survey
Putnam Social Media SurveyPutnam Social Media Survey
Putnam Social Media Survey
 
Putnam Fixed Income Outlook q313
Putnam Fixed Income Outlook q313Putnam Fixed Income Outlook q313
Putnam Fixed Income Outlook q313
 
Fostering innovation to improve retirement security
Fostering innovation to improve retirement securityFostering innovation to improve retirement security
Fostering innovation to improve retirement security
 
Putnam municipal bond funds Q&A Q2 2013
Putnam municipal bond funds Q&A Q2 2013Putnam municipal bond funds Q&A Q2 2013
Putnam municipal bond funds Q&A Q2 2013
 
Putnam Global Income Trust Q&A Q2 2013
Putnam Global Income Trust Q&A Q2 2013Putnam Global Income Trust Q&A Q2 2013
Putnam Global Income Trust Q&A Q2 2013
 
Putnam Equity Income Fund Q&A Q2 2013
Putnam Equity Income Fund Q&A Q2 2013Putnam Equity Income Fund Q&A Q2 2013
Putnam Equity Income Fund Q&A Q2 2013
 
Putnam Dynamic Risk Allocation Fund Q&A Q2 2013
Putnam Dynamic Risk Allocation Fund Q&A Q2 2013Putnam Dynamic Risk Allocation Fund Q&A Q2 2013
Putnam Dynamic Risk Allocation Fund Q&A Q2 2013
 
Putnam Absolute Return Funds Q&A Q2 2013
Putnam Absolute Return Funds Q&A Q2 2013Putnam Absolute Return Funds Q&A Q2 2013
Putnam Absolute Return Funds Q&A Q2 2013
 
Robert L. Reynolds: New thinking, new solutions
Robert L. Reynolds: New thinking, new solutionsRobert L. Reynolds: New thinking, new solutions
Robert L. Reynolds: New thinking, new solutions
 
Putnam Lifetime Income Scores III
Putnam Lifetime Income Scores IIIPutnam Lifetime Income Scores III
Putnam Lifetime Income Scores III
 
New Thinking, New Solutions
New Thinking, New Solutions New Thinking, New Solutions
New Thinking, New Solutions
 
Taxes after the fiscal cliff: Planning opportunities in 2013
Taxes after the fiscal cliff: Planning opportunities in 2013Taxes after the fiscal cliff: Planning opportunities in 2013
Taxes after the fiscal cliff: Planning opportunities in 2013
 
Putnam Investments: You can take it with you
Putnam Investments: You can take it with youPutnam Investments: You can take it with you
Putnam Investments: You can take it with you
 

Último

VIP Independent Call Girls in Mumbai 🌹 9920725232 ( Call Me ) Mumbai Escorts ...
VIP Independent Call Girls in Mumbai 🌹 9920725232 ( Call Me ) Mumbai Escorts ...VIP Independent Call Girls in Mumbai 🌹 9920725232 ( Call Me ) Mumbai Escorts ...
VIP Independent Call Girls in Mumbai 🌹 9920725232 ( Call Me ) Mumbai Escorts ...dipikadinghjn ( Why You Choose Us? ) Escorts
 
Stock Market Brief Deck (Under Pressure).pdf
Stock Market Brief Deck (Under Pressure).pdfStock Market Brief Deck (Under Pressure).pdf
Stock Market Brief Deck (Under Pressure).pdfMichael Silva
 
Gurley shaw Theory of Monetary Economics.
Gurley shaw Theory of Monetary Economics.Gurley shaw Theory of Monetary Economics.
Gurley shaw Theory of Monetary Economics.Vinodha Devi
 
Shrambal_Distributors_Newsletter_Apr-2024 (1).pdf
Shrambal_Distributors_Newsletter_Apr-2024 (1).pdfShrambal_Distributors_Newsletter_Apr-2024 (1).pdf
Shrambal_Distributors_Newsletter_Apr-2024 (1).pdfvikashdidwania1
 
Mira Road Memorable Call Grls Number-9833754194-Bhayandar Speciallty Call Gir...
Mira Road Memorable Call Grls Number-9833754194-Bhayandar Speciallty Call Gir...Mira Road Memorable Call Grls Number-9833754194-Bhayandar Speciallty Call Gir...
Mira Road Memorable Call Grls Number-9833754194-Bhayandar Speciallty Call Gir...priyasharma62062
 
VIP Call Girl Service Andheri West ⚡ 9920725232 What It Takes To Be The Best ...
VIP Call Girl Service Andheri West ⚡ 9920725232 What It Takes To Be The Best ...VIP Call Girl Service Andheri West ⚡ 9920725232 What It Takes To Be The Best ...
VIP Call Girl Service Andheri West ⚡ 9920725232 What It Takes To Be The Best ...dipikadinghjn ( Why You Choose Us? ) Escorts
 
The Economic History of the U.S. Lecture 17.pdf
The Economic History of the U.S. Lecture 17.pdfThe Economic History of the U.S. Lecture 17.pdf
The Economic History of the U.S. Lecture 17.pdfGale Pooley
 
06_Joeri Van Speybroek_Dell_MeetupDora&Cybersecurity.pdf
06_Joeri Van Speybroek_Dell_MeetupDora&Cybersecurity.pdf06_Joeri Van Speybroek_Dell_MeetupDora&Cybersecurity.pdf
06_Joeri Van Speybroek_Dell_MeetupDora&Cybersecurity.pdfFinTech Belgium
 
Booking open Available Pune Call Girls Talegaon Dabhade 6297143586 Call Hot ...
Booking open Available Pune Call Girls Talegaon Dabhade  6297143586 Call Hot ...Booking open Available Pune Call Girls Talegaon Dabhade  6297143586 Call Hot ...
Booking open Available Pune Call Girls Talegaon Dabhade 6297143586 Call Hot ...Call Girls in Nagpur High Profile
 
VIP Call Girl in Mira Road 💧 9920725232 ( Call Me ) Get A New Crush Everyday ...
VIP Call Girl in Mira Road 💧 9920725232 ( Call Me ) Get A New Crush Everyday ...VIP Call Girl in Mira Road 💧 9920725232 ( Call Me ) Get A New Crush Everyday ...
VIP Call Girl in Mira Road 💧 9920725232 ( Call Me ) Get A New Crush Everyday ...dipikadinghjn ( Why You Choose Us? ) Escorts
 
Solution Manual for Financial Accounting, 11th Edition by Robert Libby, Patri...
Solution Manual for Financial Accounting, 11th Edition by Robert Libby, Patri...Solution Manual for Financial Accounting, 11th Edition by Robert Libby, Patri...
Solution Manual for Financial Accounting, 11th Edition by Robert Libby, Patri...ssifa0344
 
VVIP Pune Call Girls Katraj (7001035870) Pune Escorts Nearby with Complete Sa...
VVIP Pune Call Girls Katraj (7001035870) Pune Escorts Nearby with Complete Sa...VVIP Pune Call Girls Katraj (7001035870) Pune Escorts Nearby with Complete Sa...
VVIP Pune Call Girls Katraj (7001035870) Pune Escorts Nearby with Complete Sa...Call Girls in Nagpur High Profile
 
( Jasmin ) Top VIP Escorts Service Dindigul 💧 7737669865 💧 by Dindigul Call G...
( Jasmin ) Top VIP Escorts Service Dindigul 💧 7737669865 💧 by Dindigul Call G...( Jasmin ) Top VIP Escorts Service Dindigul 💧 7737669865 💧 by Dindigul Call G...
( Jasmin ) Top VIP Escorts Service Dindigul 💧 7737669865 💧 by Dindigul Call G...dipikadinghjn ( Why You Choose Us? ) Escorts
 
Indore Real Estate Market Trends Report.pdf
Indore Real Estate Market Trends Report.pdfIndore Real Estate Market Trends Report.pdf
Indore Real Estate Market Trends Report.pdfSaviRakhecha1
 
The Economic History of the U.S. Lecture 21.pdf
The Economic History of the U.S. Lecture 21.pdfThe Economic History of the U.S. Lecture 21.pdf
The Economic History of the U.S. Lecture 21.pdfGale Pooley
 
VIP Call Girl in Mumbai 💧 9920725232 ( Call Me ) Get A New Crush Everyday Wit...
VIP Call Girl in Mumbai 💧 9920725232 ( Call Me ) Get A New Crush Everyday Wit...VIP Call Girl in Mumbai 💧 9920725232 ( Call Me ) Get A New Crush Everyday Wit...
VIP Call Girl in Mumbai 💧 9920725232 ( Call Me ) Get A New Crush Everyday Wit...dipikadinghjn ( Why You Choose Us? ) Escorts
 
Mira Road Awesome 100% Independent Call Girls NUmber-9833754194-Dahisar Inter...
Mira Road Awesome 100% Independent Call Girls NUmber-9833754194-Dahisar Inter...Mira Road Awesome 100% Independent Call Girls NUmber-9833754194-Dahisar Inter...
Mira Road Awesome 100% Independent Call Girls NUmber-9833754194-Dahisar Inter...priyasharma62062
 
The Economic History of the U.S. Lecture 22.pdf
The Economic History of the U.S. Lecture 22.pdfThe Economic History of the U.S. Lecture 22.pdf
The Economic History of the U.S. Lecture 22.pdfGale Pooley
 

Último (20)

VIP Independent Call Girls in Mumbai 🌹 9920725232 ( Call Me ) Mumbai Escorts ...
VIP Independent Call Girls in Mumbai 🌹 9920725232 ( Call Me ) Mumbai Escorts ...VIP Independent Call Girls in Mumbai 🌹 9920725232 ( Call Me ) Mumbai Escorts ...
VIP Independent Call Girls in Mumbai 🌹 9920725232 ( Call Me ) Mumbai Escorts ...
 
Stock Market Brief Deck (Under Pressure).pdf
Stock Market Brief Deck (Under Pressure).pdfStock Market Brief Deck (Under Pressure).pdf
Stock Market Brief Deck (Under Pressure).pdf
 
Gurley shaw Theory of Monetary Economics.
Gurley shaw Theory of Monetary Economics.Gurley shaw Theory of Monetary Economics.
Gurley shaw Theory of Monetary Economics.
 
Shrambal_Distributors_Newsletter_Apr-2024 (1).pdf
Shrambal_Distributors_Newsletter_Apr-2024 (1).pdfShrambal_Distributors_Newsletter_Apr-2024 (1).pdf
Shrambal_Distributors_Newsletter_Apr-2024 (1).pdf
 
Call Girls in New Ashok Nagar, (delhi) call me [9953056974] escort service 24X7
Call Girls in New Ashok Nagar, (delhi) call me [9953056974] escort service 24X7Call Girls in New Ashok Nagar, (delhi) call me [9953056974] escort service 24X7
Call Girls in New Ashok Nagar, (delhi) call me [9953056974] escort service 24X7
 
Mira Road Memorable Call Grls Number-9833754194-Bhayandar Speciallty Call Gir...
Mira Road Memorable Call Grls Number-9833754194-Bhayandar Speciallty Call Gir...Mira Road Memorable Call Grls Number-9833754194-Bhayandar Speciallty Call Gir...
Mira Road Memorable Call Grls Number-9833754194-Bhayandar Speciallty Call Gir...
 
VIP Call Girl Service Andheri West ⚡ 9920725232 What It Takes To Be The Best ...
VIP Call Girl Service Andheri West ⚡ 9920725232 What It Takes To Be The Best ...VIP Call Girl Service Andheri West ⚡ 9920725232 What It Takes To Be The Best ...
VIP Call Girl Service Andheri West ⚡ 9920725232 What It Takes To Be The Best ...
 
The Economic History of the U.S. Lecture 17.pdf
The Economic History of the U.S. Lecture 17.pdfThe Economic History of the U.S. Lecture 17.pdf
The Economic History of the U.S. Lecture 17.pdf
 
06_Joeri Van Speybroek_Dell_MeetupDora&Cybersecurity.pdf
06_Joeri Van Speybroek_Dell_MeetupDora&Cybersecurity.pdf06_Joeri Van Speybroek_Dell_MeetupDora&Cybersecurity.pdf
06_Joeri Van Speybroek_Dell_MeetupDora&Cybersecurity.pdf
 
Booking open Available Pune Call Girls Talegaon Dabhade 6297143586 Call Hot ...
Booking open Available Pune Call Girls Talegaon Dabhade  6297143586 Call Hot ...Booking open Available Pune Call Girls Talegaon Dabhade  6297143586 Call Hot ...
Booking open Available Pune Call Girls Talegaon Dabhade 6297143586 Call Hot ...
 
VIP Call Girl in Mira Road 💧 9920725232 ( Call Me ) Get A New Crush Everyday ...
VIP Call Girl in Mira Road 💧 9920725232 ( Call Me ) Get A New Crush Everyday ...VIP Call Girl in Mira Road 💧 9920725232 ( Call Me ) Get A New Crush Everyday ...
VIP Call Girl in Mira Road 💧 9920725232 ( Call Me ) Get A New Crush Everyday ...
 
Solution Manual for Financial Accounting, 11th Edition by Robert Libby, Patri...
Solution Manual for Financial Accounting, 11th Edition by Robert Libby, Patri...Solution Manual for Financial Accounting, 11th Edition by Robert Libby, Patri...
Solution Manual for Financial Accounting, 11th Edition by Robert Libby, Patri...
 
VVIP Pune Call Girls Katraj (7001035870) Pune Escorts Nearby with Complete Sa...
VVIP Pune Call Girls Katraj (7001035870) Pune Escorts Nearby with Complete Sa...VVIP Pune Call Girls Katraj (7001035870) Pune Escorts Nearby with Complete Sa...
VVIP Pune Call Girls Katraj (7001035870) Pune Escorts Nearby with Complete Sa...
 
( Jasmin ) Top VIP Escorts Service Dindigul 💧 7737669865 💧 by Dindigul Call G...
( Jasmin ) Top VIP Escorts Service Dindigul 💧 7737669865 💧 by Dindigul Call G...( Jasmin ) Top VIP Escorts Service Dindigul 💧 7737669865 💧 by Dindigul Call G...
( Jasmin ) Top VIP Escorts Service Dindigul 💧 7737669865 💧 by Dindigul Call G...
 
Indore Real Estate Market Trends Report.pdf
Indore Real Estate Market Trends Report.pdfIndore Real Estate Market Trends Report.pdf
Indore Real Estate Market Trends Report.pdf
 
The Economic History of the U.S. Lecture 21.pdf
The Economic History of the U.S. Lecture 21.pdfThe Economic History of the U.S. Lecture 21.pdf
The Economic History of the U.S. Lecture 21.pdf
 
From Luxury Escort Service Kamathipura : 9352852248 Make on-demand Arrangemen...
From Luxury Escort Service Kamathipura : 9352852248 Make on-demand Arrangemen...From Luxury Escort Service Kamathipura : 9352852248 Make on-demand Arrangemen...
From Luxury Escort Service Kamathipura : 9352852248 Make on-demand Arrangemen...
 
VIP Call Girl in Mumbai 💧 9920725232 ( Call Me ) Get A New Crush Everyday Wit...
VIP Call Girl in Mumbai 💧 9920725232 ( Call Me ) Get A New Crush Everyday Wit...VIP Call Girl in Mumbai 💧 9920725232 ( Call Me ) Get A New Crush Everyday Wit...
VIP Call Girl in Mumbai 💧 9920725232 ( Call Me ) Get A New Crush Everyday Wit...
 
Mira Road Awesome 100% Independent Call Girls NUmber-9833754194-Dahisar Inter...
Mira Road Awesome 100% Independent Call Girls NUmber-9833754194-Dahisar Inter...Mira Road Awesome 100% Independent Call Girls NUmber-9833754194-Dahisar Inter...
Mira Road Awesome 100% Independent Call Girls NUmber-9833754194-Dahisar Inter...
 
The Economic History of the U.S. Lecture 22.pdf
The Economic History of the U.S. Lecture 22.pdfThe Economic History of the U.S. Lecture 22.pdf
The Economic History of the U.S. Lecture 22.pdf
 

Putnam Capital Markets Outlook Q4 2013

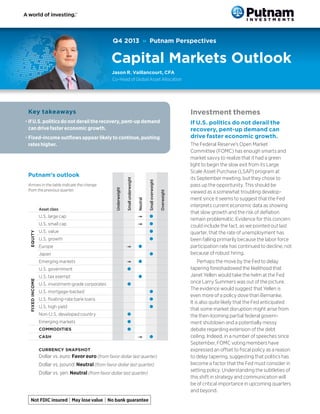
  • 1. Q4 2013 » Putnam Perspectives Capital Markets Outlook Jason R. Vaillancourt, CFA Co-Head of Global Asset Allocation Investment themes Key takeaways • If U.S. politics do not derail the recovery, pent-up demand can drive faster economic growth. If U.S. politics do not derail the recovery, pent-up demand can drive faster economic growth. l U.S. small cap EQUITY U.S. large cap l U.S. value l U.S. growth l Europe l Japan l Emerging markets FIXED INCOME U.S. government l l U.S. tax exempt U.S. investment-grade corporates l l U.S. mortgage-backed l U.S. floating-rate bank loans l U.S. high yield l Non-U.S. developed country l Emerging markets l COMMODITIES l CASH l CURRENCY SNAPSHOT Dollar vs. euro: Favor euro (from favor dollar last quarter) Dollar vs. pound: Neutral (from favor dollar last quarter) Dollar vs. yen: Neutral (from favor dollar last quarter) Overweight Small overweight Asset class Neutral Arrows in the table indicate the change from the previous quarter. Underweight Putnam’s outlook Small underweight • Fixed-income outflows appear likely to continue, pushing rates higher. The Federal Reserve’s Open Market Committee (FOMC) has enough smarts and market savvy to realize that it had a green light to begin the slow exit from its Large Scale Asset Purchase (LSAP) program at its September meeting, but they chose to pass up the opportunity. This should be viewed as a somewhat troubling development since it seems to suggest that the Fed interprets current economic data as showing that slow growth and the risk of deflation remain problematic. Evidence for this concern could include the fact, as we pointed out last quarter, that the rate of unemployment has been falling primarily because the labor force participation rate has continued to decline, not because of robust hiring. Perhaps the move by the Fed to delay tapering foreshadowed the likelihood that Janet Yellen would take the helm at the Fed once Larry Summers was out of the picture. The evidence would suggest that Yellen is even more of a policy dove than Bernanke. It is also quite likely that the Fed anticipated that some market disruption might arise from the then-looming partial federal government shutdown and a potentially messy debate regarding extension of the debt ceiling. Indeed, in a number of speeches since September, FOMC voting members have expressed an offset to fiscal policy as a reason to delay tapering, suggesting that politics has become a factor that the Fed must consider in setting policy. Understanding the subtleties of this shift in strategy and communication will be of critical importance in upcoming quarters and beyond.
  • 2. Q4 2013 |  Capital Markets Outlook Figure 1. � ousehold formation and capital H expenditures have been slow to rebound 2.5% 34% 2.0% 31% 1.5% 28% 1.0% 25% 0.5% 22% 0.0% 19% -0.5% 16% 3/1/03 2004 2005 2006 2007 2008 2009 2010 2011 2012 9/30/13 Beyond watching the actions of the Fed, we are also carefully monitoring our indicators of global growth. U.S. GDP growth during the recovery, underway since the middle of 2009, is among the weakest in recent history, averaging a little over 2% for the past four years, well below the previous long-term trends of 3% to 3.5%. For years, investors have been looking for the economy to shift to a faster gear, what economists sometimes refer to as “escape velocity.” It would take additional spending, driven by rising expectations, for the economy to provide the setting for stronger earnings growth. Percentage change in occupied housing units Net percentage of business owners planning new capital expenditures  Source: U.S. Census Bureau and National Federation of Independent Business. Household formation data represent monthly year-over-year percentage change in occupied housing units from February 2003 to June 2013. Capital expenditures data represent the net percentage of business owners planning a capital expenditure over the next 3–6 months, based on NFIB monthly surveys from February 2003 to September 2013. The good news is that a reacceleration into 2014 seems to be on track, with the litany of global macro risks beginning to recede, provided that U.S. politics does not derail the recovery. The thrust that could push the economy higher may come from pent-up demand from households and businesses. Household formation fell sharply during this downturn and only began to pick up again in 2012 as more people felt confident to move into their own apartments or to buy houses, which are the preconditions for future growth in consumer spending. Businesses, similarly, have been slow to ramp up capital expenditures and hiring. The big question today is whether CEOs and CFOs perhaps see the same signals that the Fed perceived. Do they have high expectations warranting greater investment and hiring, or do they detect weakness that calls for continued caution? It would take additional spending, driven by rising expectations, for the economy to provide the setting for stronger earnings growth. Such a shift appeared likely in mid 2011, until the escalation of the European sovereign credit crisis, Japanese tsunami, and U.S. credit downgrade triggered turmoil. Hopes also increased in 2012, before Europe again tottered on the edge of a deleveraging crisis and the U.S. government went to the precipice of the fiscal cliff. In both cases, the pace of GDP growth declined, bordering on what might be called “stall speed.” The difference between a 2% and a 3% growth rate may not seem like much, but it influences what has historically been a strong relationship between real GDP growth and corporate profits. Over the past five quarters, the revenue growth of S&P 500 companies has barely been above 1%, providing little impetus to bottom-line earnings growth. 2
  • 3. PUTNAM INVESTM ENTS |  putnam.com Fixed-income outflows appear likely to continue, pushing rates higher. strategy becomes much more important. The Fed has been grappling with a communications strategy in subsequent meetings. The process of normalizing monetary policy actually began at the end of 2012 when the Fed adopted a more data-dependent strategy for keeping rates low, as opposed to its previous approach, a fixed time commitment. This process continued at the end of April 2013 when the first hints emerged that the Fed might begin to slow its asset purchase program. The next step would be to actually begin to taper, leading to an eventual cessation of QE, and then to the ultimate step of removing its zero interest-rate policy. A reasonable rule of thumb is that over time, 10-year government bond yields can be approximated by the long-term rate of real growth in the economy, plus both an inflation premium and a term premium (what investors should be paid for moving further out on the yield curve). By this metric, U.S. Treasury yields have been substantially below where they “should” be. This has largely been the case since the Fed initiated extraordinary policy measures in 2008, in the middle of the financial crisis, when the federal funds rate went to an unprecedented range of 0%–0.25%. Extraordinary measures reached a high point in mid 2012 with larger bond purchases and the openended commitment to low interest rates, at a time when the 10-year Treasury yield reached the historic low of nearly 1.4%. Two things that seem relatively certain given the unprecedented monetary stimulus in place are, first, that when the cost of money is distorted, market dislocations will eventually emerge, and, second, that volatility will be higher. Fund flows offer a possibility for dislocation. Fixed-income mutual funds took in nearly $1 trillion from 2009 to 2012. Should this money flow out again at a rapid pace, it could have major implications across fixed-income sectors. We continue to keep a watchful eye out for where those vulnerabilities might eventually surface, as we also look for opportunities to capitalize on higher volatility. After the 2012 Economic Policy Symposium at Jackson Hole, Wyoming, a paper presented by Columbia University Professor Michael Woodford had a substantial impact on FOMC thinking. The paper argued that once interestrate policy has reached the zero bound, communication Figure 2. � xtraordinary policies have held E Treasury yields below fair value Actual 10-year Treasury yield vs. hypothetical fair-value yield 6.0% When the cost of money is distorted, market dislocations will eventually emerge, and volatility will be higher. 5.0% Hypothetical fair-value yield 4.0% 10-year Treasury yield 3.0% 2.0% 1.0% 9/09 9/10 9/11 9/12 9/13 3 Sources: Putnam Global Asset Allocation and Bloomberg. Fair Value Model represents hypothetical yield of Treasury calculated by adding the trailing 5-year average real GDP growth (Source: U.S. Bureau of Economic Analysis), and the University of Michigan Survey of one-year forward inflation expectations (Source: University of Michigan Survey Research Center).
  • 4. Q4 2013 |  Capital Markets Outlook Asset class views In Europe, the sharp austerity measures put in place a few years ago are now less of a drag on growth, and the economy is consequently emerging from its recession. Like the United Kingdom, tough economic conditions have forced Continental European companies to restructure as never before, bolstering their ability to improve earnings and operate more efficiently. Stocks in Europe have risen but are still cheap relative to fixed-income investments and U.S. stocks, in our opinion, and are also likely to show better earnings momentum as Europe’s economy recovers. Equity U.S. equity U.S. equities continued to advance, but not without turbulence, particularly in the final week of the quarter, when investors were distracted by Washington’s budget debate and the threat of a government shutdown. Uncertainty about Federal Reserve policy also influenced equities throughout the quarter, until the S&P 500 Index surged to a record high following the Fed’s September announcement that it would postpone tapering for at least another month. Japanese equities look reasonably attractive to us when we consider company valuations and earnings momentum. As long as the yen remains relatively weak — which it has done since the rollout of the government’s aggressive monetary and fiscal stimulus toward the end of 2012 — a variety of companies in Japan will likely exhibit attractive business characteristics. Autos and industrials performed well in the third calendar quarter, and we think there is room for share-price gains in these areas. In a trend that we view as positive, cyclical sectors again outperformed defensive stocks as investors appeared to shift their focus from safety and yield to fundamentals and valuation. Equity valuations are generally at the midpoint of their historic ranges, and they are more equivalent in that price-earnings multiples are in a tighter range across companies and sectors. In this environment, investment opportunities remain, but they are less obvious, and fundamental research and bottom-up stock selection become more critical, in our view. Emerging markets have been the weakest-performing equity class for four consecutive years. This year, the underperformance has been substantial. While we are generally finding better opportunities in developed markets, we believe the current broad-based sell-off in emerging markets, which began roughly in May, does open the door to certain opportunities. We think spending in the consumer sectors, including health care, could be increasingly strong over time. In addition, given China’s significant pollution and other environmental problems, we believe spending on pollution remediation and control could be significant going forward, even if China’s overall growth continues to disappoint. In terms of corporate earnings, given the relatively modest rate of recent U.S. economic growth, it is compelling that businesses have been able to deliver current levels of profit growth. In another promising development for equity markets, U.S. businesses have focused on structural improvements to enhance profitability, rather than rely on revenue growth. Our outlook has become more balanced and is less constructive than it had been several quarters ago when we believed the U.S. equity universe offered many exploitable opportunities. While we would not describe equities as expensive from a historical perspective, we are seeing far fewer pockets of anomalous valuations — areas in which stocks are extraordinarily inexpensive. Fixed income U.S. fixed income Interest rates, after spiking higher in June, remained elevated for most of the third quarter, due to uncertainty about when the Federal Reserve would begin scaling back quantitative easing. However, seeing a more uneven economic climate than it expected, including a weak September non-farm payroll report along with the potential for fiscal discord in Washington, the Fed decided to keep its $85 billion-a-month bond-buying program in place. Following this surprise mid-September decision, bonds rallied and interest rates declined. Non-U.S. equity The global economy is finding new engines of growth in the developed markets. In the United Kingdom, we see what we consider to be the proper balance of fiscal retrenchment and stimulative monetary policy, which is lending support to key sectors such as financials. This has contributed to the momentum of the country’s overall recovery as well as to our conviction in several “self-help” opportunities, where companies are pursuing aggressive internal restructuring actions that should result in meaningfully improved profitability. 4
  • 5. PUTNAM INVESTM ENTS |  putnam.com With the Fed’s decision, investors also showed a renewed appetite for credit risk, and sought to capitalize on the wider yield spreads offered by corporate securities. Securitized bonds, such as interest-only collateralized mortgage obligations (IO CMOs), also performed well. Mortgage credit holdings — most notably, commercial mortgage-backed securities (CMBS) — delivered modestly positive performance, aided by stable-to-rising commercial property values. MARKET TRENDS Index name (returns in USD) EQUITY INDEXES Q3 13 12 months ended 9/30/13 Dow Jones Industrial Average 5.24 19.34 Nasdaq 11.01 16.71 MSCI World (ND) 8.18 20.21 MSCI EAFE (ND) 11.56 23.77 MSCI Europe (ND) 13.61 24.23 MSCI Emerging Markets (ND) 5.77 0.98 Tokyo Topix 9.06 31.35 Russell 1000 6.02 20.91 Russell 2000 10.21 30.06 Russell 3000 Growth 8.48 20.30 Russell 3000 Value 4.23 22.67 0.57 -1.68 -0.66 -5.71 Barclays Government Bond 0.12 -1.98 Barclays MBS 1.03 -1.20 Barclays Municipal Bond -0.19 -2.21 BofA ML 3-Month T-bill 0.02 0.10 CG World Government Bond ex-U.S. 4.06 -5.65 JPMorgan Developed High Yield 2.62 7.71 JPMorgan Global High Yield 2.42 7.08 JPMorgan Emerging Markets Global Diversified 1.19 -4.06 S&P LSTA Loan The desire among policymakers and investors alike is for the financial markets to return to a more normalized environment over the medium term. Consequently, the Fed would prefer to transition from aggressively providing liquidity to the markets to letting the markets function on their own again. As the markets make this transition, there will continue to be periods of uncertainty. 15.59% S&P 500 From a fundamental point of view, we see underlying strength in the economy and among corporates. For this reason, we believe we are likely to see rates continue an upward march. As rates shift to higher levels, it could entail a pickup in volatility, though we expect that some stabilization of rates may be achieved by late in the year, along with tighter credit spreads. 2.12% 1.20 5.00 4.78 -4.14 FIXED INCOME INDEXES Barclays U.S. Aggregate Bond Barclays 10-Year Treasury Bellwether Non-U.S. fixed income The global macroeconomic environment, though less solid than the United States, appears to be stabilizing. This is particularly the case in Europe, which we see emerging from its recession, and in Japan, which is pursuing an aggressive policy agenda to weaken the yen and pull the economy out of a multidecade period of deflation. China, too, reported positive manufacturing data above economists’ expectations late in the third quarter. In emerging markets more generally, the Fed’s tapering discussion caused emerging-market debt to sell off late in the second quarter of 2013, and outflows from this sector continued through the third quarter. As that has happened, other issues have been exposed that may prove to be obstacles for this asset class. Those countries that did not use the recent era of global quantitative easing to improve their fiscal policies now appear to have relatively poor fundamentals and are faced with a negative environment for raising additional capital. However, we do not see at present a repeat of past emerging-market crises — such as the Asian currency crisis of 1998. COMMODITIES S&P GSCI It is not possible to invest directly in an index. Past performance is not indicative of future results. 5
  • 6. Q4 2013 |  Capital Markets Outlook Currency Tax exempt We continue to have a constructive outlook for municipal bonds, especially as part of a diversified portfolio and for long-term investors seeking tax-free income. The third quarter proved to be a very volatile time for municipal bonds, and market conditions remain less than robust. It is worth noting that while spreads are much narrower than they were at their peak, we believe the recent sell-off has created more attractive opportunities in a dislocated municipal market. We are taking relatively less risk in active currency strategies, as the Fed’s decision not to taper its stimulative bond-buying program and the shutdown of the U.S. government have created an environment with fewer opportunities, in our view. At this writing, it appears likely that a last-minute deal on the debt ceiling will keep the government from a technical default; however, the very small tail risk of default has quite severe implications for asset markets. In these conditions we have a neutral view toward the U.S. dollar. In our view, technical factors in the market are the big wild card at this point. Tax-exempt municipal fund outflows have really put a lot of downward pressure on prices in the market. Although we have seen some institutional crossover buyers come into the market to help support prices, we think it is unlikely that we will see volatility subside until outflows and rate volatility diminish. The overall fundamental credit outlook of municipal bonds appears solid. With regard to tax policy, while investors gained certainty on tax rates for 2013, many issues remain unresolved, including federal budget sequestration, the debt ceiling, and the potential for broader tax reform — all of which could affect the value of municipal bonds. As always, we are monitoring the situation closely and positioning the portfolios accordingly, based on our analysis. We favor a slight overweight to the euro as cyclical economic growth is improving and the European Central Bank (ECB) policy remains accommodative. The Fed’s decision to maintain asset purchases has given the ECB time by helping to lower the global term premia, relieving pressure on European short-term interest rates, and reducing the need for more dovish rhetoric. At the same time, we are less negative on the British pound sterling as U.K. economic growth data remain strong and are challenging the forward guidance as laid out by the Bank of England. Our view on the Japanese yen has become more neutral. Over the medium term, it is expected that the Bank of Japan will have to do much more monetary easing than currently slated, which should provide further impetus for the dollar to rally versus the yen. We also believe the yen and Japanese stocks may be more aligned than was the case earlier this year. Commodities Our fourth-quarter outlook for commodities is negative. We anticipate flat results in energy markets, believing that the geopolitical tensions that made oil more expensive before easing in September are fully reflected in current price levels. Geopolitical risk in the Middle East represented an upside risk for an oil spike last quarter, but it is now a potential downside risk for oil going forward. Elsewhere, we now favor a slight overweight to the Australian dollar and an underweight to the Canadian dollar. In emerging markets, we favor a relative value positioning. The surprise by the Fed and the probability that Janet Yellen will succeed Ben Bernanke as Chairman increases the chance of much more benign changes to U.S. monetary policy, but large structural long positions in local emerging debt markets remain in place, which leaves some emerging-market currencies more susceptible to capital outflows, we believe. For the rest of the commodity complex outside of energy, our signals are pointing toward a negative quarter. Momentum has largely been negative, emerging markets have been weak, and performance of commodity currencies suggests a further downtrend. Where we have policy-driven investments in commodities, we would continue to favor energy-heavy indices such as the S&P/ GSCI Index. One of the more interesting developments for commodity investors has been the sharp fall in correlation with equities. Commodities historically represented a great diversifier and alternative investment, but over the past decade, the correlation with equities has risen. The correlation weakened considerably over the third quarter of 2013, and we have no reason to predict that it will jump back up to higher levels. While the long-term bull market for commodities has faded, the portfolio construction case could well be rising again. 6
  • 7. PUTNAM INVESTM ENTS |  putnam.com The Barclays Government Bond Index is an unmanaged index of U.S. Treasury and government agency bonds. The Barclays Municipal Bond Index is an unmanaged index of long-term fixed-rate investment-grade tax-exempt bonds. The Barclays 10-Year U.S. Treasury Bellwether Index is an unmanaged index of U.S. Treasury bonds with 10 years’ maturity. The Barclays U.S. Aggregate Bond Index is an unmanaged index used as a general measure of U.S. fixed-income securities. The Barclays U.S. Mortgage-Backed Securities (MBS) Index covers agency mortgage-backed pass-through securities (both fixed-rate and hybrid ARM) issued by Ginnie Mae (GNMA), Fannie Mae (FNMA), and Freddie Mac (FHLMC). The BofA Merrill Lynch U.S. 3-Month Treasury Bill Index consists of U.S. Treasury bills maturing in 90 days. The Citigroup Non-U.S. World Government Bond Index is an unmanaged index generally considered to be representative of the world bond market excluding the United States. The Dow Jones Industrial Average Index (DJIA) is an unmanaged index composed of 30 blue-chip stocks whose one binding similarity is their hugeness — each has sales per year that exceed $7 bilÂ�Â�lion. The DJIA has been price-weighted since its inception on May 26, 1896, reflects large-cap companies representative of U.S. industry, and historically has moved in tandem with other major market indexes such as the S&P 500. The JPMorgan Developed High Yield Index is an unmanaged index of high-yield fixed-income securities issued in developed countries. The JPMorgan Emerging Markets Global Diversified Index is composed of U.S. dollar-denominated Brady bonds, eurobonds, traded loans, and local market debt instruments issued by sovereign and quasi-sovereign entities. JP Morgan Global High Yield Index is an unmanaged index of global high-yield fixed-income securities. The MSCI EAFE Index is an unmanaged list of equity securities from Europe and Australasia, with all values expressed in U.S. dollars. The MSCI Emerging Markets Index is a free-float-adjusted market-capitalizationweighted index that is designed to measure equity market performance in the global emerging markets. The MSCI Europe Index is an unmanaged list of equity securities originating in any of 15 European countries, with all values expressed in U.S. dollars. The MSCI World Index is an unmanaged list of securities from developed and emerging markets, with all values expressed in U.S. dollars. The Nasdaq Composite Index is a widely recognized, market-capitalization-weighted index that is designed to represent the performance of Nasdaq securities and includes over 3,000 stocks. The Russell 1000 Index is an unmanaged index of the 1,000 largest U.S. companies. The Russell 2000 Index is an unmanaged list of common stocks that is frequently used as a general performance measure of U.S. stocks of small and/or midsize companies. Russell 3000 Growth Index is an unmanaged index of those companies in the broadmarket Russell 3000 Index chosen for their growth orientation. Russell 3000 Value Index is an unmanaged index of those companies in the broadmarket Russell 3000 Index chosen for their value orientation. The S&P GSCI is a composite index of commodity sector returns that represents a broadly diversified, unleveraged, long-only position in commodity futures. The S&P/LSTA Leveraged Loan Index (LLI) is an unmanaged index of U.S. leveraged loans. The S&P 500 Index is an unmanaged list of common stocks that is frequently used as a general measure of U.S. stock market performance. The Tokyo Stock Exchange Index (TOPIX) is a market-capitalization-weighted index of over 1,100 stocks traded in the Japanese market. You cannot invest directly in an index. 7
  • 8. NOTES This material is provided for limited purposes. It is not intended as an offer or solicitation for the purchase or sale of any financial instrument, or any Putnam product or strategy. References to specific asset classes and financial markets are for illustrative purposes only and are not intended to be, and should not be interpreted as, recommendations or investment advice. The opinions expressed in this article represent the current, good-faith views of the author(s) at the time of publication. The views are provided for informational purposes only and are subject to change. This material does not take into account any investor’s particular investment objectives, strategies, tax status or investment horizon. Investors should consult a financial advisor for advice suited to their individual financial needs. Putnam Investments cannot guarantee the accuracy or completeness of any statements or data contained in the article. Predictions, opinions and other information contained in this article are subject to change. Any forward-looking statements speak only as of the date they are made, and Putnam assumes no duty to update them. Forward-looking statements are subject to numerous assumptions, risks and uncertainties. Actual results could differ materially from those anticipated. Past performance is not a guarantee of future results. As with any investment, there is a potential for profit as well as the possibility of loss. This presentation or any portion hereof may not be reprinted, sold, or redistributed in whole or in part without the express written consent of Putnam Investments. The information provided relates to Putnam Investments and its affiliates, which include The Putnam Advisory Company, LLC and Putnam Investments Limited®. Prepared for use in Canada by Putnam Investments Inc. [Investissements Putnam Inc.] (o/a Putnam Management in Manitoba). Where permitted, advisory services are provided in Canada by Putnam Investments Inc. [Investissements Putnam Inc.] (o/a Putnam Management in Manitoba) and its affiliate, The Putnam Advisory Company, LLC. Diversification does not assure a profit or protect against loss. It is possible to lose money in a diversified portfolio. Consider these risks before investing: International investing involves certain risks, such as currency fluctuations, economic instability, and political developments. Investments in small and/or midsize companies increase the risk of greater price fluctuations. Bond investments are subject to interest-rate risk, which means the prices of the fund’s bond investments are likely to fall if interest rates rise. Bond investments also are subject to credit risk, which is the risk that the issuer of the bond may default on payment of interest or principal. Interest-rate risk is generally greater for longer-term bonds, and credit risk is generally greater for below-investment-grade bonds, which may be considered speculative. Unlike bonds, funds that invest in bonds have ongoing fees and expenses. Lower-rated bonds may offer higher yields in return for more risk. Funds that invest in government securities are not guaranteed. Mortgage-backed securities are subject to prepayment risk. Commodities involve the risks of changes in market, political, regulatory, and natural conditions. Scan code or visit putnam.com/outlook for more insight on the global investment landscape. Visit putnam.com for news and information, and our Perspectives blog for in-depth analysis on a range of investment topics. If you are a U.S. retail investor, please request a prospectus, or a summary prospectus if available, from your financial representative or by calling Putnam at 1-800-225-1581. The prospectus includes investment objectives, risks, fees, expenses, and other information that you should read and consider carefully before investing. In the United States, mutual funds are distributed by Putnam Retail Management. putnam.com� CM0100 283556 10/13