Dell Poweredge FX Infographic

Bridge traditional & new IT Workloads on one platform... A wave of new, modern workloads is forcing companies to find a bridge between current infrastructure and future investment without sacrificing cost, capability or confidence. By converging hardware, management and workloads, the PowerEdge FX architecture allows customers to precisely tailor, quickly deploy and easily manage a diverse set of applications using a common set of modular IT building blocks. The PowerEdge FX architecture takes the density and modularity of blades, adds the cost efficiency and manageability of racks, and combines that with modular storage, a flexible fabric and future-ready server nodes. All engineered to provide IT flexibility to shift and scale as requirements change in the future. For more information: http://www.dell.com/FX
Recomendados

Recomendados
Más contenido relacionado
La actualidad más candente
La actualidad más candente (20)
Similar a Dell Poweredge FX Infographic
Similar a Dell Poweredge FX Infographic (20)
Último
Último (20)
Dell Poweredge FX Infographic
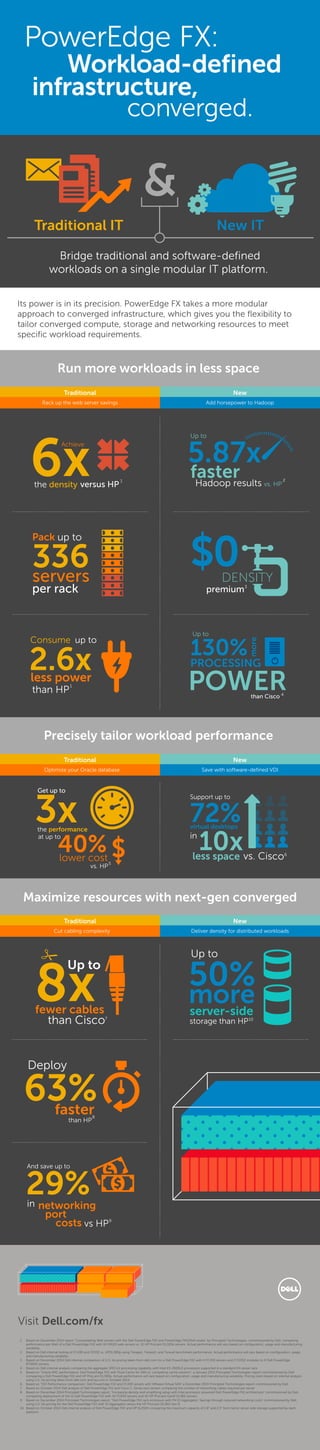
- 1. I PowerEdge FX: Workload-defined converged. infrastructure, And save up to 29%in 9 networking port costs vs HP the performance 3x lower cost5 40% at up to vs. HP Get up to than HP 2.6x 1 Consume up to less power fewer cables 8xthan Cisco7 Up to Visit Dell.com/fx Bridge traditional and software-defined workloads on a single modular IT platform. Traditional IT New IT & Its power is in its precision. PowerEdge FX takes a more modular approach to converged infrastructure, which gives you the flexibility to tailor converged compute, storage and networking resources to meet specific workload requirements. 6xthe density versus HP 1 Achieve Pack up to 336 per rack servers DENSITY premium3 $0 Run more workloads in less space Maximize resources with next-gen converged Precisely tailor workload performance New Add horsepower to Hadoop Traditional Rack up the web server savings New Save with software-defined VDI Traditional Optimize your Oracle database New Deliver density for distributed workloads Traditional Cut cabling complexity less space 10xvs. Cisco6 Support up to 72%virtual desktops in 5.87x fasterHadoop results 2 Up to vs. HP than Cisco 4 PROCESSING 130% more POWER Up to 63%faster8 Deploy than HP server-side storage than HP10 50% more Up to 1. Based on December 2014 report "Consolidating Web servers with the Dell PowerEdge FX2 and PowerEdge FM120x4 nodes" by Principled Technologies, commissioned by Dell, comparing performance per Watt of a Dell PowerEdge FX2 with 16 FM120 web servers vs. 12 HP ProLiant DL320e servers. Actual performance will vary based on configuration, usage and manufacturing variability. 2. Based on Dell internal testing of FC430 and FD332 vs. HPDL380p using Teragen, Terasort, and Teraval benchmark performance. Actual performance will vary based on configuration, usage, and manufacturing variability. 3. Based on December 2014 Dell internal comparison of U.S. list pricing taken from dell.com for a Dell PowerEdge FX2 with 4 FC430 servers and 2 FD332 modules to 4 Dell PowerEdge R730XD servers. 4. Based on Dell internal analysis comparing the aggregate SPECint processing capability with Intel E5-2600v3 processors supported in a standard EIA server rack. 5. Based on "Oracle RAC performance: Dell PowerEdge FX2 with Fluid Cache for SAN vs. competing cache solution", a January 2015 Principled Technologies report commissioned by Dell comparing a Dell PowerEdge FX2 and HP ProLiant DL380p. Actual performance will vary based on configuration, usage and manufacturing variability. Pricing claim based on internal analysis using U.S. list pricing taken from dell.com and hp.com in October 2014. 6. Based on “VDI Performance comparison: Dell PowerEdge FX2 and FC430 servers with VMware Virtual SAN” a December 2014 Principled Technologies report commissioned by Dell. 7. Based on October 2014 Dell analysis of Dell PowerEdge FX2 and Cisco C-Series rack servers comparing the number of networking cables required per server 8. Based on December 2014 Principled Technologies report, “Increasing density and simplifying setup with Intel processor-powered Dell PowerEdge FX2 architecture” commissioned by Dell, comparing deployment of the 11 Dell PowerEdge FX2 with 42 FC630 servers and 42 HP ProLiant Gen9 DL360 servers. 9. Based on December 2014 Principled Technologies report, “Dell PowerEdge FX2 rack enclosure with FN IO Aggregator: Savings through reduced networking costs” commissioned by Dell, using U.S. list pricing for the Dell PowerEdge FX2 with IO Aggregator versus the HP ProLiant DL360 Gen 9. 10. Based on October 2014 Dell internal analysis of Dell PowerEdge FX2 and HP SL2500 comparing the maximum capacity of 1.8” and 2.5” form factor server side storage supported by each platform.