SlideShare una empresa de Scribd logo
1 de 1
Descargar para leer sin conexión
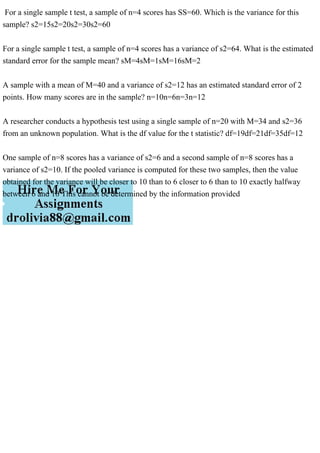
For a single sample t test, a sample of n=4 scores has SS=60. Which is the variance for this
sample? s2=15s2=20s2=30s2=60
For a single sample t test, a sample of n=4 scores has a variance of s2=64. What is the estimated
standard error for the sample mean? sM=4sM=1sM=16sM=2
A sample with a mean of M=40 and a variance of s2=12 has an estimated standard error of 2
points. How many scores are in the sample? n=10n=6n=3n=12
A researcher conducts a hypothesis test using a single sample of n=20 with M=34 and s2=36
from an unknown population. What is the df value for the t statistic? df=19df=21df=35df=12
One sample of n=8 scores has a variance of s2=6 and a second sample of n=8 scores has a
variance of s2=10. If the pooled variance is computed for these two samples, then the value
obtained for the variance will be closer to 10 than to 6 closer to 6 than to 10 exactly halfway
between 6 and 10 This cannot be determined by the information provided

Más contenido relacionado

Similar a For a single sample t test, a sample of n=4 scores has SS=60. Which i.pdf

10.Analysis of Variance.ppt
10.Analysis of Variance.ppt10.Analysis of Variance.ppt
10.Analysis of Variance.pptAbdulhaqAli
 
Questions Of Quantitative Aptitude Tests For Competitive Examinations
Questions Of Quantitative Aptitude Tests For Competitive ExaminationsQuestions Of Quantitative Aptitude Tests For Competitive Examinations
Questions Of Quantitative Aptitude Tests For Competitive ExaminationsDr. Trilok Kumar Jain
 
Questions Of Quantitative Aptitude Tests For Competitive Examinations
Questions Of Quantitative Aptitude Tests For Competitive ExaminationsQuestions Of Quantitative Aptitude Tests For Competitive Examinations
Questions Of Quantitative Aptitude Tests For Competitive ExaminationsDr. Trilok Kumar Jain
 
Questions of quantitative aptitude tests for competitive examinations
Questions of quantitative aptitude tests for competitive examinations Questions of quantitative aptitude tests for competitive examinations
Questions of quantitative aptitude tests for competitive examinations Dr. Trilok Kumar Jain
 
Questions Of Quantitative Aptitude Tests For Competitive Examinations
Questions Of Quantitative Aptitude Tests For Competitive ExaminationsQuestions Of Quantitative Aptitude Tests For Competitive Examinations
Questions Of Quantitative Aptitude Tests For Competitive ExaminationsDr. Trilok Kumar Jain
 
Questions Of Quantitative Aptitude Tests For Competitive Examinations
Questions Of  Quantitative Aptitude Tests For Competitive ExaminationsQuestions Of  Quantitative Aptitude Tests For Competitive Examinations
Questions Of Quantitative Aptitude Tests For Competitive ExaminationsDr. Trilok Kumar Jain
 
Averages and range
Averages and rangeAverages and range
Averages and rangemwardyrem
 
Chi-square, Yates, Fisher & McNemar
Chi-square, Yates, Fisher & McNemarChi-square, Yates, Fisher & McNemar
Chi-square, Yates, Fisher & McNemarAzmi Mohd Tamil
 
Quant 125 awesome questions
Quant 125 awesome questionsQuant 125 awesome questions
Quant 125 awesome questionsRushabh Vora
 
Analysis of variance (ANOVA)
Analysis of variance (ANOVA)Analysis of variance (ANOVA)
Analysis of variance (ANOVA)Sneh Kumari
 
Sampling Distribution -I
Sampling Distribution -ISampling Distribution -I
Sampling Distribution -ISadam Hussen
 
09 test of hypothesis small sample.ppt
09 test of hypothesis small sample.ppt09 test of hypothesis small sample.ppt
09 test of hypothesis small sample.pptPooja Sakhla
 

Similar a For a single sample t test, a sample of n=4 scores has SS=60. Which i.pdf (17)

10.Analysis of Variance.ppt
10.Analysis of Variance.ppt10.Analysis of Variance.ppt
10.Analysis of Variance.ppt
 
measures-of-central-tendency.pdf
measures-of-central-tendency.pdfmeasures-of-central-tendency.pdf
measures-of-central-tendency.pdf
 
Questions Of Quantitative Aptitude Tests For Competitive Examinations
Questions Of Quantitative Aptitude Tests For Competitive ExaminationsQuestions Of Quantitative Aptitude Tests For Competitive Examinations
Questions Of Quantitative Aptitude Tests For Competitive Examinations
 
Questions Of Quantitative Aptitude Tests For Competitive Examinations
Questions Of Quantitative Aptitude Tests For Competitive ExaminationsQuestions Of Quantitative Aptitude Tests For Competitive Examinations
Questions Of Quantitative Aptitude Tests For Competitive Examinations
 
Questions of quantitative aptitude tests for competitive examinations
Questions of quantitative aptitude tests for competitive examinations Questions of quantitative aptitude tests for competitive examinations
Questions of quantitative aptitude tests for competitive examinations
 
Questions Of Quantitative Aptitude Tests For Competitive Examinations
Questions Of Quantitative Aptitude Tests For Competitive ExaminationsQuestions Of Quantitative Aptitude Tests For Competitive Examinations
Questions Of Quantitative Aptitude Tests For Competitive Examinations
 
Questions Of Quantitative Aptitude Tests For Competitive Examinations
Questions Of  Quantitative Aptitude Tests For Competitive ExaminationsQuestions Of  Quantitative Aptitude Tests For Competitive Examinations
Questions Of Quantitative Aptitude Tests For Competitive Examinations
 
Sd,t test
Sd,t testSd,t test
Sd,t test
 
Correlation
CorrelationCorrelation
Correlation
 
Averages and range
Averages and rangeAverages and range
Averages and range
 
Measures of Spread
Measures of SpreadMeasures of Spread
Measures of Spread
 
Chi-square, Yates, Fisher & McNemar
Chi-square, Yates, Fisher & McNemarChi-square, Yates, Fisher & McNemar
Chi-square, Yates, Fisher & McNemar
 
Quant 125 awesome questions
Quant 125 awesome questionsQuant 125 awesome questions
Quant 125 awesome questions
 
Analysis of variance (ANOVA)
Analysis of variance (ANOVA)Analysis of variance (ANOVA)
Analysis of variance (ANOVA)
 
Sampling Distribution -I
Sampling Distribution -ISampling Distribution -I
Sampling Distribution -I
 
09 test of hypothesis small sample.ppt
09 test of hypothesis small sample.ppt09 test of hypothesis small sample.ppt
09 test of hypothesis small sample.ppt
 
statistics 10th (1) (3).pdf
statistics 10th (1) (3).pdfstatistics 10th (1) (3).pdf
statistics 10th (1) (3).pdf
 

Más de rajanaroraraj

Future value. Upstate University charges $16,000 a year in graduate t.pdf
 Future value. Upstate University charges $16,000 a year in graduate t.pdf Future value. Upstate University charges $16,000 a year in graduate t.pdf
Future value. Upstate University charges $16,000 a year in graduate t.pdfrajanaroraraj
 
Fungi seem to get a bad rep. If you told someone that they had a fung.pdf
 Fungi seem to get a bad rep. If you told someone that they had a fung.pdf Fungi seem to get a bad rep. If you told someone that they had a fung.pdf
Fungi seem to get a bad rep. If you told someone that they had a fung.pdfrajanaroraraj
 
formcastirg ciak. Click the icon la vitw the now car ales data �-�[31.pdf
 formcastirg ciak. Click the icon la vitw the now car ales data �-�[31.pdf formcastirg ciak. Click the icon la vitw the now car ales data �-�[31.pdf
formcastirg ciak. Click the icon la vitw the now car ales data �-�[31.pdfrajanaroraraj
 
For the following taxpayers, determine if they are required to file a.pdf
 For the following taxpayers, determine if they are required to file a.pdf For the following taxpayers, determine if they are required to file a.pdf
For the following taxpayers, determine if they are required to file a.pdfrajanaroraraj
 
For reporting purposes, deferred tax assets and deferred tax liabilit.pdf
 For reporting purposes, deferred tax assets and deferred tax liabilit.pdf For reporting purposes, deferred tax assets and deferred tax liabilit.pdf
For reporting purposes, deferred tax assets and deferred tax liabilit.pdfrajanaroraraj
 
For the following method named Test, What would the output be if n=.pdf
 For the following method named Test, What would the output be if n=.pdf For the following method named Test, What would the output be if n=.pdf
For the following method named Test, What would the output be if n=.pdfrajanaroraraj
 
For the following list of diseases a.) Identify the organism (species.pdf
 For the following list of diseases a.) Identify the organism (species.pdf For the following list of diseases a.) Identify the organism (species.pdf
For the following list of diseases a.) Identify the organism (species.pdfrajanaroraraj
 
For events E, F, suppose that P(E)=0.6. What could the possible condi.pdf
 For events E, F, suppose that P(E)=0.6. What could the possible condi.pdf For events E, F, suppose that P(E)=0.6. What could the possible condi.pdf
For events E, F, suppose that P(E)=0.6. What could the possible condi.pdfrajanaroraraj
 
For C. difficile, answer the following questions a. What are the v.pdf
 For C. difficile, answer the following questions a. What are the v.pdf For C. difficile, answer the following questions a. What are the v.pdf
For C. difficile, answer the following questions a. What are the v.pdfrajanaroraraj
 
For a standard normal distribution, find P(2.2z2.69)For a stand.pdf
 For a standard normal distribution, find P(2.2z2.69)For a stand.pdf For a standard normal distribution, find P(2.2z2.69)For a stand.pdf
For a standard normal distribution, find P(2.2z2.69)For a stand.pdfrajanaroraraj
 
For a standard normal distribution, find P(z1.09).pdf
 For a standard normal distribution, find P(z1.09).pdf For a standard normal distribution, find P(z1.09).pdf
For a standard normal distribution, find P(z1.09).pdfrajanaroraraj
 
For a standard normal distribution, find P(1.22z1.82).pdf
 For a standard normal distribution, find P(1.22z1.82).pdf For a standard normal distribution, find P(1.22z1.82).pdf
For a standard normal distribution, find P(1.22z1.82).pdfrajanaroraraj
 
For a standard normal distribution, find c if P(zc)=0.8477.pdf
 For a standard normal distribution, find c if P(zc)=0.8477.pdf For a standard normal distribution, find c if P(zc)=0.8477.pdf
For a standard normal distribution, find c if P(zc)=0.8477.pdfrajanaroraraj
 
For a normal variable XN(=28.1,=2.9), find the probability P(X21.15).pdf
 For a normal variable XN(=28.1,=2.9), find the probability P(X21.15).pdf For a normal variable XN(=28.1,=2.9), find the probability P(X21.15).pdf
For a normal variable XN(=28.1,=2.9), find the probability P(X21.15).pdfrajanaroraraj
 
For a group of four 70-year old men, the probability distribution for.pdf
 For a group of four 70-year old men, the probability distribution for.pdf For a group of four 70-year old men, the probability distribution for.pdf
For a group of four 70-year old men, the probability distribution for.pdfrajanaroraraj
 
For a double-precision 64-bit binary floating-point number in IEEE fo.pdf
 For a double-precision 64-bit binary floating-point number in IEEE fo.pdf For a double-precision 64-bit binary floating-point number in IEEE fo.pdf
For a double-precision 64-bit binary floating-point number in IEEE fo.pdfrajanaroraraj
 
For each of the proposals, use the previous graph to determine the ne.pdf
 For each of the proposals, use the previous graph to determine the ne.pdf For each of the proposals, use the previous graph to determine the ne.pdf
For each of the proposals, use the previous graph to determine the ne.pdfrajanaroraraj
 
For a continuous random variable X with an exponential distribution w.pdf
 For a continuous random variable X with an exponential distribution w.pdf For a continuous random variable X with an exponential distribution w.pdf
For a continuous random variable X with an exponential distribution w.pdfrajanaroraraj
 
For Blossom Corporation, year-end plan assets were $1,752,900. At the.pdf
 For Blossom Corporation, year-end plan assets were $1,752,900. At the.pdf For Blossom Corporation, year-end plan assets were $1,752,900. At the.pdf
For Blossom Corporation, year-end plan assets were $1,752,900. At the.pdfrajanaroraraj
 
For a standard normal distribution, suppose the following is true P(.pdf
 For a standard normal distribution, suppose the following is true P(.pdf For a standard normal distribution, suppose the following is true P(.pdf
For a standard normal distribution, suppose the following is true P(.pdfrajanaroraraj
 

Más de rajanaroraraj (20)

Future value. Upstate University charges $16,000 a year in graduate t.pdf
 Future value. Upstate University charges $16,000 a year in graduate t.pdf Future value. Upstate University charges $16,000 a year in graduate t.pdf
Future value. Upstate University charges $16,000 a year in graduate t.pdf
 
Fungi seem to get a bad rep. If you told someone that they had a fung.pdf
 Fungi seem to get a bad rep. If you told someone that they had a fung.pdf Fungi seem to get a bad rep. If you told someone that they had a fung.pdf
Fungi seem to get a bad rep. If you told someone that they had a fung.pdf
 
formcastirg ciak. Click the icon la vitw the now car ales data �-�[31.pdf
 formcastirg ciak. Click the icon la vitw the now car ales data �-�[31.pdf formcastirg ciak. Click the icon la vitw the now car ales data �-�[31.pdf
formcastirg ciak. Click the icon la vitw the now car ales data �-�[31.pdf
 
For the following taxpayers, determine if they are required to file a.pdf
 For the following taxpayers, determine if they are required to file a.pdf For the following taxpayers, determine if they are required to file a.pdf
For the following taxpayers, determine if they are required to file a.pdf
 
For reporting purposes, deferred tax assets and deferred tax liabilit.pdf
 For reporting purposes, deferred tax assets and deferred tax liabilit.pdf For reporting purposes, deferred tax assets and deferred tax liabilit.pdf
For reporting purposes, deferred tax assets and deferred tax liabilit.pdf
 
For the following method named Test, What would the output be if n=.pdf
 For the following method named Test, What would the output be if n=.pdf For the following method named Test, What would the output be if n=.pdf
For the following method named Test, What would the output be if n=.pdf
 
For the following list of diseases a.) Identify the organism (species.pdf
 For the following list of diseases a.) Identify the organism (species.pdf For the following list of diseases a.) Identify the organism (species.pdf
For the following list of diseases a.) Identify the organism (species.pdf
 
For events E, F, suppose that P(E)=0.6. What could the possible condi.pdf
 For events E, F, suppose that P(E)=0.6. What could the possible condi.pdf For events E, F, suppose that P(E)=0.6. What could the possible condi.pdf
For events E, F, suppose that P(E)=0.6. What could the possible condi.pdf
 
For C. difficile, answer the following questions a. What are the v.pdf
 For C. difficile, answer the following questions a. What are the v.pdf For C. difficile, answer the following questions a. What are the v.pdf
For C. difficile, answer the following questions a. What are the v.pdf
 
For a standard normal distribution, find P(2.2z2.69)For a stand.pdf
 For a standard normal distribution, find P(2.2z2.69)For a stand.pdf For a standard normal distribution, find P(2.2z2.69)For a stand.pdf
For a standard normal distribution, find P(2.2z2.69)For a stand.pdf
 
For a standard normal distribution, find P(z1.09).pdf
 For a standard normal distribution, find P(z1.09).pdf For a standard normal distribution, find P(z1.09).pdf
For a standard normal distribution, find P(z1.09).pdf
 
For a standard normal distribution, find P(1.22z1.82).pdf
 For a standard normal distribution, find P(1.22z1.82).pdf For a standard normal distribution, find P(1.22z1.82).pdf
For a standard normal distribution, find P(1.22z1.82).pdf
 
For a standard normal distribution, find c if P(zc)=0.8477.pdf
 For a standard normal distribution, find c if P(zc)=0.8477.pdf For a standard normal distribution, find c if P(zc)=0.8477.pdf
For a standard normal distribution, find c if P(zc)=0.8477.pdf
 
For a normal variable XN(=28.1,=2.9), find the probability P(X21.15).pdf
 For a normal variable XN(=28.1,=2.9), find the probability P(X21.15).pdf For a normal variable XN(=28.1,=2.9), find the probability P(X21.15).pdf
For a normal variable XN(=28.1,=2.9), find the probability P(X21.15).pdf
 
For a group of four 70-year old men, the probability distribution for.pdf
 For a group of four 70-year old men, the probability distribution for.pdf For a group of four 70-year old men, the probability distribution for.pdf
For a group of four 70-year old men, the probability distribution for.pdf
 
For a double-precision 64-bit binary floating-point number in IEEE fo.pdf
 For a double-precision 64-bit binary floating-point number in IEEE fo.pdf For a double-precision 64-bit binary floating-point number in IEEE fo.pdf
For a double-precision 64-bit binary floating-point number in IEEE fo.pdf
 
For each of the proposals, use the previous graph to determine the ne.pdf
 For each of the proposals, use the previous graph to determine the ne.pdf For each of the proposals, use the previous graph to determine the ne.pdf
For each of the proposals, use the previous graph to determine the ne.pdf
 
For a continuous random variable X with an exponential distribution w.pdf
 For a continuous random variable X with an exponential distribution w.pdf For a continuous random variable X with an exponential distribution w.pdf
For a continuous random variable X with an exponential distribution w.pdf
 
For Blossom Corporation, year-end plan assets were $1,752,900. At the.pdf
 For Blossom Corporation, year-end plan assets were $1,752,900. At the.pdf For Blossom Corporation, year-end plan assets were $1,752,900. At the.pdf
For Blossom Corporation, year-end plan assets were $1,752,900. At the.pdf
 
For a standard normal distribution, suppose the following is true P(.pdf
 For a standard normal distribution, suppose the following is true P(.pdf For a standard normal distribution, suppose the following is true P(.pdf
For a standard normal distribution, suppose the following is true P(.pdf
 

Último

Introduction to ArtificiaI Intelligence in Higher Education
Introduction to ArtificiaI Intelligence in Higher EducationIntroduction to ArtificiaI Intelligence in Higher Education
Introduction to ArtificiaI Intelligence in Higher Educationpboyjonauth
 
Z Score,T Score, Percential Rank and Box Plot Graph
Z Score,T Score, Percential Rank and Box Plot GraphZ Score,T Score, Percential Rank and Box Plot Graph
Z Score,T Score, Percential Rank and Box Plot GraphThiyagu K
 
Student login on Anyboli platform.helpin
Student login on Anyboli platform.helpinStudent login on Anyboli platform.helpin
Student login on Anyboli platform.helpinRaunakKeshri1
 
Q4-W6-Restating Informational Text Grade 3
Q4-W6-Restating Informational Text Grade 3Q4-W6-Restating Informational Text Grade 3
Q4-W6-Restating Informational Text Grade 3JemimahLaneBuaron
 
Mastering the Unannounced Regulatory Inspection
Mastering the Unannounced Regulatory InspectionMastering the Unannounced Regulatory Inspection
Mastering the Unannounced Regulatory InspectionSafetyChain Software
 
Kisan Call Centre - To harness potential of ICT in Agriculture by answer farm...
Kisan Call Centre - To harness potential of ICT in Agriculture by answer farm...Kisan Call Centre - To harness potential of ICT in Agriculture by answer farm...
Kisan Call Centre - To harness potential of ICT in Agriculture by answer farm...Krashi Coaching
 
Beyond the EU: DORA and NIS 2 Directive's Global Impact
Beyond the EU: DORA and NIS 2 Directive's Global ImpactBeyond the EU: DORA and NIS 2 Directive's Global Impact
Beyond the EU: DORA and NIS 2 Directive's Global ImpactPECB
 
Nutritional Needs Presentation - HLTH 104
Nutritional Needs Presentation - HLTH 104Nutritional Needs Presentation - HLTH 104
Nutritional Needs Presentation - HLTH 104misteraugie
 
Presentation by Andreas Schleicher Tackling the School Absenteeism Crisis 30 ...
Presentation by Andreas Schleicher Tackling the School Absenteeism Crisis 30 ...Presentation by Andreas Schleicher Tackling the School Absenteeism Crisis 30 ...
Presentation by Andreas Schleicher Tackling the School Absenteeism Crisis 30 ...EduSkills OECD
 
1029-Danh muc Sach Giao Khoa khoi 6.pdf
1029-Danh muc Sach Giao Khoa khoi  6.pdf1029-Danh muc Sach Giao Khoa khoi  6.pdf
1029-Danh muc Sach Giao Khoa khoi 6.pdfQucHHunhnh
 
Measures of Central Tendency: Mean, Median and Mode
Measures of Central Tendency: Mean, Median and ModeMeasures of Central Tendency: Mean, Median and Mode
Measures of Central Tendency: Mean, Median and ModeThiyagu K
 
Activity 01 - Artificial Culture (1).pdf
Activity 01 - Artificial Culture (1).pdfActivity 01 - Artificial Culture (1).pdf
Activity 01 - Artificial Culture (1).pdfciinovamais
 
POINT- BIOCHEMISTRY SEM 2 ENZYMES UNIT 5.pptx
POINT- BIOCHEMISTRY SEM 2 ENZYMES UNIT 5.pptxPOINT- BIOCHEMISTRY SEM 2 ENZYMES UNIT 5.pptx
POINT- BIOCHEMISTRY SEM 2 ENZYMES UNIT 5.pptxSayali Powar
 
The Most Excellent Way | 1 Corinthians 13
The Most Excellent Way | 1 Corinthians 13The Most Excellent Way | 1 Corinthians 13
The Most Excellent Way | 1 Corinthians 13Steve Thomason
 
URLs and Routing in the Odoo 17 Website App
URLs and Routing in the Odoo 17 Website AppURLs and Routing in the Odoo 17 Website App
URLs and Routing in the Odoo 17 Website AppCeline George
 
mini mental status format.docx
mini    mental       status     format.docxmini    mental       status     format.docx
mini mental status format.docxPoojaSen20
 
18-04-UA_REPORT_MEDIALITERAСY_INDEX-DM_23-1-final-eng.pdf
18-04-UA_REPORT_MEDIALITERAСY_INDEX-DM_23-1-final-eng.pdf18-04-UA_REPORT_MEDIALITERAСY_INDEX-DM_23-1-final-eng.pdf
18-04-UA_REPORT_MEDIALITERAСY_INDEX-DM_23-1-final-eng.pdfssuser54595a
 

Último (20)

Staff of Color (SOC) Retention Efforts DDSD
Staff of Color (SOC) Retention Efforts DDSDStaff of Color (SOC) Retention Efforts DDSD
Staff of Color (SOC) Retention Efforts DDSD
 
Introduction to ArtificiaI Intelligence in Higher Education
Introduction to ArtificiaI Intelligence in Higher EducationIntroduction to ArtificiaI Intelligence in Higher Education
Introduction to ArtificiaI Intelligence in Higher Education
 
Z Score,T Score, Percential Rank and Box Plot Graph
Z Score,T Score, Percential Rank and Box Plot GraphZ Score,T Score, Percential Rank and Box Plot Graph
Z Score,T Score, Percential Rank and Box Plot Graph
 
Student login on Anyboli platform.helpin
Student login on Anyboli platform.helpinStudent login on Anyboli platform.helpin
Student login on Anyboli platform.helpin
 
Q4-W6-Restating Informational Text Grade 3
Q4-W6-Restating Informational Text Grade 3Q4-W6-Restating Informational Text Grade 3
Q4-W6-Restating Informational Text Grade 3
 
Mattingly "AI & Prompt Design: The Basics of Prompt Design"
Mattingly "AI & Prompt Design: The Basics of Prompt Design"Mattingly "AI & Prompt Design: The Basics of Prompt Design"
Mattingly "AI & Prompt Design: The Basics of Prompt Design"
 
Mastering the Unannounced Regulatory Inspection
Mastering the Unannounced Regulatory InspectionMastering the Unannounced Regulatory Inspection
Mastering the Unannounced Regulatory Inspection
 
Kisan Call Centre - To harness potential of ICT in Agriculture by answer farm...
Kisan Call Centre - To harness potential of ICT in Agriculture by answer farm...Kisan Call Centre - To harness potential of ICT in Agriculture by answer farm...
Kisan Call Centre - To harness potential of ICT in Agriculture by answer farm...
 
Beyond the EU: DORA and NIS 2 Directive's Global Impact
Beyond the EU: DORA and NIS 2 Directive's Global ImpactBeyond the EU: DORA and NIS 2 Directive's Global Impact
Beyond the EU: DORA and NIS 2 Directive's Global Impact
 
Nutritional Needs Presentation - HLTH 104
Nutritional Needs Presentation - HLTH 104Nutritional Needs Presentation - HLTH 104
Nutritional Needs Presentation - HLTH 104
 
Presentation by Andreas Schleicher Tackling the School Absenteeism Crisis 30 ...
Presentation by Andreas Schleicher Tackling the School Absenteeism Crisis 30 ...Presentation by Andreas Schleicher Tackling the School Absenteeism Crisis 30 ...
Presentation by Andreas Schleicher Tackling the School Absenteeism Crisis 30 ...
 
1029-Danh muc Sach Giao Khoa khoi 6.pdf
1029-Danh muc Sach Giao Khoa khoi  6.pdf1029-Danh muc Sach Giao Khoa khoi  6.pdf
1029-Danh muc Sach Giao Khoa khoi 6.pdf
 
Measures of Central Tendency: Mean, Median and Mode
Measures of Central Tendency: Mean, Median and ModeMeasures of Central Tendency: Mean, Median and Mode
Measures of Central Tendency: Mean, Median and Mode
 
Activity 01 - Artificial Culture (1).pdf
Activity 01 - Artificial Culture (1).pdfActivity 01 - Artificial Culture (1).pdf
Activity 01 - Artificial Culture (1).pdf
 
Código Creativo y Arte de Software | Unidad 1
Código Creativo y Arte de Software | Unidad 1Código Creativo y Arte de Software | Unidad 1
Código Creativo y Arte de Software | Unidad 1
 
POINT- BIOCHEMISTRY SEM 2 ENZYMES UNIT 5.pptx
POINT- BIOCHEMISTRY SEM 2 ENZYMES UNIT 5.pptxPOINT- BIOCHEMISTRY SEM 2 ENZYMES UNIT 5.pptx
POINT- BIOCHEMISTRY SEM 2 ENZYMES UNIT 5.pptx
 
The Most Excellent Way | 1 Corinthians 13
The Most Excellent Way | 1 Corinthians 13The Most Excellent Way | 1 Corinthians 13
The Most Excellent Way | 1 Corinthians 13
 
URLs and Routing in the Odoo 17 Website App
URLs and Routing in the Odoo 17 Website AppURLs and Routing in the Odoo 17 Website App
URLs and Routing in the Odoo 17 Website App
 
mini mental status format.docx
mini    mental       status     format.docxmini    mental       status     format.docx
mini mental status format.docx
 
18-04-UA_REPORT_MEDIALITERAСY_INDEX-DM_23-1-final-eng.pdf
18-04-UA_REPORT_MEDIALITERAСY_INDEX-DM_23-1-final-eng.pdf18-04-UA_REPORT_MEDIALITERAСY_INDEX-DM_23-1-final-eng.pdf
18-04-UA_REPORT_MEDIALITERAСY_INDEX-DM_23-1-final-eng.pdf
 

For a single sample t test, a sample of n=4 scores has SS=60. Which i.pdf

  • 1. For a single sample t test, a sample of n=4 scores has SS=60. Which is the variance for this sample? s2=15s2=20s2=30s2=60 For a single sample t test, a sample of n=4 scores has a variance of s2=64. What is the estimated standard error for the sample mean? sM=4sM=1sM=16sM=2 A sample with a mean of M=40 and a variance of s2=12 has an estimated standard error of 2 points. How many scores are in the sample? n=10n=6n=3n=12 A researcher conducts a hypothesis test using a single sample of n=20 with M=34 and s2=36 from an unknown population. What is the df value for the t statistic? df=19df=21df=35df=12 One sample of n=8 scores has a variance of s2=6 and a second sample of n=8 scores has a variance of s2=10. If the pooled variance is computed for these two samples, then the value obtained for the variance will be closer to 10 than to 6 closer to 6 than to 10 exactly halfway between 6 and 10 This cannot be determined by the information provided