
Recomendados
Recomendados
Más contenido relacionado
La actualidad más candente
La actualidad más candente (19)
Similar a Twin Cities Weekly Housing Report
Similar a Twin Cities Weekly Housing Report (20)
Último
Último (20)
Twin Cities Weekly Housing Report
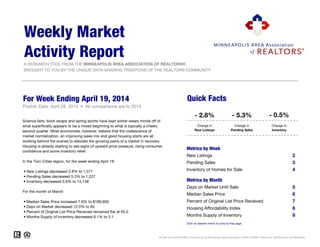
- 1. A RESEARCH TOOL FROM THE MINNEAPOLIS AREA ASSOCIATION OF REALTORS® BROUGHT TO YOU BY THE UNIQUE DATA-SHARING TRADITIONS OF THE REALTOR® COMMUNITY For Week Ending April 19, 2014 Quick Facts Publish Date: April 28, 2014 • All comparisons are to 2013 - 2.8% - 5.3% Metrics by Week New Listings 2 Pending Sales 3 Inventory of Homes for Sale 4 Metrics by Month Days on Market Until Sale 5 Median Sales Price 6 Percent of Original List Price Received 7 Housing Affordability Index 8 Months Supply of Inventory 9 All data from NorthstarMLS. Provided by the Minneapolis Area Association of REALTORS®. Powered by 10K Research and Marketing. Click on desired metric to jump to that page. Weekly Market Activity Report - 0.5% Change in New Listings Change in Pending Sales Change in Inventory Science fairs, book swaps and spring sports have kept winter-weary minds off of what superficially appears to be a mixed beginning to what is typically a cheery second quarter. Most economists, however, believe that the coalescence of market normalization, an improving sales mix and good housing starts are all working behind the scenes to alleviate the growing pains of a market in recovery. Housing is already starting to see signs of upward price pressure, rising consumer confidence and some inventory relief. In the Twin Cities region, for the week ending April 19: • New Listings decreased 2.8% to 1,571 • Pending Sales decreased 5.3% to 1,227 • Inventory decreased 0.5% to 14,148 For the month of March: • Median Sales Price increased 7.6% to $189,950 • Days on Market decreased 12.0% to 95 • Percent of Original List Price Received remained flat at 95.0 • Months Supply of Inventory decreased 6.1% to 3.1
- 2. New Listings A count of the properties that have been newly listed on the market in a given week. For the Week Ending Current Activity One Year Previous + / – 1/25/2014 914 1,037 - 11.9% 2/1/2014 933 1,124 - 17.0% 2/8/2014 1,193 1,230 - 3.0% 2/15/2014 1,158 1,197 - 3.3% 2/22/2014 1,052 1,174 - 10.4% 3/1/2014 1,247 1,424 - 12.4% 3/8/2014 1,454 1,365 + 6.5% 3/15/2014 1,464 1,476 - 0.8% 3/22/2014 1,491 1,452 + 2.7% 3/29/2014 1,600 1,351 + 18.4% 4/5/2014 1,841 1,734 + 6.2% 4/12/2014 1,924 1,605 + 19.9% 4/19/2014 1,571 1,616 - 2.8% 3-Month Total 17,842 17,785 + 0.3% All data from NorthstarMLS. Provided by the Minneapolis Area Association of REALTORS®. Powered by 10K Research and Marketing. | Click for Cover Page | 2 500 700 900 1,100 1,300 1,500 1,700 1,900 2,100 1/25/14 2/1/14 2/8/14 2/15/14 2/22/14 3/1/14 3/8/14 3/15/14 3/22/14 3/29/14 4/5/14 4/12/14 4/19/14 Last Three Months Current Activity One Year Ago 0 500 1,000 1,500 2,000 2,500 3,000 3,500 1-2006 1-2007 1-2008 1-2009 1-2010 1-2011 1-2012 1-2013 1-2014 Historical New Listings
- 3. Pending Sales A count of the properties that have offers accepted on them in a given week. For the Week Ending Current Activity One Year Previous + / – 1/25/2014 655 762 - 14.0% 2/1/2014 768 870 - 11.7% 2/8/2014 771 871 - 11.5% 2/15/2014 797 890 - 10.4% 2/22/2014 721 880 - 18.1% 3/1/2014 890 986 - 9.7% 3/8/2014 816 962 - 15.2% 3/15/2014 906 1,049 - 13.6% 3/22/2014 992 1,085 - 8.6% 3/29/2014 1,088 1,166 - 6.7% 4/5/2014 1,024 1,104 - 7.2% 4/12/2014 1,157 1,136 + 1.8% 4/19/2014 1,227 1,295 - 5.3% 3-Month Total 11,812 13,056 - 9.5% All data from NorthstarMLS. Provided by the Minneapolis Area Association of REALTORS®. Powered by 10K Research and Marketing. | Click for Cover Page | 3 450 550 650 750 850 950 1,050 1,150 1,250 1,350 1/25/14 2/1/14 2/8/14 2/15/14 2/22/14 3/1/14 3/8/14 3/15/14 3/22/14 3/29/14 4/5/14 4/12/14 4/19/14 Last Three Months Current Activity One Year Ago 200 400 600 800 1,000 1,200 1,400 1,600 1-2006 1-2007 1-2008 1-2009 1-2010 1-2011 1-2012 1-2013 1-2014 Historical Pending Sales
- 4. Inventory of Homes for Sale The number of properties available for sale in active status at the end of a given week. For the Week Ending Current Activity One Year Previous + / – 1/25/2014 12,696 13,204 - 3.8% 2/1/2014 12,617 13,202 - 4.4% 2/8/2014 12,428 13,164 - 5.6% 2/15/2014 12,535 13,261 - 5.5% 2/22/2014 12,600 13,276 - 5.1% 3/1/2014 12,579 13,303 - 5.4% 3/8/2014 12,558 13,389 - 6.2% 3/15/2014 12,870 13,597 - 5.3% 3/22/2014 13,140 13,722 - 4.2% 3/29/2014 13,315 13,817 - 3.6% 4/5/2014 13,412 13,737 - 2.4% 4/12/2014 13,834 14,077 - 1.7% 4/19/2014 14,148 14,225 - 0.5% 3-Month Avg 12,979 13,536 - 4.1% All data from NorthstarMLS. Provided by the Minneapolis Area Association of REALTORS®. Powered by 10K Research and Marketing. | Click for Cover Page | 4 12,000 12,500 13,000 13,500 14,000 14,500 1/25/14 2/1/14 2/8/14 2/15/14 2/22/14 3/1/14 3/8/14 3/15/14 3/22/14 3/29/14 4/5/14 4/12/14 4/19/14 Last Three Months Current Activity One Year Ago 10,000 15,000 20,000 25,000 30,000 35,000 40,000 1-2004 1-2005 1-2006 1-2007 1-2008 1-2009 1-2010 1-2011 1-2012 1-2013 1-2014 Historical Inventory Levels
- 5. Days on Market Until Sale Average number of days between when a property is listed and when an offer is accepted in a given month. March Month Current Activity One Year Previous + / – April 97 135 - 28.1% May 86 124 - 30.6% June 74 113 - 34.5% July 72 105 - 31.4% August 70 106 - 34.0% September 71 101 - 29.7% October 75 103 - 27.2% November 75 102 - 26.5% December 86 108 - 20.4% January 93 106 - 12.3% February 99 111 - 10.8% March 95 108 - 12.0% 12-Month Avg 81 110 - 26.4% All data from NorthstarMLS. Provided by the Minneapolis Area Association of REALTORS®. Powered by 10K Research and Marketing. | Click for Cover Page | 5 60 80 100 120 140 160 180 1-2007 1-2008 1-2009 1-2010 1-2011 1-2012 1-2013 1-2014 Historical Days on Market Until Sale 144 108 95 2012 2013 2014 - 12.0%- 25.0%
- 6. Median Sales Price Median price point for all closed sales, not accounting for seller concessions, in a given month. March Month Current Activity One Year Previous + / – April $182,475 $162,500 + 12.3% May $194,000 $169,000 + 14.8% June $210,000 $178,675 + 17.5% July $208,000 $178,087 + 16.8% August $207,950 $177,900 + 16.9% September $195,000 $174,500 + 11.7% October $195,000 $175,000 + 11.4% November $195,000 $172,000 + 13.4% December $190,000 $168,000 + 13.1% January $179,000 $160,000 + 11.9% February $182,900 $160,000 + 14.3% March $189,950 $176,500 + 7.6% 12-Month Med $195,500 $171,000 + 14.3% All data from NorthstarMLS. Provided by the Minneapolis Area Association of REALTORS®. Powered by 10K Research and Marketing | Click for Cover Page | 6 $120,000 $140,000 $160,000 $180,000 $200,000 $220,000 $240,000 1-2003 1-2004 1-2005 1-2006 1-2007 1-2008 1-2009 1-2010 1-2011 1-2012 1-2013 1-2014 Historical Median Sales Price $149,900 $176,500 $189,950 2012 2013 2014 + 7.6%+ 17.7%
- 7. Percent of Original List Price Received March Month Current Activity One Year Previous + / – April 96.0% 93.4% + 2.8% May 97.0% 94.6% + 2.5% June 97.5% 95.1% + 2.5% July 97.5% 95.0% + 2.6% August 97.0% 95.1% + 2.0% September 96.5% 94.8% + 1.8% October 95.8% 94.5% + 1.4% November 95.4% 94.2% + 1.3% December 94.7% 93.8% + 1.0% January 93.5% 93.5% 0.0% February 93.6% 93.8% - 0.2% March 95.0% 95.0% 0.0% 12-Month Avg 96.1% 94.5% + 1.7% Percentage found when dividing a property’s sales price by it's original list price, then taking the average for all properties sold in a given month, not accounting for seller concessions. All data from NorthstarMLS. Provided by the Minneapolis Area Association of REALTORS®. Powered by 10K Research and Marketing | Click for Cover Page | 7 86% 88% 90% 92% 94% 96% 98% 100% 1-2004 1-2005 1-2006 1-2007 1-2008 1-2009 1-2010 1-2011 1-2012 1-2013 1-2014 Historical Percent of Original List Price Received 92.1% 95.0% 95.0% 2012 2013 2014 0.0%+ 3.1%
- 8. Housing Affordability Index March Month Current Activity One Year Previous + / – April 228 237 - 3.8% May 212 231 - 8.2% June 189 225 - 16.0% July 192 229 - 16.2% August 188 230 - 18.3% September 201 235 - 14.5% October 201 234 - 14.1% November 204 239 - 14.6% December 209 244 - 14.3% January 215 255 - 15.7% February 212 253 - 16.2% March 207 233 - 11.2% 12-Month Avg 203 237 - 14.3% This index measures housing affordability for the region. An index of 120 means the median household income was 120% of what is necessary to qualify for the median-priced home under prevailing interest rates. A higher number means greater affordability. All data from NorthstarMLS. Provided by the Minneapolis Area Association of REALTORS®. Powered by 10K Research and Marketing. | Click for Cover Page | 8 120 140 160 180 200 220 240 260 280 1-2004 1-2005 1-2006 1-2007 1-2008 1-2009 1-2010 1-2011 1-2012 1-2013 1-2014 Historical Housing Affordability Index 254 233 207 2012 2013 2014 - 11.2%- 8.3%
- 9. Months Supply of Inventory The inventory of homes for sale at the end of a given month, divided by the average monthly pending sales from the last 12 months. March Month Current Activity One Year Previous + / – April 3.4 5.0 - 32.0% May 3.6 4.9 - 26.5% June 3.8 4.8 - 20.8% July 3.8 4.6 - 17.4% August 3.8 4.4 - 13.6% September 3.8 4.3 - 11.6% October 3.7 4.0 - 7.5% November 3.4 3.7 - 8.1% December 2.8 3.2 - 12.5% January 2.8 3.2 - 12.5% February 2.9 3.2 - 9.4% March 3.1 3.3 - 6.1% 12-Month Avg 3.4 4.0 - 15.0% All data from NorthstarMLS. Provided by the Minneapolis Area Association of REALTORS®. Powered by 10K Research and Marketing. | Click for Cover Page | 9 2 3 4 5 6 7 8 9 10 11 12 1-2004 1-2005 1-2006 1-2007 1-2008 1-2009 1-2010 1-2011 1-2012 1-2013 1-2014 Historical Months Supply of Inventory 5.0 3.3 3.1 2012 2013 2014 - 6.1%- 34.0%