SlideShare una empresa de Scribd logo
1 de 16
Descargar para leer sin conexión
February 2023 Monthly Snapshot
One-Year Change in One-Year Change in
Median Sales Price Single
Family
Median Sales Price
Condo/TIC/Coop
2
3
4
5
6
7
8
9
10
11
12
13
14
15
16
Current as of March 11, 2023. All data from the San Francisco Association of REALTORS® MLS. Report © 2023 ShowingTime.
Condo/TIC/Coop Activity Overview
Inventory of Active Listings
% of Properties Sold Over List Price
% of List Price Received
Housing Affordability Ratio
All Properties Activity Overview
New Listings
Pending Sales
Sold Listings
Median Sales Price
Average Sales Price
Days on Market Until Sale
Activity by District
Monthly Indicators
- 25.4% - 6.3% - 14.1%
One-Year Change in
In its continued effort to curb inflation, the Federal Reserve raised its benchmark
interest rate in February by a quarter-percentage point to 4.50% - 4.75%, its 8th
rate hike since March of last year, when the interest rate was nearly zero.
Mortgage interest rates have dipped slightly from their peak last fall, leading
pending sales to increase 8.1% month-to-month as of last measure, but
affordability constraints continue to limit homebuyer activity overall, with
existing-home sales declining for the twelfth consecutive month, according to
the National Association of Realtors® (NAR).
New Listings were down 40.3 percent for single family homes and 40.7 percent
for Condo/TIC/Coop properties. Pending Sales decreased 39.5 percent for
single family homes and 25.8 percent for Condo/TIC/Coop properties.
The Median Sales Price was down 25.4 percent to $1,440,000 for single family
homes and 6.3 percent to $1,150,000 for Condo/TIC/Coop properties. Months
Supply of Inventory increased 16.7 percent for single family units but remained
flat for Condo/TIC/Coop units.
With buyer demand down from peak levels, home price growth has continued
to slow nationwide, although prices remain up from a year ago. Sellers have
been increasingly cutting prices and offering sales incentives in an attempt to
attract buyers, who have continued to struggle with affordability challenges this
winter. The slight decline in mortgage rates earlier this year convinced some
buyers to come off the sidelines, but with rates ticking up again in recent weeks,
buyers are once again pulling back, causing sales activity to remain down
heading into spring.
Median Sales Price
All Property Types
Residential real estate activity in San Francisco County (Districts 1-10)
composed of single-family properties, townhomes and condominiums. Percent
changes are calculated using rounded figures.
Single Family Activity Overview
Months Supply of Inventory
For questions or more information, contact
communications@sfrealtors.com.
Single Family Activity Overview
Key metrics by report month and for year-to-date (YTD) starting from the first of the year.
Key Metrics Historical Sparkbars 2-2022 2-2023 Percent Change YTD 2022 YTD 2023 Percent Change
- 34.3%
339
196 - 32.2%
$1,407,500 - 22.7%
- 18.3%
Pending Sales 215 130 - 39.5% - 38.9%
360 220
New Listings 288 172 - 40.3% 516
Sold Listings 159 97 - 39.0% 289
Median Sales Price $1,930,000 $1,440,000 - 25.4% $1,820,000
42 + 35.5%
$1,811,204
-- --
Days on Market 22 34 + 54.5% 31
Avg. Sales Price $2,417,245 $1,803,324 - 25.4% $2,216,852
Active Listings 301 260 - 13.6% --
% of Properties Sold Over List Price 86.8% 53.6% - 38.2% 81.7%
28
49.0% - 40.0%
- 13.2%
29 + 3.6%
103.7%
% of List Price Received 121.2% 103.9% - 14.3% 119.5%
Current as of March 11, 2023. All data from the San Francisco Association of REALTORS® MLS. Report © 2023 ShowingTime. | 2
Months Supply 1.2 1.4 + 16.7% -- -- --
Affordability Ratio 27 28 + 3.7%
2-2020 2-2021 2-2022 2-2023
2-2020 2-2021 2-2022 2-2023
2-2020 2-2021 2-2022 2-2023
2-2020 2-2021 2-2022 2-2023
2-2020 2-2021 2-2022 2-2023
2-2020 2-2021 2-2022 2-2023
2-2020 2-2021 2-2022 2-2023
2-2020 2-2021 2-2022 2-2023
2-2020 2-2021 2-2022 2-2023
2-2020 2-2021 2-2022 2-2023
2-2020 2-2021 2-2022 2-2023
Condo/TIC/Coop Activity Overview
Key metrics by report month and for year-to-date (YTD) starting from the first of the year.
Key Metrics Historical Sparkbars 2-2022 2-2023 Percent Change YTD 2022 YTD 2023 Percent Change
- 34.7%
Pending Sales 287 213 - 25.8% 538 345 - 35.9%
New Listings 535 317 - 40.7% 1,007 658
Sold Listings 250 139 - 44.4% 436 242 - 44.5%
Median Sales Price $1,227,500 $1,150,000 - 6.3% $1,176,500 $1,050,000 - 10.8%
- 5.9%
71 + 42.0%
$1,280,294
-- --
Days on Market 36 59 + 63.9% 50
Avg. Sales Price $1,398,389 $1,297,461 - 7.2% $1,361,221
Active Listings 992 645 - 35.0% --
% of Properties Sold Over List Price 58.4% 28.1% - 51.9% 50.0%
51
24.4% - 51.2%
- 5.0%
44 - 13.7%
98.7%
% of List Price Received 106.1% 99.2% - 6.5% 103.9%
Current as of March 11, 2023. All data from the San Francisco Association of REALTORS® MLS. Report © 2023 ShowingTime. | 3
Months Supply 2.7 2.7 0.0% -- -- --
Affordability Ratio 49 40 - 18.4%
2-2020 2-2021 2-2022 2-2023
2-2020 2-2021 2-2022 2-2023
2-2020 2-2021 2-2022 2-2023
2-2020 2-2021 2-2022 2-2023
2-2020 2-2021 2-2022 2-2023
2-2020 2-2021 2-2022 2-2023
2-2020 2-2021 2-2022 2-2023
2-2020 2-2021 2-2022 2-2023
2-2020 2-2021 2-2022 2-2023
2-2020 2-2021 2-2022 2-2023
2-2020 2-2021 2-2022 2-2023
New Listings
New Listings
Single
Family
Year-Over-Year
Change
Condo/TIC/
Coop
Year-Over-Year
Change
Mar-2022 342 +5.6% 615 +13.9%
Apr-2022 329 -4.9% 540 -0.2%
May-2022 301 -15.4% 516 +1.2%
Jun-2022 320 -4.8% 451 -9.8%
Jul-2022 240 -21.6% 381 -16.8%
Aug-2022 238 -14.1% 307 -20.9%
Sep-2022 365 -13.7% 576 -20.2%
Oct-2022 243 -27.0% 377 -28.7%
Nov-2022 152 -11.1% 153 -42.3%
Dec-2022 73 -12.0% 79 -46.3%
Jan-2023 167 -26.8% 341 -27.8%
Feb-2023 172 -40.3% 317 -40.7%
12-Month Avg 245 -15.2% 388 -17.0%
Historical New Listings by Month
Current as of March 11, 2023. All data from the San Francisco Association of REALTORS® MLS. Report © 2023 ShowingTime. | 4
A count of the properties that have been newly listed on the market in a given month.
251
503
288
535
172
317
Single Family Condo/TIC/Coop
February
0
200
400
600
800
1-2005 1-2006 1-2007 1-2008 1-2009 1-2010 1-2011 1-2012 1-2013 1-2014 1-2015 1-2016 1-2017 1-2018 1-2019 1-2020 1-2021 1-2022 1-2023
Single Family Condo/TIC/Coop
504
1,041
516
1,007
339
658
Single Family Condo/TIC/Coop
Year to Date
2021 2022 2023
- 40.7%
+ 6.4%
- 40.3%
+ 14.7% - 3.3%
- 34.3%
+ 2.4% - 34.7%
2021 2022 2023 2021 2022 2023 2021 2022 2023
- 7.0% + 6.3% + 39.2%
+ 22.1%
Pending Sales
Pending Sales
Single
Family
Year-Over-Year
Change
Condo/TIC/
Coop
Year-Over-Year
Change
Mar-2022 287 -0.7% 437 -7.8%
Apr-2022 269 -5.9% 343 -28.5%
May-2022 249 -18.9% 332 -28.3%
Jun-2022 197 -28.1% 260 -33.0%
Jul-2022 182 -29.7% 222 -39.0%
Aug-2022 180 -20.4% 232 -26.6%
Sep-2022 189 -42.6% 213 -36.8%
Oct-2022 196 -28.2% 224 -44.7%
Nov-2022 165 -36.3% 161 -55.3%
Dec-2022 116 -10.1% 125 -44.7%
Jan-2023 90 -37.9% 132 -47.4%
Feb-2023 130 -39.5% 213 -25.8%
12-Month Avg 188 -24.8% 241 -33.5%
Historical Pending Sales by Month
Current as of March 11, 2023. All data from the San Francisco Association of REALTORS® MLS. Report © 2023 ShowingTime. | 5
A count of the properties on which offers have been accepted in a given month.
226
381
215
287
130
213
Single Family Condo/TIC/Coop
February
0
100
200
300
400
500
600
1-2005 1-2006 1-2007 1-2008 1-2009 1-2010 1-2011 1-2012 1-2013 1-2014 1-2015 1-2016 1-2017 1-2018 1-2019 1-2020 1-2021 1-2022 1-2023
Single Family Condo/TIC/Coop
395
673
360
538
220
345
Single Family Condo/TIC/Coop
Year to Date
2021 2022 2023
- 25.8%
- 24.7%
- 39.5%
- 4.9% - 20.1%
- 38.9%
- 8.9% - 35.9%
2021 2022 2023 2021 2022 2023 2021 2022 2023
+ 52.7% + 48.5% + 73.5%
+ 67.8%
Sold Listings
Sold Listings
Single
Family
Year-Over-Year
Change
Condo/TIC/
Coop
Year-Over-Year
Change
Mar-2022 257 -5.2% 394 -13.8%
Apr-2022 256 -11.4% 381 -17.5%
May-2022 282 +6.0% 368 -17.1%
Jun-2022 249 -23.6% 309 -34.7%
Jul-2022 183 -28.2% 235 -36.3%
Aug-2022 189 -26.2% 237 -31.9%
Sep-2022 180 -26.5% 210 -28.1%
Oct-2022 192 -38.1% 224 -38.5%
Nov-2022 186 -36.5% 206 -51.5%
Dec-2022 153 -29.2% 145 -55.4%
Jan-2023 99 -23.8% 103 -44.6%
Feb-2023 97 -39.0% 139 -44.4%
12-Month Avg 194 -23.0% 246 -32.9%
Historical Sold Listings by Month
Current as of March 11, 2023. All data from the San Francisco Association of REALTORS® MLS. Report © 2023 ShowingTime. | 6
A count of the actual sales that closed in a given month.
163
278
159
250
97
139
Single Family Condo/TIC/Coop
February
0
100
200
300
400
500
1-2005 1-2006 1-2007 1-2008 1-2009 1-2010 1-2011 1-2012 1-2013 1-2014 1-2015 1-2016 1-2017 1-2018 1-2019 1-2020 1-2021 1-2022 1-2023
Single Family Condo/TIC/Coop
324
548
289
436
196
242
Single Family Condo/TIC/Coop
Year to Date
2021 2022 2023
- 44.4%
- 10.1%
- 39.0%
- 2.5% - 20.4%
- 32.2%
- 10.8% - 44.5%
2021 2022 2023 2021 2022 2023 2021 2022 2023
+ 24.4% + 35.0% + 66.6%
+ 56.2%
Median Sales Price
Median Sales Price
Single
Family
Year-Over-Year
Change
Condo/TIC/
Coop
Year-Over-Year
Change
Mar-2022 $2,000,000 +15.9% $1,206,750 -1.2%
Apr-2022 $2,050,000 +13.9% $1,365,000 +13.8%
May-2022 $2,007,500 +6.4% $1,215,000 -1.1%
Jun-2022 $1,880,000 -3.1% $1,240,000 -0.8%
Jul-2022 $1,670,000 -9.7% $1,197,000 -1.1%
Aug-2022 $1,610,000 -12.9% $1,000,000 -13.0%
Sep-2022 $1,650,000 -5.7% $1,160,000 -3.3%
Oct-2022 $1,670,000 -7.5% $1,200,000 -3.8%
Nov-2022 $1,500,000 -20.2% $1,136,500 -9.8%
Dec-2022 $1,550,000 -8.3% $950,000 -26.9%
Jan-2023 $1,370,000 -16.0% $985,800 -7.9%
Feb-2023 $1,440,000 -25.4% $1,150,000 -6.3%
12-Month Avg* $1,750,000 -4.1% $1,196,000 -2.4%
Historical Median Sales Price by Month
* Median Sales Price for all properties from March 2022 through February 2023. This is not the
average of the individual figures above.
Current as of March 11, 2023. All data from the San Francisco Association of REALTORS® MLS. Report © 2023 ShowingTime. | 7
Point at which half of the sales sold for more and half sold for less, not accounting for seller concessions, in a given month.
$1,650,000
$1,196,500
$1,930,000
$1,227,500
$1,440,000
$1,150,000
Single Family Condo/TIC/Coop
February
$500,000
$750,000
$1,000,000
$1,250,000
$1,500,000
$1,750,000
$2,000,000
$2,250,000
1-2005 1-2006 1-2007 1-2008 1-2009 1-2010 1-2011 1-2012 1-2013 1-2014 1-2015 1-2016 1-2017 1-2018 1-2019 1-2020 1-2021 1-2022 1-2023
Single Family Condo/TIC/Coop
$1,600,000
$1,135,000
$1,820,000
$1,176,500
$1,407,500
$1,050,000
Single Family Condo/TIC/Coop
Year to Date
2021 2022 2023
- 6.3%
+ 2.6%
- 25.4%
+ 17.0% + 3.7%
- 22.7%
+ 13.8% - 10.8%
2021 2022 2023 2021 2022 2023 2021 2022 2023
+ 2.5% + 6.5% - 4.6%
- 5.0%
Average Sales Price
Average Sales
Price
Single
Family
Year-Over-Year
Change
Condo/TIC/
Coop
Year-Over-Year
Change
Mar-2022 $2,534,210 +14.6% $1,411,860 +3.1%
Apr-2022 $2,506,193 +3.1% $1,473,383 +9.4%
May-2022 $2,411,895 -2.7% $1,403,091 +1.7%
Jun-2022 $2,355,940 -5.8% $1,366,119 -1.5%
Jul-2022 $2,061,331 -10.1% $1,466,757 +8.1%
Aug-2022 $1,950,088 -8.4% $1,174,880 -17.6%
Sep-2022 $1,881,502 -13.1% $1,343,336 +0.8%
Oct-2022 $2,211,462 -6.3% $1,418,171 -3.0%
Nov-2022 $1,895,086 -19.4% $1,399,284 -9.1%
Dec-2022 $1,874,472 -20.8% $1,104,823 -25.8%
Jan-2023 $1,818,925 -7.8% $1,257,127 -4.1%
Feb-2023 $1,803,324 -25.4% $1,297,461 -7.2%
12-Month Avg* $2,179,509 -6.2% $1,368,097 -2.5%
Historical Average Sales Price by Month
* Avg. Sales Price for all properties from March 2022 through February 2023. This is not the
average of the individual figures above.
Current as of March 11, 2023. All data from the San Francisco Association of REALTORS® MLS. Report © 2023 ShowingTime. | 8
Average sales price for all closed sales, not accounting for seller concessions, in a given month.
$2,257,454
$1,344,643
$2,417,245
$1,398,389
$1,803,324
$1,297,461
Single Family Condo/TIC/Coop
February
$500,000
$1,000,000
$1,500,000
$2,000,000
$2,500,000
$3,000,000
1-2005 1-2006 1-2007 1-2008 1-2009 1-2010 1-2011 1-2012 1-2013 1-2014 1-2015 1-2016 1-2017 1-2018 1-2019 1-2020 1-2021 1-2022 1-2023
Single Family Condo/TIC/Coop
$2,102,627
$1,278,817
$2,216,852
$1,361,221
$1,811,204
$1,280,294
Single Family Condo/TIC/Coop
Year to Date
2021 2022 2023
- 7.2%
+ 4.0%
- 25.4%
+ 7.1% + 6.4%
- 18.3%
+ 5.4% - 5.9%
2021 2022 2023 2021 2022 2023 2021 2022 2023
+ 18.2% + 4.7% - 2.6%
- 0.5%
Days on Market Until Sale
Days on Market
Until Sale
Single
Family
Year-Over-Year
Change
Condo/TIC/
Coop
Year-Over-Year
Change
Mar-2022 16 -38.5% 34 -29.2%
Apr-2022 16 -20.0% 32 -31.9%
May-2022 21 +5.0% 37 -5.1%
Jun-2022 17 -10.5% 39 +5.4%
Jul-2022 21 +10.5% 49 +16.7%
Aug-2022 26 +4.0% 50 +16.3%
Sep-2022 28 +21.7% 58 +45.0%
Oct-2022 28 +40.0% 43 +19.4%
Nov-2022 35 +66.7% 51 +24.4%
Dec-2022 38 +22.6% 74 +57.4%
Jan-2023 50 +22.0% 87 +27.9%
Feb-2023 34 +54.5% 59 +63.9%
12-Month Avg* 25 +8.2% 46 +6.3%
Historical Days on Market Until Sale by Month
* Days on Market for all properties from March 2022 through February 2023. This is not the
average of the individual figures above.
Current as of March 11, 2023. All data from the San Francisco Association of REALTORS® MLS. Report © 2023 ShowingTime. | 9
Average number of days between when a property is listed and when an offer is accepted in a given month.
34
66
22
36
34
59
Single Family Condo/TIC/Coop
February
0
20
40
60
80
100
120
1-2005 1-2006 1-2007 1-2008 1-2009 1-2010 1-2011 1-2012 1-2013 1-2014 1-2015 1-2016 1-2017 1-2018 1-2019 1-2020 1-2021 1-2022 1-2023
Single Family Condo/TIC/Coop
37
70
31
50
42
71
Single Family Condo/TIC/Coop
Year to Date
2021 2022 2023
+ 63.9%
- 45.5%
+ 54.5%
- 35.3% - 28.6%
+ 35.5%
- 16.2% + 42.0%
2021 2022 2023 2021 2022 2023 2021 2022 2023
+ 21.4% + 12.1% + 42.9%
+ 106.3%
Inventory of Active Listings
Inventory of Active
Listings
Single
Family
Year-Over-Year
Change
Condo/TIC/
Coop
Year-Over-Year
Change
Mar-2022 318 -13.4% 1,048 -8.8%
Apr-2022 337 -14.2% 1,109 -0.3%
May-2022 331 -18.5% 1,119 +4.6%
Jun-2022 376 -9.6% 1,101 +3.9%
Jul-2022 364 -14.4% 1,018 -4.1%
Aug-2022 346 -19.5% 890 -13.2%
Sep-2022 476 +0.6% 1,101 -15.4%
Oct-2022 465 -4.7% 1,087 -16.6%
Nov-2022 366 +0.8% 853 -22.0%
Dec-2022 205 0.0% 497 -26.5%
Jan-2023 244 -6.9% 610 -26.6%
Feb-2023 260 -13.6% 645 -35.0%
12-Month Avg* 341 -9.7% 923 -12.6%
Historical Inventory of Active Listings by Month
* Active Listings for all properties from March 2022 through February 2023. This is not the
average of the individual figures above.
Current as of March 11, 2023. All data from the San Francisco Association of REALTORS® MLS. Report © 2023 ShowingTime. | 10
The number of properties available for sale in active status at the end of a given month.
381
1,237
301
992
260
645
Single Family Condo/TIC/Coop
February
0
500
1,000
1,500
2,000
2,500
1-2005 1-2006 1-2007 1-2008 1-2009 1-2010 1-2011 1-2012 1-2013 1-2014 1-2015 1-2016 1-2017 1-2018 1-2019 1-2020 1-2021 1-2022 1-2023
Single Family Condo/TIC/Coop
2021 2022 2023
- 35.0%
- 19.8%
- 13.6%
- 21.0%
2021 2022 2023
- 3.3% + 69.9%
% of Properties Sold Over List Price
% of Properties
Sold Over List Price
Single
Family
Year-Over-Year
Change
Condo/TIC/
Coop
Year-Over-Year
Change
Mar-2022 86.4% +17.1% 58.1% +35.4%
Apr-2022 88.7% +16.6% 63.0% +39.4%
May-2022 86.9% +9.0% 55.3% +3.6%
Jun-2022 86.3% +5.0% 57.3% +5.5%
Jul-2022 78.1% -6.5% 39.6% -28.8%
Aug-2022 75.7% -10.3% 37.1% -32.1%
Sep-2022 67.2% -20.5% 31.0% -43.1%
Oct-2022 64.1% -24.1% 37.5% -38.2%
Nov-2022 57.5% -27.7% 30.6% -45.2%
Dec-2022 48.4% -38.5% 15.9% -65.8%
Jan-2023 44.4% -41.1% 19.4% -49.9%
Feb-2023 53.6% -38.2% 28.1% -51.9%
12-Month Avg 73.9% -8.6% 44.9% -13.5%
Historical % of Properties Sold Over List Price by Month
* % of Properties Sold Over List Price for all properties from March 2022 through February 2023.
This is not the average of the individual figures above.
Current as of March 11, 2023. All data from the San Francisco Association of REALTORS® MLS. Report © 2023 ShowingTime. | 11
Percentage found when dividing the number of properties sold by properties sold over its original list price, not accounting for seller
concessions.
68.1%
35.3%
86.8%
58.4%
53.6%
28.1%
Single Family Condo/TIC/Coop
February
0.0%
20.0%
40.0%
60.0%
80.0%
100.0%
1-2005 1-2006 1-2007 1-2008 1-2009 1-2010 1-2011 1-2012 1-2013 1-2014 1-2015 1-2016 1-2017 1-2018 1-2019 1-2020 1-2021 1-2022 1-2023
Single Family Condo/TIC/Coop
63.0%
28.6%
81.7%
50.0%
49.0%
24.4%
Single Family Condo/TIC/Coop
Year to Date
2021 2022 2023
- 51.9%
+ 65.4%
- 38.2%
+ 27.5% + 74.8%
- 40.0%
+ 29.7% - 51.2%
2021 2022 2023 2021 2022 2023 2021 2022 2023
- 7.1% - 8.0% - 41.9%
- 44.4%
% of List Price Received
% of List Price
Received
Single
Family
Year-Over-Year
Change
Condo/TIC/
Coop
Year-Over-Year
Change
Mar-2022 121.9% +8.7% 106.4% +3.9%
Apr-2022 123.1% +8.2% 107.2% +3.4%
May-2022 119.6% +2.4% 105.9% +0.7%
Jun-2022 116.8% +0.5% 105.3% 0.0%
Jul-2022 110.9% -6.4% 101.5% -3.1%
Aug-2022 108.4% -6.6% 100.7% -3.5%
Sep-2022 108.5% -6.7% 100.6% -4.2%
Oct-2022 107.1% -8.5% 100.4% -4.8%
Nov-2022 104.9% -8.6% 99.2% -5.2%
Dec-2022 102.8% -10.1% 98.1% -5.2%
Jan-2023 103.4% -11.9% 98.0% -3.1%
Feb-2023 103.9% -14.3% 99.2% -6.5%
12-Month Avg* 112.8% -2.7% 103.1% -1.2%
Historical % of List Price Received by Month
* % of List Price Received for all properties from March 2022 through February 2023. This is not
the average of the individual figures above.
Current as of March 11, 2023. All data from the San Francisco Association of REALTORS® MLS. Report © 2023 ShowingTime. | 12
Percentage found when dividing a property’s sales price by its most recent list price, then taking the average for all properties sold in a given
month, not accounting for seller concessions.
109.7%
100.7%
121.2%
106.1%
103.9%
99.2%
Single Family Condo/TIC/Coop
February
107.5%
99.7%
119.5%
103.9%
103.7%
98.7%
Single Family Condo/TIC/Coop
Year to Date
90.0%
100.0%
110.0%
120.0%
130.0%
1-2005 1-2006 1-2007 1-2008 1-2009 1-2010 1-2011 1-2012 1-2013 1-2014 1-2015 1-2016 1-2017 1-2018 1-2019 1-2020 1-2021 1-2022 1-2023
Single Family Condo/TIC/Coop
2021 2022 2023
- 6.5%
+ 5.4%
- 14.3%
+ 10.5%
2021 2022 2023
- 1.7% - 4.3%
2021 2022 2023
- 5.0%
+ 4.2%
- 13.2%
+ 11.2%
2021 2022 2023
- 1.8% - 3.2%
Housing Affordability Ratio
Housing
Affordability Ratio
Single
Family
Year-Over-Year
Change
Condo/TIC/
Coop
Year-Over-Year
Change
Mar-2022 24 -25.0% 45 -13.5%
Apr-2022 21 -32.3% 37 -32.7%
May-2022 22 -26.7% 42 -22.2%
Jun-2022 23 -17.9% 40 -23.1%
Jul-2022 27 -10.0% 43 -20.4%
Aug-2022 28 -6.7% 51 -10.5%
Sep-2022 24 -25.0% 39 -29.1%
Oct-2022 23 -25.8% 37 -30.2%
Nov-2022 27 -10.0% 39 -27.8%
Dec-2022 27 -15.6% 49 0.0%
Jan-2023 31 -3.1% 48 -15.8%
Feb-2023 28 +3.7% 40 -18.4%
12-Month Avg* 25 -7.8% 42 -25.2%
Historical Housing Affordability Ratio by Month
* Affordability Ratio for all properties from March 2022 through February 2023. This is not the
average of the individual figures above.
Current as of March 11, 2023. All data from the San Francisco Association of REALTORS® MLS. Report © 2023 ShowingTime. | 13
This index measures housing affordability for the region. For example, an index of 120 means the median household income is 120% of what is
necessary to qualify for the median-priced home under prevailing interest rates. A higher number means greater affordability.
33
53
27
49
28
40
Single Family Condo/TIC/Coop
February
20
40
60
80
100
1-2005 1-2006 1-2007 1-2008 1-2009 1-2010 1-2011 1-2012 1-2013 1-2014 1-2015 1-2016 1-2017 1-2018 1-2019 1-2020 1-2021 1-2022 1-2023
Single Family Condo/TIC/Coop
2021 2022 2023
- 18.4%
- 7.5%
+ 3.7%
- 18.2%
2021 2022 2023
- 2.9% + 3.9%
34
56
28
51
29
44
Single Family Condo/TIC/Coop
Year to Date
2021 2022 2023
- 13.7%
- 8.9%
+ 3.6%
- 17.6%
2021 2022 2023
- 5.6% + 3.7%
Months Supply of Inventory
Months Supply of
Inventory
Single
Family
Year-Over-Year
Change
Condo/TIC/
Coop
Year-Over-Year
Change
Mar-2022 1.3 -18.8% 2.9 -27.5%
Apr-2022 1.4 -12.5% 3.2 -8.6%
May-2022 1.4 -12.5% 3.3 +6.5%
Jun-2022 1.6 0.0% 3.4 +13.3%
Jul-2022 1.6 0.0% 3.2 +10.3%
Aug-2022 1.5 -6.3% 2.9 +3.6%
Sep-2022 2.2 +22.2% 3.7 +5.7%
Oct-2022 2.2 +15.8% 3.9 +11.4%
Nov-2022 1.8 +28.6% 3.2 +10.3%
Dec-2022 1.0 +25.0% 1.9 +5.6%
Jan-2023 1.3 +30.0% 2.5 +13.6%
Feb-2023 1.4 +16.7% 2.7 0.0%
12-Month Avg* 1.6 +5.2% 3.1 +2.3%
Historical Months Supply of Inventory by Month
* Months Supply for all properties from March 2022 through February 2023. This is not the
average of the individual figures above.
Current as of March 11, 2023. All data from the San Francisco Association of REALTORS® MLS. Report © 2023 ShowingTime. | 14
The inventory of homes for sale at the end of a given month, divided by the average monthly pending sales from the last 12 months.
1.7
4.7
1.2
2.7
1.4
2.7
Single Family Condo/TIC/Coop
February
0.0
2.0
4.0
6.0
8.0
10.0
12.0
1-2005 1-2006 1-2007 1-2008 1-2009 1-2010 1-2011 1-2012 1-2013 1-2014 1-2015 1-2016 1-2017 1-2018 1-2019 1-2020 1-2021 1-2022 1-2023
Single Family Condo/TIC/Coop
2021 2022 2023
0.0%
- 42.6%
+ 16.7%
- 29.4%
2021 2022 2023
- 10.5% + 56.7%
All Properties Activity Overview
Key metrics by report month and for year-to-date (YTD) starting from the first of the year.
Key Metrics Historical Sparkbars 2-2022 2-2023 Percent Change YTD 2022 YTD 2023 Percent Change
- 34.0%
Pending Sales 508 348 - 31.5% 908 573 - 36.9%
New Listings 831 499 - 40.0% 1,535 1,013
Sold Listings 412 237 - 42.5% 734 441 - 39.9%
Median Sales Price $1,457,500 $1,252,000 - 14.1% $1,406,500 $1,250,000 - 11.1%
- 10.8%
58 + 38.1%
$1,513,293
-- --
Days on Market 31 49 + 58.1% 42
Avg. Sales Price $1,790,022 $1,502,825 - 16.0% $1,697,363
Active Listings 1,321 932 - 29.4% --
% of Properties Sold Over List Price 69.4% 38.8% - 44.1% 62.5%
36
35.6% - 43.0%
- 8.4%
31 - 13.9%
100.9%
% of List Price Received 111.9% 101.1% - 9.7% 110.1%
Current as of March 11, 2023. All data from the San Francisco Association of REALTORS® MLS. Report © 2023 ShowingTime. | 15
Months Supply 2.1 2.1 0.0% -- -- --
Affordability Ratio 34 31 - 8.8%
2-2020 2-2021 2-2022 2-2023
2-2020 2-2021 2-2022 2-2023
2-2020 2-2021 2-2022 2-2023
2-2020 2-2021 2-2022 2-2023
2-2020 2-2021 2-2022 2-2023
2-2020 2-2021 2-2022 2-2023
2-2020 2-2021 2-2022 2-2023
2-2020 2-2021 2-2022 2-2023
2-2020 2-2021 2-2022 2-2023
2-2020 2-2021 2-2022 2-2023
2-2020 2-2021 2-2022 2-2023
Activity by District
SF District 1: Northwest (Sea Cliff, Lake, Jordan Park / Laurel Heights, Outer Richmond, Central Richmond, Inner Richmond, Lone Mountain)
SF District 2: Central West (Outer Sunset, Central Sunset, Inner Sunset, Outer Parkside, Parkside, Inner Parkside, Golden Gate Heights)
SF District 3: Southwest (Pine Lake Park, Lake Shore, Merced Manor, Stonestown, Lakeside, Merced Heights, Ingleside, Ingleside Heights, Oceanview)
SF District 4: Twin Peaks W (Forest Hill (& Ext), W Portal, St Francis Wd, Balboa Terr, Mt Dav Manor, Ingleside Terr, Monterey Hts, Wstwd Pk & H'lnds, Shrwd Fst, Miraloma Pk, Dmnd Hts, Mdtwn Terr)
SF District 5: Central (Haight Ashbury, Cole Vly / Prnssus Hts, Clarndn Hts, Corona Hts, Twin Pks, Glen Pk, Noe Vly, Eureka Vly / Dolores Hts, Mission Dolores, Duboce Trngl, Buena Vista / Ashbury Hts)
SF District 6: Central North (Lower Pacific Heights, Anza Vista, Western Addition, North Panhandle, Alamo Square, Hayes Valley)
SF District 7: North (Marina, Cow Hollow, Presidio Heights, Pacific Heights)
SF District 8: Northeast (North Waterfront, North Beach, Russian Hill, Telegraph Hill, Nob Hill, Financial District / Barbary Coast, Downtown, Van Ness / Civic Center, Tenderloin)
SF District 9: Central East (Yerba Buena, South Beach, South of Market, Mission Bay, Inner Mission, Potrero Hill, Central Waterfront / Dogpatch, Bernal Heights)
SF District 10: Southeast (Outer Mission, Mission Terr, Excelsior, Portola, Bayview, Silver Terr, Hunters Pt, Candlestick Pt, Bayview Hts, Little Hollywood, Visitation Vly, Crocker Amazon)
2-2022 2-2023 + / – 2-2022 2-2023 + / – 2-2022 2-2023 + / – 2-2022 2-2023 + / – 2-2022 2-2023 + / –
Single Family
1 SF District 1 30 22 -26.7% 15 1 -93.3% $2,505,000 $3,900,000 +55.7% 32 71 +121.9% 1.5 1.4 -6.7%
2 SF District 2 35 30 -14.3% 34 16 -52.9% $1,840,000 $1,627,000 -11.6% 20 23 +15.0% 0.8 0.8 0.0%
3 SF District 3 20 18 -10.0% 10 9 -10.0% $1,482,500 $1,205,000 -18.7% 22 25 +13.6% 1.2 1.4 +16.7%
4 SF District 4 22 25 +13.6% 24 14 -41.7% $2,650,000 $1,495,000 -43.6% 24 34 +41.7% 0.6 1.0 +66.7%
5 SF District 5 38 30 -21.1% 27 17 -37.0% $2,500,000 $2,620,000 +4.8% 21 32 +52.4% 1.0 1.1 +10.0%
6 SF District 6 9 5 -44.4% 2 1 -50.0% $1,425,000 $1,350,000 -5.3% 8 20 +150.0% 1.9 1.8 -5.3%
7 SF District 7 31 35 +12.9% 6 2 -66.7% $4,706,250 $7,097,500 +50.8% 37 35 -5.4% 2.4 4.9 +104.2%
8 SF District 8 21 10 -52.4% 1 0 -100.0% $815,000 $0 -100.0% 10 0 -100.0% 7.5 3.2 -57.3%
9 SF District 9 38 26 -31.6% 11 15 +36.4% $2,210,000 $1,650,000 -25.3% 24 45 +87.5% 1.4 1.3 -7.1%
10 SF District 10 57 59 +3.5% 29 22 -24.1% $1,360,000 $1,015,000 -25.4% 16 39 +143.8% 1.3 1.6 +23.1%
Condo/TIC/Coop
1 SF District 1 34 23 -32.4% 10 9 -10.0% $1,280,000 $1,395,000 +9.0% 19 54 +184.2% 1.9 1.7 -10.5%
2 SF District 2 14 15 +7.1% 1 7 +600.0% $1,250,000 $1,050,000 -16.0% 0 65 -- 2.6 4.1 +57.7%
3 SF District 3 4 5 +25.0% 2 3 +50.0% $621,500 $768,800 +23.7% 43 22 -48.8% 1.0 1.7 +70.0%
4 SF District 4 17 9 -47.1% 6 2 -66.7% $870,000 $945,000 +8.6% 26 9 -65.4% 3.3 2.3 -30.3%
5 SF District 5 73 75 +2.7% 38 21 -44.7% $1,482,500 $1,245,000 -16.0% 20 47 +135.0% 1.4 1.7 +21.4%
6 SF District 6 88 54 -38.6% 30 16 -46.7% $1,327,500 $1,335,000 +0.6% 33 34 +3.0% 2.3 2.0 -13.0%
7 SF District 7 68 50 -26.5% 23 15 -34.8% $1,495,000 $1,600,000 +7.0% 36 24 -33.3% 1.7 1.9 +11.8%
8 SF District 8 205 137 -33.2% 42 22 -47.6% $1,050,000 $920,000 -12.4% 43 88 +104.7% 3.3 3.4 +3.0%
9 SF District 9 443 256 -42.2% 91 41 -54.9% $1,173,000 $1,000,000 -14.7% 44 79 +79.5% 3.5 3.4 -2.9%
10 SF District 10 46 21 -54.3% 7 3 -57.1% $915,000 $900,000 -1.6% 30 47 +56.7% 5.7 3.7 -35.1%
Key metrics by report month for the districts of San Francisco.
Current as of March 11, 2023. All data from the San Francisco Association of REALTORS® MLS. Report © 2023 ShowingTime. | 16
Active Listings Sold Listings Median Sales Price Days on Market Months Supply

Más contenido relacionado

Similar a SF Housing Snapshot: Prices Down 25-6% YoY in Feb '23

San Francisco November 2023 Market Report
San Francisco November 2023 Market ReportSan Francisco November 2023 Market Report
San Francisco November 2023 Market ReportRonny Budiutama
 
San Francisco Market Report May 2022.
San Francisco Market Report May 2022.San Francisco Market Report May 2022.
San Francisco Market Report May 2022.Ronny Budiutama
 
San Francisco Market Report August 2022.pdf
San Francisco Market Report August 2022.pdfSan Francisco Market Report August 2022.pdf
San Francisco Market Report August 2022.pdfRonny Budiutama
 
San Francisco December 2023 Market Report
San Francisco December 2023 Market ReportSan Francisco December 2023 Market Report
San Francisco December 2023 Market ReportRonny Budiutama
 
San Francisco Market Report July 2022.pdf
San Francisco Market Report July 2022.pdfSan Francisco Market Report July 2022.pdf
San Francisco Market Report July 2022.pdfRonny Budiutama
 
San Francisco Market Report June 2022.pdf
San Francisco Market Report June 2022.pdfSan Francisco Market Report June 2022.pdf
San Francisco Market Report June 2022.pdfRonny Budiutama
 
San Francisco Market Report July 2023.pdf
San Francisco Market Report July 2023.pdfSan Francisco Market Report July 2023.pdf
San Francisco Market Report July 2023.pdfRonny Budiutama
 
San Francisco Market Report October 2022.pdf
San Francisco Market Report October 2022.pdfSan Francisco Market Report October 2022.pdf
San Francisco Market Report October 2022.pdfRonny Budiutama
 
San Francisco Market Report April 2022.pdf
San Francisco Market Report April 2022.pdfSan Francisco Market Report April 2022.pdf
San Francisco Market Report April 2022.pdfRonny Budiutama
 
San Francisco Market Report September 2022.pdf
San Francisco Market Report September 2022.pdfSan Francisco Market Report September 2022.pdf
San Francisco Market Report September 2022.pdfRonny Budiutama
 
San Francisco Market Report January 2022
San Francisco Market Report January 2022San Francisco Market Report January 2022
San Francisco Market Report January 2022Ronny Budiutama
 
San Francisco Market Report November 2022.pdf
San Francisco Market Report November 2022.pdfSan Francisco Market Report November 2022.pdf
San Francisco Market Report November 2022.pdfRonny Budiutama
 
San Francisco Market Report December 2021
San Francisco Market Report December 2021San Francisco Market Report December 2021
San Francisco Market Report December 2021Ronny Budiutama
 
San Francisco January 2024 Market Report
San Francisco January 2024 Market ReportSan Francisco January 2024 Market Report
San Francisco January 2024 Market ReportRonny Budiutama
 
San Francisco market focus report December 2019
San Francisco market focus report December 2019San Francisco market focus report December 2019
San Francisco market focus report December 2019Ronny Budiutama
 
San Francisco Market Report August 2021
San Francisco Market Report August 2021San Francisco Market Report August 2021
San Francisco Market Report August 2021Ronny Budiutama
 
San Francisco Market Report February 2021
San Francisco Market Report February 2021San Francisco Market Report February 2021
San Francisco Market Report February 2021Ronny Budiutama
 
San Francisco market report April 2020
San Francisco market report April 2020San Francisco market report April 2020
San Francisco market report April 2020Ronny Budiutama
 
San Francisco Market Report September 2021
San Francisco Market Report September 2021San Francisco Market Report September 2021
San Francisco Market Report September 2021Ronny Budiutama
 
San Francisco Market Report For July 2021
San Francisco Market Report For July 2021San Francisco Market Report For July 2021
San Francisco Market Report For July 2021Ronny Budiutama
 

Similar a SF Housing Snapshot: Prices Down 25-6% YoY in Feb '23 (20)

San Francisco November 2023 Market Report
San Francisco November 2023 Market ReportSan Francisco November 2023 Market Report
San Francisco November 2023 Market Report
 
San Francisco Market Report May 2022.
San Francisco Market Report May 2022.San Francisco Market Report May 2022.
San Francisco Market Report May 2022.
 
San Francisco Market Report August 2022.pdf
San Francisco Market Report August 2022.pdfSan Francisco Market Report August 2022.pdf
San Francisco Market Report August 2022.pdf
 
San Francisco December 2023 Market Report
San Francisco December 2023 Market ReportSan Francisco December 2023 Market Report
San Francisco December 2023 Market Report
 
San Francisco Market Report July 2022.pdf
San Francisco Market Report July 2022.pdfSan Francisco Market Report July 2022.pdf
San Francisco Market Report July 2022.pdf
 
San Francisco Market Report June 2022.pdf
San Francisco Market Report June 2022.pdfSan Francisco Market Report June 2022.pdf
San Francisco Market Report June 2022.pdf
 
San Francisco Market Report July 2023.pdf
San Francisco Market Report July 2023.pdfSan Francisco Market Report July 2023.pdf
San Francisco Market Report July 2023.pdf
 
San Francisco Market Report October 2022.pdf
San Francisco Market Report October 2022.pdfSan Francisco Market Report October 2022.pdf
San Francisco Market Report October 2022.pdf
 
San Francisco Market Report April 2022.pdf
San Francisco Market Report April 2022.pdfSan Francisco Market Report April 2022.pdf
San Francisco Market Report April 2022.pdf
 
San Francisco Market Report September 2022.pdf
San Francisco Market Report September 2022.pdfSan Francisco Market Report September 2022.pdf
San Francisco Market Report September 2022.pdf
 
San Francisco Market Report January 2022
San Francisco Market Report January 2022San Francisco Market Report January 2022
San Francisco Market Report January 2022
 
San Francisco Market Report November 2022.pdf
San Francisco Market Report November 2022.pdfSan Francisco Market Report November 2022.pdf
San Francisco Market Report November 2022.pdf
 
San Francisco Market Report December 2021
San Francisco Market Report December 2021San Francisco Market Report December 2021
San Francisco Market Report December 2021
 
San Francisco January 2024 Market Report
San Francisco January 2024 Market ReportSan Francisco January 2024 Market Report
San Francisco January 2024 Market Report
 
San Francisco market focus report December 2019
San Francisco market focus report December 2019San Francisco market focus report December 2019
San Francisco market focus report December 2019
 
San Francisco Market Report August 2021
San Francisco Market Report August 2021San Francisco Market Report August 2021
San Francisco Market Report August 2021
 
San Francisco Market Report February 2021
San Francisco Market Report February 2021San Francisco Market Report February 2021
San Francisco Market Report February 2021
 
San Francisco market report April 2020
San Francisco market report April 2020San Francisco market report April 2020
San Francisco market report April 2020
 
San Francisco Market Report September 2021
San Francisco Market Report September 2021San Francisco Market Report September 2021
San Francisco Market Report September 2021
 
San Francisco Market Report For July 2021
San Francisco Market Report For July 2021San Francisco Market Report For July 2021
San Francisco Market Report For July 2021
 

Último

8 Key Elements for Comfortable Farmland Living
8 Key Elements for Comfortable Farmland Living 8 Key Elements for Comfortable Farmland Living
8 Key Elements for Comfortable Farmland Living Farmland Bazaar
 
DLF Plots Sriperumbudur in Chennai E Brochure Pdf
DLF Plots Sriperumbudur in Chennai E Brochure PdfDLF Plots Sriperumbudur in Chennai E Brochure Pdf
DLF Plots Sriperumbudur in Chennai E Brochure Pdfashiyadav24
 
Ajmera Prive at Juhu, Mumbai E-Brochure.pdf
Ajmera Prive at Juhu, Mumbai  E-Brochure.pdfAjmera Prive at Juhu, Mumbai  E-Brochure.pdf
Ajmera Prive at Juhu, Mumbai E-Brochure.pdfManishSaxena95
 
Eco-Efficient Living: Redefining Sustainability through Leech's Green Design ...
Eco-Efficient Living: Redefining Sustainability through Leech's Green Design ...Eco-Efficient Living: Redefining Sustainability through Leech's Green Design ...
Eco-Efficient Living: Redefining Sustainability through Leech's Green Design ...Newman George Leech
 
Kumar Fireworks Hadapsar Link Road Pune Brochure.pdf
Kumar Fireworks Hadapsar Link Road Pune Brochure.pdfKumar Fireworks Hadapsar Link Road Pune Brochure.pdf
Kumar Fireworks Hadapsar Link Road Pune Brochure.pdfBabyrudram
 
Rustomjee The Panorama At Pali Hill, Bandra West, Mumbai - Brochure.pdf
Rustomjee The Panorama At Pali Hill, Bandra West, Mumbai - Brochure.pdfRustomjee The Panorama At Pali Hill, Bandra West, Mumbai - Brochure.pdf
Rustomjee The Panorama At Pali Hill, Bandra West, Mumbai - Brochure.pdfmonikasharma630
 
Dynamic Netsoft A leader In Property management Software
Dynamic Netsoft A leader In Property management SoftwareDynamic Netsoft A leader In Property management Software
Dynamic Netsoft A leader In Property management SoftwareDynamic Netsoft
 
Anandtara Iris Residences Mundhwa Pune Brochure.pdf
Anandtara Iris Residences Mundhwa Pune Brochure.pdfAnandtara Iris Residences Mundhwa Pune Brochure.pdf
Anandtara Iris Residences Mundhwa Pune Brochure.pdfabbu831446
 
A Brief History of Intangibles in Ad Valorem Taxation.pdf
A Brief History of Intangibles in Ad Valorem Taxation.pdfA Brief History of Intangibles in Ad Valorem Taxation.pdf
A Brief History of Intangibles in Ad Valorem Taxation.pdfTim Wilmath
 
What Is Biophilic Design .pdf
What Is Biophilic Design            .pdfWhat Is Biophilic Design            .pdf
What Is Biophilic Design .pdfyamunaNMH
 
Prestige Rainbow Waters Raidurgam, Gachibowli Hyderabad E- Brochure.pdf
Prestige Rainbow Waters Raidurgam, Gachibowli Hyderabad E- Brochure.pdfPrestige Rainbow Waters Raidurgam, Gachibowli Hyderabad E- Brochure.pdf
Prestige Rainbow Waters Raidurgam, Gachibowli Hyderabad E- Brochure.pdffaheemali990101
 
MADHUGIRI FARM LAND BROCHURES (11)_compressed (1).pdf
MADHUGIRI FARM LAND BROCHURES (11)_compressed (1).pdfMADHUGIRI FARM LAND BROCHURES (11)_compressed (1).pdf
MADHUGIRI FARM LAND BROCHURES (11)_compressed (1).pdfknoxdigital1
 
Ebullient Investments Limited specializes in Building contractor
Ebullient Investments Limited specializes in Building contractorEbullient Investments Limited specializes in Building contractor
Ebullient Investments Limited specializes in Building contractorEbullient Investments Limited
 
Call Girls In Peeragarhi, Delhi↫8447779280↬Call Girls in Peeragarhi Delhi NCR
Call Girls In Peeragarhi, Delhi↫8447779280↬Call Girls in Peeragarhi Delhi NCRCall Girls In Peeragarhi, Delhi↫8447779280↬Call Girls in Peeragarhi Delhi NCR
Call Girls In Peeragarhi, Delhi↫8447779280↬Call Girls in Peeragarhi Delhi NCRasmaqueen5
 
Call Girls In Mayur Vihar-1 Delhi ❤️8860477959 Good Looking Escorts In 24/7 D...
Call Girls In Mayur Vihar-1 Delhi ❤️8860477959 Good Looking Escorts In 24/7 D...Call Girls In Mayur Vihar-1 Delhi ❤️8860477959 Good Looking Escorts In 24/7 D...
Call Girls In Mayur Vihar-1 Delhi ❤️8860477959 Good Looking Escorts In 24/7 D...lizamodels9
 
Shapoorji Spectra Sensorium Hinjewadi Pune | E-Brochure
Shapoorji Spectra Sensorium Hinjewadi Pune | E-BrochureShapoorji Spectra Sensorium Hinjewadi Pune | E-Brochure
Shapoorji Spectra Sensorium Hinjewadi Pune | E-BrochureOmanaConsulting
 
83770-87607 ۞Call Girls In Near The Park Hotel (Cp) Delhi
83770-87607 ۞Call Girls In Near The Park Hotel (Cp) Delhi83770-87607 ۞Call Girls In Near The Park Hotel (Cp) Delhi
83770-87607 ۞Call Girls In Near The Park Hotel (Cp) Delhidollysharma2066
 
Kohinoor Hinjewadi Phase 2 Pune | E-Brochure
Kohinoor Hinjewadi Phase 2 Pune | E-BrochureKohinoor Hinjewadi Phase 2 Pune | E-Brochure
Kohinoor Hinjewadi Phase 2 Pune | E-BrochureOmanaConsulting
 

Último (20)

young call girls in Lajpat Nagar,🔝 9953056974 🔝 escort Service
young call girls in Lajpat Nagar,🔝 9953056974 🔝 escort Serviceyoung call girls in Lajpat Nagar,🔝 9953056974 🔝 escort Service
young call girls in Lajpat Nagar,🔝 9953056974 🔝 escort Service
 
8 Key Elements for Comfortable Farmland Living
8 Key Elements for Comfortable Farmland Living 8 Key Elements for Comfortable Farmland Living
8 Key Elements for Comfortable Farmland Living
 
DLF Plots Sriperumbudur in Chennai E Brochure Pdf
DLF Plots Sriperumbudur in Chennai E Brochure PdfDLF Plots Sriperumbudur in Chennai E Brochure Pdf
DLF Plots Sriperumbudur in Chennai E Brochure Pdf
 
Ajmera Prive at Juhu, Mumbai E-Brochure.pdf
Ajmera Prive at Juhu, Mumbai  E-Brochure.pdfAjmera Prive at Juhu, Mumbai  E-Brochure.pdf
Ajmera Prive at Juhu, Mumbai E-Brochure.pdf
 
Eco-Efficient Living: Redefining Sustainability through Leech's Green Design ...
Eco-Efficient Living: Redefining Sustainability through Leech's Green Design ...Eco-Efficient Living: Redefining Sustainability through Leech's Green Design ...
Eco-Efficient Living: Redefining Sustainability through Leech's Green Design ...
 
Kumar Fireworks Hadapsar Link Road Pune Brochure.pdf
Kumar Fireworks Hadapsar Link Road Pune Brochure.pdfKumar Fireworks Hadapsar Link Road Pune Brochure.pdf
Kumar Fireworks Hadapsar Link Road Pune Brochure.pdf
 
Rustomjee The Panorama At Pali Hill, Bandra West, Mumbai - Brochure.pdf
Rustomjee The Panorama At Pali Hill, Bandra West, Mumbai - Brochure.pdfRustomjee The Panorama At Pali Hill, Bandra West, Mumbai - Brochure.pdf
Rustomjee The Panorama At Pali Hill, Bandra West, Mumbai - Brochure.pdf
 
Dynamic Netsoft A leader In Property management Software
Dynamic Netsoft A leader In Property management SoftwareDynamic Netsoft A leader In Property management Software
Dynamic Netsoft A leader In Property management Software
 
Anandtara Iris Residences Mundhwa Pune Brochure.pdf
Anandtara Iris Residences Mundhwa Pune Brochure.pdfAnandtara Iris Residences Mundhwa Pune Brochure.pdf
Anandtara Iris Residences Mundhwa Pune Brochure.pdf
 
A Brief History of Intangibles in Ad Valorem Taxation.pdf
A Brief History of Intangibles in Ad Valorem Taxation.pdfA Brief History of Intangibles in Ad Valorem Taxation.pdf
A Brief History of Intangibles in Ad Valorem Taxation.pdf
 
What Is Biophilic Design .pdf
What Is Biophilic Design            .pdfWhat Is Biophilic Design            .pdf
What Is Biophilic Design .pdf
 
Prestige Rainbow Waters Raidurgam, Gachibowli Hyderabad E- Brochure.pdf
Prestige Rainbow Waters Raidurgam, Gachibowli Hyderabad E- Brochure.pdfPrestige Rainbow Waters Raidurgam, Gachibowli Hyderabad E- Brochure.pdf
Prestige Rainbow Waters Raidurgam, Gachibowli Hyderabad E- Brochure.pdf
 
MADHUGIRI FARM LAND BROCHURES (11)_compressed (1).pdf
MADHUGIRI FARM LAND BROCHURES (11)_compressed (1).pdfMADHUGIRI FARM LAND BROCHURES (11)_compressed (1).pdf
MADHUGIRI FARM LAND BROCHURES (11)_compressed (1).pdf
 
Hot call girls in Moti Bagh🔝 9953056974 🔝 escort Service
Hot call girls in Moti Bagh🔝 9953056974 🔝 escort ServiceHot call girls in Moti Bagh🔝 9953056974 🔝 escort Service
Hot call girls in Moti Bagh🔝 9953056974 🔝 escort Service
 
Ebullient Investments Limited specializes in Building contractor
Ebullient Investments Limited specializes in Building contractorEbullient Investments Limited specializes in Building contractor
Ebullient Investments Limited specializes in Building contractor
 
Call Girls In Peeragarhi, Delhi↫8447779280↬Call Girls in Peeragarhi Delhi NCR
Call Girls In Peeragarhi, Delhi↫8447779280↬Call Girls in Peeragarhi Delhi NCRCall Girls In Peeragarhi, Delhi↫8447779280↬Call Girls in Peeragarhi Delhi NCR
Call Girls In Peeragarhi, Delhi↫8447779280↬Call Girls in Peeragarhi Delhi NCR
 
Call Girls In Mayur Vihar-1 Delhi ❤️8860477959 Good Looking Escorts In 24/7 D...
Call Girls In Mayur Vihar-1 Delhi ❤️8860477959 Good Looking Escorts In 24/7 D...Call Girls In Mayur Vihar-1 Delhi ❤️8860477959 Good Looking Escorts In 24/7 D...
Call Girls In Mayur Vihar-1 Delhi ❤️8860477959 Good Looking Escorts In 24/7 D...
 
Shapoorji Spectra Sensorium Hinjewadi Pune | E-Brochure
Shapoorji Spectra Sensorium Hinjewadi Pune | E-BrochureShapoorji Spectra Sensorium Hinjewadi Pune | E-Brochure
Shapoorji Spectra Sensorium Hinjewadi Pune | E-Brochure
 
83770-87607 ۞Call Girls In Near The Park Hotel (Cp) Delhi
83770-87607 ۞Call Girls In Near The Park Hotel (Cp) Delhi83770-87607 ۞Call Girls In Near The Park Hotel (Cp) Delhi
83770-87607 ۞Call Girls In Near The Park Hotel (Cp) Delhi
 
Kohinoor Hinjewadi Phase 2 Pune | E-Brochure
Kohinoor Hinjewadi Phase 2 Pune | E-BrochureKohinoor Hinjewadi Phase 2 Pune | E-Brochure
Kohinoor Hinjewadi Phase 2 Pune | E-Brochure
 

SF Housing Snapshot: Prices Down 25-6% YoY in Feb '23

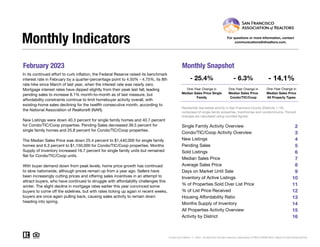
  • 1. February 2023 Monthly Snapshot One-Year Change in One-Year Change in Median Sales Price Single Family Median Sales Price Condo/TIC/Coop 2 3 4 5 6 7 8 9 10 11 12 13 14 15 16 Current as of March 11, 2023. All data from the San Francisco Association of REALTORS® MLS. Report © 2023 ShowingTime. Condo/TIC/Coop Activity Overview Inventory of Active Listings % of Properties Sold Over List Price % of List Price Received Housing Affordability Ratio All Properties Activity Overview New Listings Pending Sales Sold Listings Median Sales Price Average Sales Price Days on Market Until Sale Activity by District Monthly Indicators - 25.4% - 6.3% - 14.1% One-Year Change in In its continued effort to curb inflation, the Federal Reserve raised its benchmark interest rate in February by a quarter-percentage point to 4.50% - 4.75%, its 8th rate hike since March of last year, when the interest rate was nearly zero. Mortgage interest rates have dipped slightly from their peak last fall, leading pending sales to increase 8.1% month-to-month as of last measure, but affordability constraints continue to limit homebuyer activity overall, with existing-home sales declining for the twelfth consecutive month, according to the National Association of Realtors® (NAR). New Listings were down 40.3 percent for single family homes and 40.7 percent for Condo/TIC/Coop properties. Pending Sales decreased 39.5 percent for single family homes and 25.8 percent for Condo/TIC/Coop properties. The Median Sales Price was down 25.4 percent to $1,440,000 for single family homes and 6.3 percent to $1,150,000 for Condo/TIC/Coop properties. Months Supply of Inventory increased 16.7 percent for single family units but remained flat for Condo/TIC/Coop units. With buyer demand down from peak levels, home price growth has continued to slow nationwide, although prices remain up from a year ago. Sellers have been increasingly cutting prices and offering sales incentives in an attempt to attract buyers, who have continued to struggle with affordability challenges this winter. The slight decline in mortgage rates earlier this year convinced some buyers to come off the sidelines, but with rates ticking up again in recent weeks, buyers are once again pulling back, causing sales activity to remain down heading into spring. Median Sales Price All Property Types Residential real estate activity in San Francisco County (Districts 1-10) composed of single-family properties, townhomes and condominiums. Percent changes are calculated using rounded figures. Single Family Activity Overview Months Supply of Inventory For questions or more information, contact communications@sfrealtors.com.
  • 2. Single Family Activity Overview Key metrics by report month and for year-to-date (YTD) starting from the first of the year. Key Metrics Historical Sparkbars 2-2022 2-2023 Percent Change YTD 2022 YTD 2023 Percent Change - 34.3% 339 196 - 32.2% $1,407,500 - 22.7% - 18.3% Pending Sales 215 130 - 39.5% - 38.9% 360 220 New Listings 288 172 - 40.3% 516 Sold Listings 159 97 - 39.0% 289 Median Sales Price $1,930,000 $1,440,000 - 25.4% $1,820,000 42 + 35.5% $1,811,204 -- -- Days on Market 22 34 + 54.5% 31 Avg. Sales Price $2,417,245 $1,803,324 - 25.4% $2,216,852 Active Listings 301 260 - 13.6% -- % of Properties Sold Over List Price 86.8% 53.6% - 38.2% 81.7% 28 49.0% - 40.0% - 13.2% 29 + 3.6% 103.7% % of List Price Received 121.2% 103.9% - 14.3% 119.5% Current as of March 11, 2023. All data from the San Francisco Association of REALTORS® MLS. Report © 2023 ShowingTime. | 2 Months Supply 1.2 1.4 + 16.7% -- -- -- Affordability Ratio 27 28 + 3.7% 2-2020 2-2021 2-2022 2-2023 2-2020 2-2021 2-2022 2-2023 2-2020 2-2021 2-2022 2-2023 2-2020 2-2021 2-2022 2-2023 2-2020 2-2021 2-2022 2-2023 2-2020 2-2021 2-2022 2-2023 2-2020 2-2021 2-2022 2-2023 2-2020 2-2021 2-2022 2-2023 2-2020 2-2021 2-2022 2-2023 2-2020 2-2021 2-2022 2-2023 2-2020 2-2021 2-2022 2-2023
  • 3. Condo/TIC/Coop Activity Overview Key metrics by report month and for year-to-date (YTD) starting from the first of the year. Key Metrics Historical Sparkbars 2-2022 2-2023 Percent Change YTD 2022 YTD 2023 Percent Change - 34.7% Pending Sales 287 213 - 25.8% 538 345 - 35.9% New Listings 535 317 - 40.7% 1,007 658 Sold Listings 250 139 - 44.4% 436 242 - 44.5% Median Sales Price $1,227,500 $1,150,000 - 6.3% $1,176,500 $1,050,000 - 10.8% - 5.9% 71 + 42.0% $1,280,294 -- -- Days on Market 36 59 + 63.9% 50 Avg. Sales Price $1,398,389 $1,297,461 - 7.2% $1,361,221 Active Listings 992 645 - 35.0% -- % of Properties Sold Over List Price 58.4% 28.1% - 51.9% 50.0% 51 24.4% - 51.2% - 5.0% 44 - 13.7% 98.7% % of List Price Received 106.1% 99.2% - 6.5% 103.9% Current as of March 11, 2023. All data from the San Francisco Association of REALTORS® MLS. Report © 2023 ShowingTime. | 3 Months Supply 2.7 2.7 0.0% -- -- -- Affordability Ratio 49 40 - 18.4% 2-2020 2-2021 2-2022 2-2023 2-2020 2-2021 2-2022 2-2023 2-2020 2-2021 2-2022 2-2023 2-2020 2-2021 2-2022 2-2023 2-2020 2-2021 2-2022 2-2023 2-2020 2-2021 2-2022 2-2023 2-2020 2-2021 2-2022 2-2023 2-2020 2-2021 2-2022 2-2023 2-2020 2-2021 2-2022 2-2023 2-2020 2-2021 2-2022 2-2023 2-2020 2-2021 2-2022 2-2023
  • 4. New Listings New Listings Single Family Year-Over-Year Change Condo/TIC/ Coop Year-Over-Year Change Mar-2022 342 +5.6% 615 +13.9% Apr-2022 329 -4.9% 540 -0.2% May-2022 301 -15.4% 516 +1.2% Jun-2022 320 -4.8% 451 -9.8% Jul-2022 240 -21.6% 381 -16.8% Aug-2022 238 -14.1% 307 -20.9% Sep-2022 365 -13.7% 576 -20.2% Oct-2022 243 -27.0% 377 -28.7% Nov-2022 152 -11.1% 153 -42.3% Dec-2022 73 -12.0% 79 -46.3% Jan-2023 167 -26.8% 341 -27.8% Feb-2023 172 -40.3% 317 -40.7% 12-Month Avg 245 -15.2% 388 -17.0% Historical New Listings by Month Current as of March 11, 2023. All data from the San Francisco Association of REALTORS® MLS. Report © 2023 ShowingTime. | 4 A count of the properties that have been newly listed on the market in a given month. 251 503 288 535 172 317 Single Family Condo/TIC/Coop February 0 200 400 600 800 1-2005 1-2006 1-2007 1-2008 1-2009 1-2010 1-2011 1-2012 1-2013 1-2014 1-2015 1-2016 1-2017 1-2018 1-2019 1-2020 1-2021 1-2022 1-2023 Single Family Condo/TIC/Coop 504 1,041 516 1,007 339 658 Single Family Condo/TIC/Coop Year to Date 2021 2022 2023 - 40.7% + 6.4% - 40.3% + 14.7% - 3.3% - 34.3% + 2.4% - 34.7% 2021 2022 2023 2021 2022 2023 2021 2022 2023 - 7.0% + 6.3% + 39.2% + 22.1%
  • 5. Pending Sales Pending Sales Single Family Year-Over-Year Change Condo/TIC/ Coop Year-Over-Year Change Mar-2022 287 -0.7% 437 -7.8% Apr-2022 269 -5.9% 343 -28.5% May-2022 249 -18.9% 332 -28.3% Jun-2022 197 -28.1% 260 -33.0% Jul-2022 182 -29.7% 222 -39.0% Aug-2022 180 -20.4% 232 -26.6% Sep-2022 189 -42.6% 213 -36.8% Oct-2022 196 -28.2% 224 -44.7% Nov-2022 165 -36.3% 161 -55.3% Dec-2022 116 -10.1% 125 -44.7% Jan-2023 90 -37.9% 132 -47.4% Feb-2023 130 -39.5% 213 -25.8% 12-Month Avg 188 -24.8% 241 -33.5% Historical Pending Sales by Month Current as of March 11, 2023. All data from the San Francisco Association of REALTORS® MLS. Report © 2023 ShowingTime. | 5 A count of the properties on which offers have been accepted in a given month. 226 381 215 287 130 213 Single Family Condo/TIC/Coop February 0 100 200 300 400 500 600 1-2005 1-2006 1-2007 1-2008 1-2009 1-2010 1-2011 1-2012 1-2013 1-2014 1-2015 1-2016 1-2017 1-2018 1-2019 1-2020 1-2021 1-2022 1-2023 Single Family Condo/TIC/Coop 395 673 360 538 220 345 Single Family Condo/TIC/Coop Year to Date 2021 2022 2023 - 25.8% - 24.7% - 39.5% - 4.9% - 20.1% - 38.9% - 8.9% - 35.9% 2021 2022 2023 2021 2022 2023 2021 2022 2023 + 52.7% + 48.5% + 73.5% + 67.8%
  • 6. Sold Listings Sold Listings Single Family Year-Over-Year Change Condo/TIC/ Coop Year-Over-Year Change Mar-2022 257 -5.2% 394 -13.8% Apr-2022 256 -11.4% 381 -17.5% May-2022 282 +6.0% 368 -17.1% Jun-2022 249 -23.6% 309 -34.7% Jul-2022 183 -28.2% 235 -36.3% Aug-2022 189 -26.2% 237 -31.9% Sep-2022 180 -26.5% 210 -28.1% Oct-2022 192 -38.1% 224 -38.5% Nov-2022 186 -36.5% 206 -51.5% Dec-2022 153 -29.2% 145 -55.4% Jan-2023 99 -23.8% 103 -44.6% Feb-2023 97 -39.0% 139 -44.4% 12-Month Avg 194 -23.0% 246 -32.9% Historical Sold Listings by Month Current as of March 11, 2023. All data from the San Francisco Association of REALTORS® MLS. Report © 2023 ShowingTime. | 6 A count of the actual sales that closed in a given month. 163 278 159 250 97 139 Single Family Condo/TIC/Coop February 0 100 200 300 400 500 1-2005 1-2006 1-2007 1-2008 1-2009 1-2010 1-2011 1-2012 1-2013 1-2014 1-2015 1-2016 1-2017 1-2018 1-2019 1-2020 1-2021 1-2022 1-2023 Single Family Condo/TIC/Coop 324 548 289 436 196 242 Single Family Condo/TIC/Coop Year to Date 2021 2022 2023 - 44.4% - 10.1% - 39.0% - 2.5% - 20.4% - 32.2% - 10.8% - 44.5% 2021 2022 2023 2021 2022 2023 2021 2022 2023 + 24.4% + 35.0% + 66.6% + 56.2%
  • 7. Median Sales Price Median Sales Price Single Family Year-Over-Year Change Condo/TIC/ Coop Year-Over-Year Change Mar-2022 $2,000,000 +15.9% $1,206,750 -1.2% Apr-2022 $2,050,000 +13.9% $1,365,000 +13.8% May-2022 $2,007,500 +6.4% $1,215,000 -1.1% Jun-2022 $1,880,000 -3.1% $1,240,000 -0.8% Jul-2022 $1,670,000 -9.7% $1,197,000 -1.1% Aug-2022 $1,610,000 -12.9% $1,000,000 -13.0% Sep-2022 $1,650,000 -5.7% $1,160,000 -3.3% Oct-2022 $1,670,000 -7.5% $1,200,000 -3.8% Nov-2022 $1,500,000 -20.2% $1,136,500 -9.8% Dec-2022 $1,550,000 -8.3% $950,000 -26.9% Jan-2023 $1,370,000 -16.0% $985,800 -7.9% Feb-2023 $1,440,000 -25.4% $1,150,000 -6.3% 12-Month Avg* $1,750,000 -4.1% $1,196,000 -2.4% Historical Median Sales Price by Month * Median Sales Price for all properties from March 2022 through February 2023. This is not the average of the individual figures above. Current as of March 11, 2023. All data from the San Francisco Association of REALTORS® MLS. Report © 2023 ShowingTime. | 7 Point at which half of the sales sold for more and half sold for less, not accounting for seller concessions, in a given month. $1,650,000 $1,196,500 $1,930,000 $1,227,500 $1,440,000 $1,150,000 Single Family Condo/TIC/Coop February $500,000 $750,000 $1,000,000 $1,250,000 $1,500,000 $1,750,000 $2,000,000 $2,250,000 1-2005 1-2006 1-2007 1-2008 1-2009 1-2010 1-2011 1-2012 1-2013 1-2014 1-2015 1-2016 1-2017 1-2018 1-2019 1-2020 1-2021 1-2022 1-2023 Single Family Condo/TIC/Coop $1,600,000 $1,135,000 $1,820,000 $1,176,500 $1,407,500 $1,050,000 Single Family Condo/TIC/Coop Year to Date 2021 2022 2023 - 6.3% + 2.6% - 25.4% + 17.0% + 3.7% - 22.7% + 13.8% - 10.8% 2021 2022 2023 2021 2022 2023 2021 2022 2023 + 2.5% + 6.5% - 4.6% - 5.0%
  • 8. Average Sales Price Average Sales Price Single Family Year-Over-Year Change Condo/TIC/ Coop Year-Over-Year Change Mar-2022 $2,534,210 +14.6% $1,411,860 +3.1% Apr-2022 $2,506,193 +3.1% $1,473,383 +9.4% May-2022 $2,411,895 -2.7% $1,403,091 +1.7% Jun-2022 $2,355,940 -5.8% $1,366,119 -1.5% Jul-2022 $2,061,331 -10.1% $1,466,757 +8.1% Aug-2022 $1,950,088 -8.4% $1,174,880 -17.6% Sep-2022 $1,881,502 -13.1% $1,343,336 +0.8% Oct-2022 $2,211,462 -6.3% $1,418,171 -3.0% Nov-2022 $1,895,086 -19.4% $1,399,284 -9.1% Dec-2022 $1,874,472 -20.8% $1,104,823 -25.8% Jan-2023 $1,818,925 -7.8% $1,257,127 -4.1% Feb-2023 $1,803,324 -25.4% $1,297,461 -7.2% 12-Month Avg* $2,179,509 -6.2% $1,368,097 -2.5% Historical Average Sales Price by Month * Avg. Sales Price for all properties from March 2022 through February 2023. This is not the average of the individual figures above. Current as of March 11, 2023. All data from the San Francisco Association of REALTORS® MLS. Report © 2023 ShowingTime. | 8 Average sales price for all closed sales, not accounting for seller concessions, in a given month. $2,257,454 $1,344,643 $2,417,245 $1,398,389 $1,803,324 $1,297,461 Single Family Condo/TIC/Coop February $500,000 $1,000,000 $1,500,000 $2,000,000 $2,500,000 $3,000,000 1-2005 1-2006 1-2007 1-2008 1-2009 1-2010 1-2011 1-2012 1-2013 1-2014 1-2015 1-2016 1-2017 1-2018 1-2019 1-2020 1-2021 1-2022 1-2023 Single Family Condo/TIC/Coop $2,102,627 $1,278,817 $2,216,852 $1,361,221 $1,811,204 $1,280,294 Single Family Condo/TIC/Coop Year to Date 2021 2022 2023 - 7.2% + 4.0% - 25.4% + 7.1% + 6.4% - 18.3% + 5.4% - 5.9% 2021 2022 2023 2021 2022 2023 2021 2022 2023 + 18.2% + 4.7% - 2.6% - 0.5%
  • 9. Days on Market Until Sale Days on Market Until Sale Single Family Year-Over-Year Change Condo/TIC/ Coop Year-Over-Year Change Mar-2022 16 -38.5% 34 -29.2% Apr-2022 16 -20.0% 32 -31.9% May-2022 21 +5.0% 37 -5.1% Jun-2022 17 -10.5% 39 +5.4% Jul-2022 21 +10.5% 49 +16.7% Aug-2022 26 +4.0% 50 +16.3% Sep-2022 28 +21.7% 58 +45.0% Oct-2022 28 +40.0% 43 +19.4% Nov-2022 35 +66.7% 51 +24.4% Dec-2022 38 +22.6% 74 +57.4% Jan-2023 50 +22.0% 87 +27.9% Feb-2023 34 +54.5% 59 +63.9% 12-Month Avg* 25 +8.2% 46 +6.3% Historical Days on Market Until Sale by Month * Days on Market for all properties from March 2022 through February 2023. This is not the average of the individual figures above. Current as of March 11, 2023. All data from the San Francisco Association of REALTORS® MLS. Report © 2023 ShowingTime. | 9 Average number of days between when a property is listed and when an offer is accepted in a given month. 34 66 22 36 34 59 Single Family Condo/TIC/Coop February 0 20 40 60 80 100 120 1-2005 1-2006 1-2007 1-2008 1-2009 1-2010 1-2011 1-2012 1-2013 1-2014 1-2015 1-2016 1-2017 1-2018 1-2019 1-2020 1-2021 1-2022 1-2023 Single Family Condo/TIC/Coop 37 70 31 50 42 71 Single Family Condo/TIC/Coop Year to Date 2021 2022 2023 + 63.9% - 45.5% + 54.5% - 35.3% - 28.6% + 35.5% - 16.2% + 42.0% 2021 2022 2023 2021 2022 2023 2021 2022 2023 + 21.4% + 12.1% + 42.9% + 106.3%
  • 10. Inventory of Active Listings Inventory of Active Listings Single Family Year-Over-Year Change Condo/TIC/ Coop Year-Over-Year Change Mar-2022 318 -13.4% 1,048 -8.8% Apr-2022 337 -14.2% 1,109 -0.3% May-2022 331 -18.5% 1,119 +4.6% Jun-2022 376 -9.6% 1,101 +3.9% Jul-2022 364 -14.4% 1,018 -4.1% Aug-2022 346 -19.5% 890 -13.2% Sep-2022 476 +0.6% 1,101 -15.4% Oct-2022 465 -4.7% 1,087 -16.6% Nov-2022 366 +0.8% 853 -22.0% Dec-2022 205 0.0% 497 -26.5% Jan-2023 244 -6.9% 610 -26.6% Feb-2023 260 -13.6% 645 -35.0% 12-Month Avg* 341 -9.7% 923 -12.6% Historical Inventory of Active Listings by Month * Active Listings for all properties from March 2022 through February 2023. This is not the average of the individual figures above. Current as of March 11, 2023. All data from the San Francisco Association of REALTORS® MLS. Report © 2023 ShowingTime. | 10 The number of properties available for sale in active status at the end of a given month. 381 1,237 301 992 260 645 Single Family Condo/TIC/Coop February 0 500 1,000 1,500 2,000 2,500 1-2005 1-2006 1-2007 1-2008 1-2009 1-2010 1-2011 1-2012 1-2013 1-2014 1-2015 1-2016 1-2017 1-2018 1-2019 1-2020 1-2021 1-2022 1-2023 Single Family Condo/TIC/Coop 2021 2022 2023 - 35.0% - 19.8% - 13.6% - 21.0% 2021 2022 2023 - 3.3% + 69.9%
  • 11. % of Properties Sold Over List Price % of Properties Sold Over List Price Single Family Year-Over-Year Change Condo/TIC/ Coop Year-Over-Year Change Mar-2022 86.4% +17.1% 58.1% +35.4% Apr-2022 88.7% +16.6% 63.0% +39.4% May-2022 86.9% +9.0% 55.3% +3.6% Jun-2022 86.3% +5.0% 57.3% +5.5% Jul-2022 78.1% -6.5% 39.6% -28.8% Aug-2022 75.7% -10.3% 37.1% -32.1% Sep-2022 67.2% -20.5% 31.0% -43.1% Oct-2022 64.1% -24.1% 37.5% -38.2% Nov-2022 57.5% -27.7% 30.6% -45.2% Dec-2022 48.4% -38.5% 15.9% -65.8% Jan-2023 44.4% -41.1% 19.4% -49.9% Feb-2023 53.6% -38.2% 28.1% -51.9% 12-Month Avg 73.9% -8.6% 44.9% -13.5% Historical % of Properties Sold Over List Price by Month * % of Properties Sold Over List Price for all properties from March 2022 through February 2023. This is not the average of the individual figures above. Current as of March 11, 2023. All data from the San Francisco Association of REALTORS® MLS. Report © 2023 ShowingTime. | 11 Percentage found when dividing the number of properties sold by properties sold over its original list price, not accounting for seller concessions. 68.1% 35.3% 86.8% 58.4% 53.6% 28.1% Single Family Condo/TIC/Coop February 0.0% 20.0% 40.0% 60.0% 80.0% 100.0% 1-2005 1-2006 1-2007 1-2008 1-2009 1-2010 1-2011 1-2012 1-2013 1-2014 1-2015 1-2016 1-2017 1-2018 1-2019 1-2020 1-2021 1-2022 1-2023 Single Family Condo/TIC/Coop 63.0% 28.6% 81.7% 50.0% 49.0% 24.4% Single Family Condo/TIC/Coop Year to Date 2021 2022 2023 - 51.9% + 65.4% - 38.2% + 27.5% + 74.8% - 40.0% + 29.7% - 51.2% 2021 2022 2023 2021 2022 2023 2021 2022 2023 - 7.1% - 8.0% - 41.9% - 44.4%
  • 12. % of List Price Received % of List Price Received Single Family Year-Over-Year Change Condo/TIC/ Coop Year-Over-Year Change Mar-2022 121.9% +8.7% 106.4% +3.9% Apr-2022 123.1% +8.2% 107.2% +3.4% May-2022 119.6% +2.4% 105.9% +0.7% Jun-2022 116.8% +0.5% 105.3% 0.0% Jul-2022 110.9% -6.4% 101.5% -3.1% Aug-2022 108.4% -6.6% 100.7% -3.5% Sep-2022 108.5% -6.7% 100.6% -4.2% Oct-2022 107.1% -8.5% 100.4% -4.8% Nov-2022 104.9% -8.6% 99.2% -5.2% Dec-2022 102.8% -10.1% 98.1% -5.2% Jan-2023 103.4% -11.9% 98.0% -3.1% Feb-2023 103.9% -14.3% 99.2% -6.5% 12-Month Avg* 112.8% -2.7% 103.1% -1.2% Historical % of List Price Received by Month * % of List Price Received for all properties from March 2022 through February 2023. This is not the average of the individual figures above. Current as of March 11, 2023. All data from the San Francisco Association of REALTORS® MLS. Report © 2023 ShowingTime. | 12 Percentage found when dividing a property’s sales price by its most recent list price, then taking the average for all properties sold in a given month, not accounting for seller concessions. 109.7% 100.7% 121.2% 106.1% 103.9% 99.2% Single Family Condo/TIC/Coop February 107.5% 99.7% 119.5% 103.9% 103.7% 98.7% Single Family Condo/TIC/Coop Year to Date 90.0% 100.0% 110.0% 120.0% 130.0% 1-2005 1-2006 1-2007 1-2008 1-2009 1-2010 1-2011 1-2012 1-2013 1-2014 1-2015 1-2016 1-2017 1-2018 1-2019 1-2020 1-2021 1-2022 1-2023 Single Family Condo/TIC/Coop 2021 2022 2023 - 6.5% + 5.4% - 14.3% + 10.5% 2021 2022 2023 - 1.7% - 4.3% 2021 2022 2023 - 5.0% + 4.2% - 13.2% + 11.2% 2021 2022 2023 - 1.8% - 3.2%
  • 13. Housing Affordability Ratio Housing Affordability Ratio Single Family Year-Over-Year Change Condo/TIC/ Coop Year-Over-Year Change Mar-2022 24 -25.0% 45 -13.5% Apr-2022 21 -32.3% 37 -32.7% May-2022 22 -26.7% 42 -22.2% Jun-2022 23 -17.9% 40 -23.1% Jul-2022 27 -10.0% 43 -20.4% Aug-2022 28 -6.7% 51 -10.5% Sep-2022 24 -25.0% 39 -29.1% Oct-2022 23 -25.8% 37 -30.2% Nov-2022 27 -10.0% 39 -27.8% Dec-2022 27 -15.6% 49 0.0% Jan-2023 31 -3.1% 48 -15.8% Feb-2023 28 +3.7% 40 -18.4% 12-Month Avg* 25 -7.8% 42 -25.2% Historical Housing Affordability Ratio by Month * Affordability Ratio for all properties from March 2022 through February 2023. This is not the average of the individual figures above. Current as of March 11, 2023. All data from the San Francisco Association of REALTORS® MLS. Report © 2023 ShowingTime. | 13 This index measures housing affordability for the region. For example, an index of 120 means the median household income is 120% of what is necessary to qualify for the median-priced home under prevailing interest rates. A higher number means greater affordability. 33 53 27 49 28 40 Single Family Condo/TIC/Coop February 20 40 60 80 100 1-2005 1-2006 1-2007 1-2008 1-2009 1-2010 1-2011 1-2012 1-2013 1-2014 1-2015 1-2016 1-2017 1-2018 1-2019 1-2020 1-2021 1-2022 1-2023 Single Family Condo/TIC/Coop 2021 2022 2023 - 18.4% - 7.5% + 3.7% - 18.2% 2021 2022 2023 - 2.9% + 3.9% 34 56 28 51 29 44 Single Family Condo/TIC/Coop Year to Date 2021 2022 2023 - 13.7% - 8.9% + 3.6% - 17.6% 2021 2022 2023 - 5.6% + 3.7%
  • 14. Months Supply of Inventory Months Supply of Inventory Single Family Year-Over-Year Change Condo/TIC/ Coop Year-Over-Year Change Mar-2022 1.3 -18.8% 2.9 -27.5% Apr-2022 1.4 -12.5% 3.2 -8.6% May-2022 1.4 -12.5% 3.3 +6.5% Jun-2022 1.6 0.0% 3.4 +13.3% Jul-2022 1.6 0.0% 3.2 +10.3% Aug-2022 1.5 -6.3% 2.9 +3.6% Sep-2022 2.2 +22.2% 3.7 +5.7% Oct-2022 2.2 +15.8% 3.9 +11.4% Nov-2022 1.8 +28.6% 3.2 +10.3% Dec-2022 1.0 +25.0% 1.9 +5.6% Jan-2023 1.3 +30.0% 2.5 +13.6% Feb-2023 1.4 +16.7% 2.7 0.0% 12-Month Avg* 1.6 +5.2% 3.1 +2.3% Historical Months Supply of Inventory by Month * Months Supply for all properties from March 2022 through February 2023. This is not the average of the individual figures above. Current as of March 11, 2023. All data from the San Francisco Association of REALTORS® MLS. Report © 2023 ShowingTime. | 14 The inventory of homes for sale at the end of a given month, divided by the average monthly pending sales from the last 12 months. 1.7 4.7 1.2 2.7 1.4 2.7 Single Family Condo/TIC/Coop February 0.0 2.0 4.0 6.0 8.0 10.0 12.0 1-2005 1-2006 1-2007 1-2008 1-2009 1-2010 1-2011 1-2012 1-2013 1-2014 1-2015 1-2016 1-2017 1-2018 1-2019 1-2020 1-2021 1-2022 1-2023 Single Family Condo/TIC/Coop 2021 2022 2023 0.0% - 42.6% + 16.7% - 29.4% 2021 2022 2023 - 10.5% + 56.7%
  • 15. All Properties Activity Overview Key metrics by report month and for year-to-date (YTD) starting from the first of the year. Key Metrics Historical Sparkbars 2-2022 2-2023 Percent Change YTD 2022 YTD 2023 Percent Change - 34.0% Pending Sales 508 348 - 31.5% 908 573 - 36.9% New Listings 831 499 - 40.0% 1,535 1,013 Sold Listings 412 237 - 42.5% 734 441 - 39.9% Median Sales Price $1,457,500 $1,252,000 - 14.1% $1,406,500 $1,250,000 - 11.1% - 10.8% 58 + 38.1% $1,513,293 -- -- Days on Market 31 49 + 58.1% 42 Avg. Sales Price $1,790,022 $1,502,825 - 16.0% $1,697,363 Active Listings 1,321 932 - 29.4% -- % of Properties Sold Over List Price 69.4% 38.8% - 44.1% 62.5% 36 35.6% - 43.0% - 8.4% 31 - 13.9% 100.9% % of List Price Received 111.9% 101.1% - 9.7% 110.1% Current as of March 11, 2023. All data from the San Francisco Association of REALTORS® MLS. Report © 2023 ShowingTime. | 15 Months Supply 2.1 2.1 0.0% -- -- -- Affordability Ratio 34 31 - 8.8% 2-2020 2-2021 2-2022 2-2023 2-2020 2-2021 2-2022 2-2023 2-2020 2-2021 2-2022 2-2023 2-2020 2-2021 2-2022 2-2023 2-2020 2-2021 2-2022 2-2023 2-2020 2-2021 2-2022 2-2023 2-2020 2-2021 2-2022 2-2023 2-2020 2-2021 2-2022 2-2023 2-2020 2-2021 2-2022 2-2023 2-2020 2-2021 2-2022 2-2023 2-2020 2-2021 2-2022 2-2023
  • 16. Activity by District SF District 1: Northwest (Sea Cliff, Lake, Jordan Park / Laurel Heights, Outer Richmond, Central Richmond, Inner Richmond, Lone Mountain) SF District 2: Central West (Outer Sunset, Central Sunset, Inner Sunset, Outer Parkside, Parkside, Inner Parkside, Golden Gate Heights) SF District 3: Southwest (Pine Lake Park, Lake Shore, Merced Manor, Stonestown, Lakeside, Merced Heights, Ingleside, Ingleside Heights, Oceanview) SF District 4: Twin Peaks W (Forest Hill (& Ext), W Portal, St Francis Wd, Balboa Terr, Mt Dav Manor, Ingleside Terr, Monterey Hts, Wstwd Pk & H'lnds, Shrwd Fst, Miraloma Pk, Dmnd Hts, Mdtwn Terr) SF District 5: Central (Haight Ashbury, Cole Vly / Prnssus Hts, Clarndn Hts, Corona Hts, Twin Pks, Glen Pk, Noe Vly, Eureka Vly / Dolores Hts, Mission Dolores, Duboce Trngl, Buena Vista / Ashbury Hts) SF District 6: Central North (Lower Pacific Heights, Anza Vista, Western Addition, North Panhandle, Alamo Square, Hayes Valley) SF District 7: North (Marina, Cow Hollow, Presidio Heights, Pacific Heights) SF District 8: Northeast (North Waterfront, North Beach, Russian Hill, Telegraph Hill, Nob Hill, Financial District / Barbary Coast, Downtown, Van Ness / Civic Center, Tenderloin) SF District 9: Central East (Yerba Buena, South Beach, South of Market, Mission Bay, Inner Mission, Potrero Hill, Central Waterfront / Dogpatch, Bernal Heights) SF District 10: Southeast (Outer Mission, Mission Terr, Excelsior, Portola, Bayview, Silver Terr, Hunters Pt, Candlestick Pt, Bayview Hts, Little Hollywood, Visitation Vly, Crocker Amazon) 2-2022 2-2023 + / – 2-2022 2-2023 + / – 2-2022 2-2023 + / – 2-2022 2-2023 + / – 2-2022 2-2023 + / – Single Family 1 SF District 1 30 22 -26.7% 15 1 -93.3% $2,505,000 $3,900,000 +55.7% 32 71 +121.9% 1.5 1.4 -6.7% 2 SF District 2 35 30 -14.3% 34 16 -52.9% $1,840,000 $1,627,000 -11.6% 20 23 +15.0% 0.8 0.8 0.0% 3 SF District 3 20 18 -10.0% 10 9 -10.0% $1,482,500 $1,205,000 -18.7% 22 25 +13.6% 1.2 1.4 +16.7% 4 SF District 4 22 25 +13.6% 24 14 -41.7% $2,650,000 $1,495,000 -43.6% 24 34 +41.7% 0.6 1.0 +66.7% 5 SF District 5 38 30 -21.1% 27 17 -37.0% $2,500,000 $2,620,000 +4.8% 21 32 +52.4% 1.0 1.1 +10.0% 6 SF District 6 9 5 -44.4% 2 1 -50.0% $1,425,000 $1,350,000 -5.3% 8 20 +150.0% 1.9 1.8 -5.3% 7 SF District 7 31 35 +12.9% 6 2 -66.7% $4,706,250 $7,097,500 +50.8% 37 35 -5.4% 2.4 4.9 +104.2% 8 SF District 8 21 10 -52.4% 1 0 -100.0% $815,000 $0 -100.0% 10 0 -100.0% 7.5 3.2 -57.3% 9 SF District 9 38 26 -31.6% 11 15 +36.4% $2,210,000 $1,650,000 -25.3% 24 45 +87.5% 1.4 1.3 -7.1% 10 SF District 10 57 59 +3.5% 29 22 -24.1% $1,360,000 $1,015,000 -25.4% 16 39 +143.8% 1.3 1.6 +23.1% Condo/TIC/Coop 1 SF District 1 34 23 -32.4% 10 9 -10.0% $1,280,000 $1,395,000 +9.0% 19 54 +184.2% 1.9 1.7 -10.5% 2 SF District 2 14 15 +7.1% 1 7 +600.0% $1,250,000 $1,050,000 -16.0% 0 65 -- 2.6 4.1 +57.7% 3 SF District 3 4 5 +25.0% 2 3 +50.0% $621,500 $768,800 +23.7% 43 22 -48.8% 1.0 1.7 +70.0% 4 SF District 4 17 9 -47.1% 6 2 -66.7% $870,000 $945,000 +8.6% 26 9 -65.4% 3.3 2.3 -30.3% 5 SF District 5 73 75 +2.7% 38 21 -44.7% $1,482,500 $1,245,000 -16.0% 20 47 +135.0% 1.4 1.7 +21.4% 6 SF District 6 88 54 -38.6% 30 16 -46.7% $1,327,500 $1,335,000 +0.6% 33 34 +3.0% 2.3 2.0 -13.0% 7 SF District 7 68 50 -26.5% 23 15 -34.8% $1,495,000 $1,600,000 +7.0% 36 24 -33.3% 1.7 1.9 +11.8% 8 SF District 8 205 137 -33.2% 42 22 -47.6% $1,050,000 $920,000 -12.4% 43 88 +104.7% 3.3 3.4 +3.0% 9 SF District 9 443 256 -42.2% 91 41 -54.9% $1,173,000 $1,000,000 -14.7% 44 79 +79.5% 3.5 3.4 -2.9% 10 SF District 10 46 21 -54.3% 7 3 -57.1% $915,000 $900,000 -1.6% 30 47 +56.7% 5.7 3.7 -35.1% Key metrics by report month for the districts of San Francisco. Current as of March 11, 2023. All data from the San Francisco Association of REALTORS® MLS. Report © 2023 ShowingTime. | 16 Active Listings Sold Listings Median Sales Price Days on Market Months Supply