SlideShare una empresa de Scribd logo
1 de 16
Descargar para leer sin conexión
May 2020 Monthly Snapshot
One-Year Change in One-Year Change in
Median Sales Price
Single Family
Median Sales Price
Condo/TIC/Coop
2
3
4
5
6
7
8
9
10
11
12
13
14
15
16
Monthly Indicators
- 3.3% - 10.8% + 6.5%
One-Year Change in
While the effects of COVID-19 in the broader economy continue, real estate
activity is beginning to recover across much of the country. According to
Freddie Mac, mortgage rates have been below 3.3 percent for more than four
weeks and are hovering near all-time lows, spurring strong interest by buyers
and lifting showing activity up 4% nationally versus a year ago in the final week
of May.
New Listings were down 33.8 percent for single family homes and 7.3 percent
for Condo/TIC/Coop properties. Pending Sales decreased 41.5 percent for
single family homes and 58.9 percent for Condo/TIC/Coop properties.
The Median Sales Price was down 3.3 percent to $1,630,000 for single family
homes and 10.8 percent to $1,110,000 for Condo/TIC/Coop properties. Months
Supply of Inventory increased 15.4 percent for single family units and 43.3
percent for Condo/TIC/Coop units.
Buyers have been quicker to return to the housing market in force than sellers,
who have been showing a bit more reluctance to list their homes than is typical
for this time of year. But trends are improving and as states and localities
continue to moderate their COVID-19 policies, real estate activity is expected
to continue to improve in the coming weeks.
Median Sales Price
All Property Types
Residential real estate activity in San Francisco County (Districts 1-10)
composed of single-family properties, townhomes and condominiums.
Percent changes are calculated using rounded figures.
Single Family Activity Overview
Months Supply of Inventory
Current as of June 11, 2020. All data from the San Francisco MLS. Report © 2020 ShowingTime.
Condo/TIC/Coop Activity Overview
Inventory of Active Listings
% of Properties Sold Over List Price
% of List Price Received
Housing Affordability Ratio
All Properties Activity Overview
New Listings
Pending Sales
Sold Listings
Median Sales Price
Average Sales Price
Days on Market Until Sale
Activity by District
Single Family Activity Overview
Key metrics by report month and for year-to-date (YTD) starting from the first of the year.
Key Metrics Historical Sparkbars 5-2019 5-2020 Percent Change YTD 2019 YTD 2020 Percent Change
Current as of June 11, 2020. All data from the San Francisco MLS. Report © 2020 ShowingTime. | 2
Months Supply 2.6 3.0 + 15.4% -- -- --
Affordability Ratio 30 34 + 13.3%
% of List Price Received 113.2% 106.1% - 6.3% 111.5%
31
69.6% - 6.5%
- 1.2%
34 + 9.7%
110.2%
% of Properties Sold Over List Price 79.9% 62.9% - 21.3% 74.4%
Active Listings 474 473 - 0.2% --
Avg. Sales Price $2,141,318 $1,900,955 - 11.2% $2,065,405
Days on Market 22 24 + 9.1% 27 25 - 7.4%
$2,093,948
-- --
Median Sales Price $1,685,000 $1,630,000 - 3.3% $1,600,000
Sold Listings 239 105 - 56.1% 850
New Listings 275 182 - 33.8% 1,183
Pending Sales 248 145 - 41.5% - 33.7%913 605
- 24.3%895
579 - 31.9%
$1,618,000 + 1.1%
+ 1.4%
5-2017 5-2018 5-2019 5-2020
5-2017 5-2018 5-2019 5-2020
5-2017 5-2018 5-2019 5-2020
5-2017 5-2018 5-2019 5-2020
5-2017 5-2018 5-2019 5-2020
5-2017 5-2018 5-2019 5-2020
5-2017 5-2018 5-2019 5-2020
5-2017 5-2018 5-2019 5-2020
5-2017 5-2018 5-2019 5-2020
5-2017 5-2018 5-2019 5-2020
5-2017 5-2018 5-2019 5-2020
Condo/TIC/Coop Activity Overview
Key metrics by report month and for year-to-date (YTD) starting from the first of the year.
Key Metrics Historical Sparkbars 5-2019 5-2020 Percent Change YTD 2019 YTD 2020 Percent Change
Current as of June 11, 2020. All data from the San Francisco MLS. Report © 2020 ShowingTime. | 3
Months Supply 3.0 4.3 + 43.3% -- -- --
Affordability Ratio 47 58 + 23.4%
% of List Price Received 107.4% 100.5% - 6.4% 105.1%
49
53.0% - 6.2%
- 1.6%
52 + 6.1%
103.4%
% of Properties Sold Over List Price 65.0% 42.3% - 34.9% 56.5%
Active Listings 730 854 + 17.0% --
Avg. Sales Price $1,335,560 $1,311,712 - 1.8% $1,331,679
Days on Market 29 40 + 37.9% 37
$1,237,500 + 3.1%
+ 2.5%
37 0.0%
$1,365,510
-- --
Sold Listings 337 104 - 69.1% 1,199 774 - 35.4%
Median Sales Price $1,245,000 $1,110,000 - 10.8% $1,200,000
- 16.0%
Pending Sales 336 138 - 58.9% 1,295 804 - 37.9%
New Listings 368 341 - 7.3% 1,760 1,478
5-2017 5-2018 5-2019 5-2020
5-2017 5-2018 5-2019 5-2020
5-2017 5-2018 5-2019 5-2020
5-2017 5-2018 5-2019 5-2020
5-2017 5-2018 5-2019 5-2020
5-2017 5-2018 5-2019 5-2020
5-2017 5-2018 5-2019 5-2020
5-2017 5-2018 5-2019 5-2020
5-2017 5-2018 5-2019 5-2020
5-2017 5-2018 5-2019 5-2020
5-2017 5-2018 5-2019 5-2020
New Listings
New Listings
Single
Family
Year-Over-Year
Change
Condo/TIC/
Coop
Year-Over-Year
Change
Jun-2019 233 -12.1% 287 -19.8%
Jul-2019 197 -17.6% 320 +22.1%
Aug-2019 245 -2.0% 329 +5.8%
Sep-2019 308 -8.9% 508 +11.9%
Oct-2019 244 -5.4% 342 +0.3%
Nov-2019 134 -15.7% 156 -20.4%
Dec-2019 82 0.0% 130 +6.6%
Jan-2020 209 -7.1% 352 -1.7%
Feb-2020 229 +21.2% 365 +19.3%
Mar-2020 143 -40.9% 226 -35.6%
Apr-2020 132 -47.6% 194 -48.5%
May-2020 182 -33.8% 341 -7.3%
12-Month Avg 195 -15.7% 296 -6.7%
Historical New Listings by Month
Current as of June 11, 2020. All data from the San Francisco MLS. Report © 2020 ShowingTime. | 4
A count of the properties that have been newly listed on the market in a given month.
271
370
275
368
182
341
Single Family Condo/TIC/Coop
May
0
100
200
300
400
500
600
700
1-2005 1-2006 1-2007 1-2008 1-2009 1-2010 1-2011 1-2012 1-2013 1-2014 1-2015 1-2016 1-2017 1-2018 1-2019 1-2020
Single Family Condo/TIC/Coop
1,217
1,853
1,183
1,760
895
1,478
Single Family Condo/TIC/Coop
Year to Date
2018 2019 2020
- 7.3%- 0.5%- 33.8%+ 1.5% - 5.0%- 24.3%- 2.8% - 16.0%
2018 2019 2020 2018 2019 2020 2018 2019 2020
- 5.6% + 3.6% + 11.9%+ 2.5%
Pending Sales
Pending Sales
Single
Family
Year-Over-Year
Change
Condo/TIC/
Coop
Year-Over-Year
Change
Jun-2019 194 -4.9% 245 -18.9%
Jul-2019 182 +10.3% 207 -16.2%
Aug-2019 150 -11.8% 212 -8.6%
Sep-2019 195 +1.0% 229 +4.6%
Oct-2019 247 -1.6% 303 +4.1%
Nov-2019 190 +1.6% 234 +5.4%
Dec-2019 114 -5.8% 155 +5.4%
Jan-2020 101 +13.5% 157 +29.8%
Feb-2020 135 -6.3% 236 +3.5%
Mar-2020 153 -27.1% 184 -38.5%
Apr-2020 71 -68.0% 89 -71.4%
May-2020 145 -41.5% 138 -58.9%
12-Month Avg 156 -14.8% 199 -19.2%
Historical Pending Sales by Month
A count of the properties on which offers have been accepted in a given month.
Current as of June 11, 2020. All data from the San Francisco MLS. Report © 2020 ShowingTime. | 5
275
297
248
336
145 138
Single Family Condo/TIC/Coop
May
0
100
200
300
400
1-2005 1-2006 1-2007 1-2008 1-2009 1-2010 1-2011 1-2012 1-2013 1-2014 1-2015 1-2016 1-2017 1-2018 1-2019 1-2020
Single Family Condo/TIC/Coop
942
1,324
913
1,295
605
804
Single Family Condo/TIC/Coop
Year to Date
2018 2019 2020
- 58.9%+ 13.1%- 41.5%- 9.8% - 2.2%- 33.7%- 3.1% - 37.9%
2018 2019 2020 2018 2019 2020 2018 2019 2020
+ 14.6% + 7.2% + 11.4%- 2.9%
Sold Listings
Sold Listings
Single
Family
Year-Over-Year
Change
Condo/TIC/
Coop
Year-Over-Year
Change
Jun-2019 190 -17.7% 265 -12.5%
Jul-2019 213 +10.9% 244 -10.9%
Aug-2019 168 -12.0% 207 -20.4%
Sep-2019 127 -13.6% 192 +4.9%
Oct-2019 255 +2.8% 259 -11.6%
Nov-2019 200 -9.1% 272 +3.0%
Dec-2019 175 +9.4% 216 +11.3%
Jan-2020 96 -4.0% 150 +31.6%
Feb-2020 115 +1.8% 179 +9.1%
Mar-2020 161 -6.4% 227 -14.3%
Apr-2020 102 -54.9% 114 -64.3%
May-2020 105 -56.1% 104 -69.1%
12-Month Avg 159 -14.8% 202 -18.2%
Historical Sold Listings by Month
A count of the actual sales that closed in a given month.
Current as of June 11, 2020. All data from the San Francisco MLS. Report © 2020 ShowingTime. | 6
249
312
239
337
105 104
Single Family Condo/TIC/Coop
May
0
100
200
300
400
1-2005 1-2006 1-2007 1-2008 1-2009 1-2010 1-2011 1-2012 1-2013 1-2014 1-2015 1-2016 1-2017 1-2018 1-2019 1-2020
Single Family Condo/TIC/Coop
841
1,248
850
1,199
579
774
Single Family Condo/TIC/Coop
Year to Date
2018 2019 2020
- 69.1%+ 8.0%- 56.1%- 4.0% - 3.9%- 31.9%+ 1.1% - 35.4%
2018 2019 2020 2018 2019 2020 2018 2019 2020
+ 14.2% + 3.7% + 13.7%+ 14.7%
Median Sales Price
Median Sales Price
Single
Family
Year-Over-Year
Change
Condo/TIC/
Coop
Year-Over-Year
Change
Jun-2019 $1,750,000 +7.7% $1,299,000 +11.0%
Jul-2019 $1,576,000 -3.1% $1,222,444 +6.3%
Aug-2019 $1,602,500 +4.2% $1,281,250 +3.8%
Sep-2019 $1,530,000 +2.0% $1,325,000 +15.2%
Oct-2019 $1,650,000 +3.1% $1,325,000 +9.1%
Nov-2019 $1,604,000 +12.4% $1,180,000 -1.1%
Dec-2019 $1,450,000 -2.8% $1,198,283 +2.4%
Jan-2020 $1,462,500 +5.3% $1,172,000 +12.7%
Feb-2020 $1,610,000 +7.3% $1,300,000 +15.0%
Mar-2020 $1,650,000 0.0% $1,265,000 +1.6%
Apr-2020 $1,699,500 +5.4% $1,294,000 +5.6%
May-2020 $1,630,000 -3.3% $1,110,000 -10.8%
12-Month Avg* $1,601,539 +1.7% $1,255,000 +4.6%
Historical Median Sales Price by Month
Point at which half of the sales sold for more and half sold for less, not accounting for seller concessions, in a given month.
* Median Sales Price for all properties from June 2019 through May 2020. This is not the average
of the individual figures above.
Current as of June 11, 2020. All data from the San Francisco MLS. Report © 2020 ShowingTime. | 7
$1,618,888
$1,257,500
$1,685,000
$1,245,000
$1,630,000
$1,110,000
Single Family Condo/TIC/Coop
May
$500,000
$750,000
$1,000,000
$1,250,000
$1,500,000
$1,750,000
$2,000,000
1-2005 1-2006 1-2007 1-2008 1-2009 1-2010 1-2011 1-2012 1-2013 1-2014 1-2015 1-2016 1-2017 1-2018 1-2019 1-2020
Single Family Condo/TIC/Coop
$1,615,000
$1,215,000
$1,600,000
$1,200,000
$1,618,000
$1,237,500
Single Family Condo/TIC/Coop
Year to Date
2018 2019 2020
- 10.8%- 1.0%- 3.3%+ 4.1% - 1.2%+ 1.1%- 0.9% + 3.1%
2018 2019 2020 2018 2019 2020 2018 2019 2020
+ 9.8% + 18.7% + 7.6%+ 7.6%
Average Sales Price
Avg. Sales Price
Single
Family
Year-Over-Year
Change
Condo/TIC/
Coop
Year-Over-Year
Change
Jun-2019 $2,148,466 +10.6% $1,431,991 +7.1%
Jul-2019 $1,959,574 -0.5% $1,310,687 +5.8%
Aug-2019 $1,872,478 +3.3% $1,386,808 +2.9%
Sep-2019 $2,065,723 +13.6% $1,449,604 +15.4%
Oct-2019 $1,912,555 -11.1% $1,447,421 +7.8%
Nov-2019 $1,986,456 +6.6% $1,322,998 +4.7%
Dec-2019 $1,948,749 +9.1% $1,261,689 -5.1%
Jan-2020 $2,212,609 +26.3% $1,319,209 +12.1%
Feb-2020 $1,953,875 +4.4% $1,404,496 +3.0%
Mar-2020 $2,089,204 +2.1% $1,381,742 +3.4%
Apr-2020 $2,346,348 +5.0% $1,381,974 +1.4%
May-2020 $1,900,955 -11.2% $1,311,712 -1.8%
12-Month Avg* $2,014,127 +1.9% $1,370,459 +4.2%
Historical Average Sales Price by Month
Average sales price for all closed sales, not accounting for seller concessions, in a given month.
* Avg. Sales Price for all properties from June 2019 through May 2020. This is not the average of
the individual figures above.
Current as of June 11, 2020. All data from the San Francisco MLS. Report © 2020 ShowingTime. | 8
$2,020,490
$1,399,046
$2,141,318
$1,335,560
$1,900,955
$1,311,712
Single Family Condo/TIC/Coop
May
$500,000
$1,000,000
$1,500,000
$2,000,000
$2,500,000
1-2005 1-2006 1-2007 1-2008 1-2009 1-2010 1-2011 1-2012 1-2013 1-2014 1-2015 1-2016 1-2017 1-2018 1-2019 1-2020
Single Family Condo/TIC/Coop
$2,025,563
$1,346,516
$2,065,405
$1,331,679
$2,093,948
$1,365,510
Single Family Condo/TIC/Coop
Year to Date
2018 2019 2020
- 1.8%- 4.5%- 11.2%+ 6.0% - 1.1%+ 1.4%+ 2.0% + 2.5%
2018 2019 2020 2018 2019 2020 2018 2019 2020
+ 10.1% + 11.8% + 3.9%+ 3.9%
Days on Market Until Sale
Days on Market
Single
Family
Year-Over-Year
Change
Condo/TIC/
Coop
Year-Over-Year
Change
Jun-2019 22 +22.2% 31 +14.8%
Jul-2019 23 +9.5% 33 +6.5%
Aug-2019 25 +13.6% 33 -8.3%
Sep-2019 28 +16.7% 34 +13.3%
Oct-2019 22 -8.3% 28 +3.7%
Nov-2019 24 -7.7% 34 -10.5%
Dec-2019 31 -6.1% 49 +11.4%
Jan-2020 38 -2.6% 62 +12.7%
Feb-2020 25 -13.8% 29 -27.5%
Mar-2020 20 -23.1% 27 -22.9%
Apr-2020 21 -19.2% 32 -15.8%
May-2020 24 +9.1% 40 +37.9%
12-Month Avg* 25 -0.9% 35 +2.2%
Historical Days on Market Until Sale by Month
Average number of days between when a property is listed and when an offer is accepted in a given month.
* Days on Market for all properties from June 2019 through May 2020. This is not the average of
the individual figures above.
Current as of June 11, 2020. All data from the San Francisco MLS. Report © 2020 ShowingTime. | 9
20
27
22
29
24
40
Single Family Condo/TIC/Coop
May
0
20
40
60
80
100
120
1-2005 1-2006 1-2007 1-2008 1-2009 1-2010 1-2011 1-2012 1-2013 1-2014 1-2015 1-2016 1-2017 1-2018 1-2019 1-2020
Single Family Condo/TIC/Coop
22
32
27
37
25
37
Single Family Condo/TIC/Coop
Year to Date
2018 2019 2020
+ 37.9%+ 7.4%+ 9.1%+ 10.0% + 15.6%- 7.4%+ 22.7% 0.0%
2018 2019 2020 2018 2019 2020 2018 2019 2020
- 16.7% - 26.7% - 13.5%- 18.2%
Inventory of Active Listings
Active Listings
Single
Family
Year-Over-Year
Change
Condo/TIC/
Coop
Year-Over-Year
Change
Jun-2019 492 +14.4% 714 -0.3%
Jul-2019 464 +0.4% 731 +11.1%
Aug-2019 515 +4.7% 756 +12.7%
Sep-2019 590 -0.5% 960 +12.8%
Oct-2019 542 0.0% 914 +9.3%
Nov-2019 439 -5.4% 747 +4.5%
Dec-2019 324 -1.5% 545 +7.3%
Jan-2020 414 -7.6% 705 +2.3%
Feb-2020 492 +6.7% 779 +8.3%
Mar-2020 427 -9.1% 671 -6.2%
Apr-2020 460 -4.8% 722 -1.8%
May-2020 473 -0.2% 854 +17.0%
12-Month Avg* 469 -0.3% 758 +6.5%
Historical Inventory of Active Listings by Month
The number of properties available for sale in active status at the end of a given month.
* Active Listings for all properties from June 2019 through May 2020. This is not the average of
the individual figures above.
Current as of June 11, 2020. All data from the San Francisco MLS. Report © 2020 ShowingTime. | 10
406
724
474
730
473
854
Single Family Condo/TIC/Coop
May
0
250
500
750
1,000
1,250
1,500
1-2005 1-2006 1-2007 1-2008 1-2009 1-2010 1-2011 1-2012 1-2013 1-2014 1-2015 1-2016 1-2017 1-2018 1-2019 1-2020
Single Family Condo/TIC/Coop
2018 2019 2020
+ 17.0%+ 0.8%- 0.2%+ 16.7%
2018 2019 2020
- 5.4% + 9.5%
% of Properties Sold Over List Price
% of Properties
Sold Over List Price
Single
Family
Year-Over-Year
Change
Condo/TIC/
Coop
Year-Over-Year
Change
Jun-2019 81.1% -8.2% 64.5% -5.6%
Jul-2019 82.6% -3.3% 70.5% +11.7%
Aug-2019 82.1% +1.9% 58.9% +2.1%
Sep-2019 74.0% -8.6% 59.4% -6.3%
Oct-2019 80.8% -2.3% 65.3% -4.4%
Nov-2019 77.5% +5.3% 64.3% +18.0%
Dec-2019 66.3% -2.6% 47.7% +3.9%
Jan-2020 60.4% +0.7% 33.3% -19.2%
Feb-2020 72.2% -7.3% 62.6% +18.1%
Mar-2020 78.3% +6.8% 59.9% +7.3%
Apr-2020 68.6% -7.2% 59.6% +8.0%
May-2020 62.9% -21.3% 42.3% -34.9%
12-Month Avg 75.6% -3.2% 59.1% -0.0%
Historical % of Properties Sold Over List Price by Month
Percentage found when dividing the number of properties sold by properties sold over its original list price, not accounting for seller
concessions.
* % of Properties Sold Over List Price for all properties from June 2019 through May 2020. This is
not the average of the individual figures above.
Current as of June 11, 2020. All data from the San Francisco MLS. Report © 2020 ShowingTime. | 11
84.7%
67.6%
79.9%
65.0%62.9%
42.3%
Single Family Condo/TIC/Coop
May
0.0%
20.0%
40.0%
60.0%
80.0%
100.0%
1-2005 1-2006 1-2007 1-2008 1-2009 1-2010 1-2011 1-2012 1-2013 1-2014 1-2015 1-2016 1-2017 1-2018 1-2019 1-2020
Single Family Condo/TIC/Coop
79.2%
59.9%
74.4%
56.5%
69.6%
53.0%
Single Family Condo/TIC/Coop
Year to Date
2018 2019 2020
- 34.9%- 3.8%- 21.3%- 5.7% - 5.7%- 6.5%- 6.1% - 6.2%
2018 2019 2020 2018 2019 2020 2018 2019 2020
+ 7.4% + 5.2% + 3.5%+ 10.8%
% of List Price Received
% of List Price
Received
Single
Family
Year-Over-Year
Change
Condo/TIC/
Coop
Year-Over-Year
Change
Jun-2019 115.3% -4.0% 107.2% -0.1%
Jul-2019 115.4% -1.5% 107.6% +0.5%
Aug-2019 115.3% +0.4% 105.8% +0.2%
Sep-2019 112.4% -2.5% 105.2% -1.2%
Oct-2019 114.0% 0.0% 105.9% -1.7%
Nov-2019 111.9% +0.6% 105.1% +1.0%
Dec-2019 109.7% -0.7% 103.1% +1.0%
Jan-2020 107.1% +1.0% 100.4% -0.6%
Feb-2020 111.9% -0.6% 105.2% +1.0%
Mar-2020 114.4% +3.5% 104.3% -0.4%
Apr-2020 108.8% -3.2% 105.5% +0.6%
May-2020 106.1% -6.3% 100.5% -6.4%
12-Month Avg* 112.5% -0.9% 105.0% -0.6%
Historical % of List Price Received by Month
Percentage found when dividing a property’s sales price by its most recent list price, then taking the average for all properties sold in a given
month, not accounting for seller concessions.
* % of List Price Received for all properties from June 2019 through May 2020. This is not the
average of the individual figures above.
Current as of June 11, 2020. All data from the San Francisco MLS. Report © 2020 ShowingTime. | 12
119.5%
108.4%
113.2%
107.4%106.1%
100.5%
Single Family Condo/TIC/Coop
May
117.7%
106.9%
111.5%
105.1%
110.2%
103.4%
Single Family Condo/TIC/Coop
Year to Date
90.0%
100.0%
110.0%
120.0%
130.0%
1-2005 1-2006 1-2007 1-2008 1-2009 1-2010 1-2011 1-2012 1-2013 1-2014 1-2015 1-2016 1-2017 1-2018 1-2019 1-2020
Single Family Condo/TIC/Coop
2018 2019 2020
- 6.4%- 0.9%- 6.3%- 5.3%
2018 2019 2020
+ 3.6% + 2.8%
2018 2019 2020
- 1.6%- 1.7%- 1.2%- 5.3%
2018 2019 2020
+ 3.7% + 2.4%
Housing Affordability Ratio
Affordability Ratio
Single
Family
Year-Over-Year
Change
Condo/TIC/
Coop
Year-Over-Year
Change
Jun-2019 29 -3.3% 45 -6.3%
Jul-2019 33 +10.0% 49 0.0%
Aug-2019 34 +9.7% 49 +8.9%
Sep-2019 35 +12.9% 47 0.0%
Oct-2019 33 +17.9% 48 +17.1%
Nov-2019 33 +3.1% 52 +20.9%
Dec-2019 36 +9.1% 51 +6.3%
Jan-2020 37 +5.7% 54 0.0%
Feb-2020 34 +3.0% 49 -3.9%
Mar-2020 32 +6.7% 49 +4.3%
Apr-2020 32 +3.2% 50 +4.2%
May-2020 34 +13.3% 58 +23.4%
12-Month Avg* 33 +9.0% 31 +22.5%
Historical Housing Affordability Ratio by Month
This index measures housing affordability for the region. For example, an index of 120 means the median household income is 120% of what is
necessary to qualify for the median-priced home under prevailing interest rates. A higher number means greater affordability.
* Affordability Ratio for all properties from June 2019 through May 2020. This is not the average
of the individual figures above.
Current as of June 11, 2020. All data from the San Francisco MLS. Report © 2020 ShowingTime. | 13
30
44
30
47
34
58
Single Family Condo/TIC/Coop
May
20
40
60
80
100
1-2005 1-2006 1-2007 1-2008 1-2009 1-2010 1-2011 1-2012 1-2013 1-2014 1-2015 1-2016 1-2017 1-2018 1-2019 1-2020
Single Family Condo/TIC/Coop
2018 2019 2020
+ 23.4%+ 6.8%+ 13.3%0.0%
2018 2019 2020
- 14.3% - 13.7%
30
46
31
49
34
52
Single Family Condo/TIC/Coop
Year to Date
2018 2019 2020
+ 6.1%+ 6.5%+ 9.7%+ 3.3%
2018 2019 2020
- 21.1% - 13.2%
Months Supply of Inventory
Months Supply
Single
Family
Year-Over-Year
Change
Condo/TIC/
Coop
Year-Over-Year
Change
Jun-2019 2.7 +17.4% 3.0 +7.1%
Jul-2019 2.5 +4.2% 3.1 +19.2%
Aug-2019 2.8 +7.7% 3.2 +23.1%
Sep-2019 3.2 0.0% 4.0 +21.2%
Oct-2019 3.0 +3.4% 3.8 +15.2%
Nov-2019 2.4 -4.0% 3.1 +10.7%
Dec-2019 1.8 0.0% 2.3 +15.0%
Jan-2020 2.3 -4.2% 2.9 +3.6%
Feb-2020 2.7 +8.0% 3.2 +10.3%
Mar-2020 2.4 -4.0% 2.9 -3.3%
Apr-2020 2.8 +7.7% 3.3 +10.0%
May-2020 3.0 +15.4% 4.3 +43.3%
12-Month Avg* 2.6 +4.1% 3.3 +14.4%
Historical Months Supply of Inventory by Month
The inventory of homes for sale at the end of a given month, divided by the average monthly pending sales from the last 12 months.
* Months Supply for all properties from June 2019 through May 2020. This is not the average of
the individual figures above.
Current as of June 11, 2020. All data from the San Francisco MLS. Report © 2020 ShowingTime. | 14
2.1
2.9
2.6
3.03.0
4.3
Single Family Condo/TIC/Coop
May
0.0
2.0
4.0
6.0
8.0
10.0
1-2005 1-2006 1-2007 1-2008 1-2009 1-2010 1-2011 1-2012 1-2013 1-2014 1-2015 1-2016 1-2017 1-2018 1-2019 1-2020
Single Family Condo/TIC/Coop
2018 2019 2020
+ 43.3%+ 3.4%+ 15.4%+ 23.8%
2018 2019 2020
- 8.7% + 3.6%
All Properties Activity Overview
Key metrics by report month and for year-to-date (YTD) starting from the first of the year.
Key Metrics Historical Sparkbars 5-2019 5-2020 Percent Change YTD 2019 YTD 2020 Percent Change
Current as of June 11, 2020. All data from the San Francisco MLS. Report © 2020 ShowingTime. | 15
Months Supply 2.8 3.7 + 32.1% -- -- --
Affordability Ratio 35 41 + 17.1%
% of List Price Received 109.8% 103.3% - 5.9% 107.8%
36
60.1% - 5.9%
- 1.4%
39 + 8.3%
106.3%
% of Properties Sold Over List Price 71.2% 52.6% - 26.1% 63.9%
Active Listings 1,204 1,327 + 10.2% --
Avg. Sales Price $1,669,893 $1,607,743 - 3.7% $1,636,056
Days on Market 26 32 + 23.1% 33
$1,410,000 + 4.2%
+ 2.5%
32 - 3.0%
$1,677,236
-- --
Sold Listings 576 209 - 63.7% 2,049 1,353 - 34.0%
Median Sales Price $1,385,000 $1,475,000 + 6.5% $1,353,000
- 19.4%
Pending Sales 584 283 - 51.5% 2,208 1,409 - 36.2%
New Listings 643 523 - 18.7% 2,943 2,373
5-2017 5-2018 5-2019 5-2020
5-2017 5-2018 5-2019 5-2020
5-2017 5-2018 5-2019 5-2020
5-2017 5-2018 5-2019 5-2020
5-2017 5-2018 5-2019 5-2020
5-2017 5-2018 5-2019 5-2020
5-2017 5-2018 5-2019 5-2020
5-2017 5-2018 5-2019 5-2020
5-2017 5-2018 5-2019 5-2020
5-2017 5-2018 5-2019 5-2020
5-2017 5-2018 5-2019 5-2020
Activity by District
SF District 1: Northwest (Sea Cliff, Lake, Jordan Park / Laurel Heights, Outer Richmond, Central Richmond, Inner Richmond, Lone Mountain)
SF District 2: Central West (Outer Sunset, Central Sunset, Inner Sunset, Outer Parkside, Parkside, Inner Parkside, Golden Gate Heights)
SF District 3: Southwest (Pine Lake Park, Lake Shore, Merced Manor, Stonestown, Lakeside, Merced Heights, Ingleside, Ingleside Heights, Oceanview)
SF District 4: Twin Peaks W (Forest Hill (& Ext), W Portal, St Francis Wd, Balboa Terr, Mt Dav Manor, Ingleside Terr, Monterey Hts, Wstwd Pk & H'lnds, Shrwd Fst, Miraloma Pk, Dmnd Hts, Mdtwn Terr)
SF District 5: Central (Haight Ashbury, Cole Vly / Prnssus Hts, Clarndn Hts, Corona Hts, Twin Pks, Glen Pk, Noe Vly, Eureka Vly / Dolores Hts, Mission Dolores, Duboce Trngl, Buena Vista / Ashbury Hts)
SF District 6: Central North (Lower Pacific Heights, Anza Vista, Western Addition, North Panhandle, Alamo Square, Hayes Valley)
SF District 7: North (Marina, Cow Hollow, Presidio Heights, Pacific Heights)
SF District 8: Northeast (North Waterfront, North Beach, Russian Hill, Telegraph Hill, Nob Hill, Financial District / Barbary Coast, Downtown, Van Ness / Civic Center, Tenderloin)
SF District 9: Central East (Yerba Buena, South Beach, South of Market, Mission Bay, Inner Mission, Potrero Hill, Central Waterfront / Dogpatch, Bernal Heights)
SF District 10: Southeast (Outer Mission, Mission Terr, Excelsior, Portola, Bayview, Silver Terr, Hunters Pt, Candlestick Pt, Bayview Hts, Little Hollywood, Visitation Vly, Crocker Amazon)
5-2019 5-2020 + / – 5-2019 5-2020 + / – 5-2019 5-2020 + / – 5-2019 5-2020 + / – 5-2019 5-2020 + / –
Single Family
1 SF District 1 32 41 +28.1% 22 10 -54.5% $2,520,000 $1,824,500 -27.6% 23 27 +17.4% 2.0 2.9 +45.0%
2 SF District 2 69 38 -44.9% 43 26 -39.5% $1,695,000 $1,425,500 -15.9% 19 23 +21.1% 2.2 1.3 -40.9%
3 SF District 3 30 25 -16.7% 13 8 -38.5% $1,305,000 $1,335,000 +2.3% 18 23 +27.8% 2.5 2.3 -8.0%
4 SF District 4 44 42 -4.5% 35 15 -57.1% $1,685,000 $1,980,000 +17.5% 21 18 -14.3% 1.6 2.0 +25.0%
5 SF District 5 79 101 +27.8% 29 18 -37.9% $2,900,000 $2,187,500 -24.6% 27 16 -40.7% 2.9 4.2 +44.8%
6 SF District 6 19 18 -5.3% 4 3 -25.0% $3,177,500 $3,750,000 +18.0% 22 66 +200.0% 4.6 6.0 +30.4%
7 SF District 7 34 45 +32.4% 15 2 -86.7% $4,150,000 $2,376,925 -42.7% 43 13 -69.8% 4.0 6.9 +72.5%
8 SF District 8 19 28 +47.4% 5 0 -100.0% $4,600,000 $0 -100.0% 27 0 -100.0% 8.4 14.0 +66.7%
9 SF District 9 65 55 -15.4% 29 12 -58.6% $1,500,000 $1,795,000 +19.7% 15 24 +60.0% 3.4 3.3 -2.9%
10 SF District 10 83 80 -3.6% 44 11 -75.0% $1,150,000 $1,225,000 +6.5% 23 38 +65.2% 2.3 2.7 +17.4%
Condo/TIC/Coop
1 SF District 1 30 33 +10.0% 14 8 -42.9% $1,447,500 $932,500 -35.6% 27 44 +63.0% 2.1 3.0 +42.9%
2 SF District 2 6 9 +50.0% 4 0 -100.0% $1,315,000 $0 -100.0% 18 0 -100.0% 1.5 2.2 +46.7%
3 SF District 3 7 6 -14.3% 5 1 -80.0% $1,220,000 $825,000 -32.4% 50 48 -4.0% 2.1 2.1 0.0%
4 SF District 4 7 7 0.0% 13 3 -76.9% $879,000 $1,151,000 +30.9% 40 41 +2.5% 1.3 1.4 +7.7%
5 SF District 5 83 90 +8.4% 51 24 -52.9% $1,455,000 $1,467,500 +0.9% 16 34 +112.5% 2.3 2.8 +21.7%
6 SF District 6 63 60 -4.8% 34 11 -67.6% $1,187,500 $1,230,000 +3.6% 19 33 +73.7% 3.0 3.2 +6.7%
7 SF District 7 58 79 +36.2% 26 13 -50.0% $2,125,000 $1,495,000 -29.6% 33 34 +3.0% 2.4 3.5 +45.8%
8 SF District 8 179 177 -1.1% 51 13 -74.5% $1,150,000 $1,280,000 +11.3% 39 57 +46.2% 4.2 5.6 +33.3%
9 SF District 9 258 351 +36.0% 131 29 -77.9% $1,185,000 $920,000 -22.4% 31 41 +32.3% 2.9 5.1 +75.9%
10 SF District 10 39 42 +7.7% 8 2 -75.0% $825,000 $649,000 -21.3% 25 19 -24.0% 6.6 9.0 +36.4%
Key metrics by report month for the districts of San Fransisco.
Current as of June 11, 2020. All data from the San Francisco MLS. Report © 2020 ShowingTime. | 16
Active Listings Sold Listings Median Sales Price Days on Market Months Supply

Más contenido relacionado

La actualidad más candente

San Francisco Market Report for March 2020
San Francisco Market Report for March 2020San Francisco Market Report for March 2020
San Francisco Market Report for March 2020Ronny Budiutama
 
San Francisco Market Focus Report May 2019
San Francisco Market Focus Report May 2019San Francisco Market Focus Report May 2019
San Francisco Market Focus Report May 2019Ronny Budiutama
 
San Francisco Market Focus Report December 2018
San Francisco Market Focus Report December 2018San Francisco Market Focus Report December 2018
San Francisco Market Focus Report December 2018Ronny Budiutama
 
San Francisco Market Focus Report Feb 2020
San Francisco Market Focus Report Feb 2020San Francisco Market Focus Report Feb 2020
San Francisco Market Focus Report Feb 2020Ronny Budiutama
 
San Francisco market focus report December 2019
San Francisco market focus report December 2019San Francisco market focus report December 2019
San Francisco market focus report December 2019Ronny Budiutama
 
San Fancisco Market Focus Report June 2019
San Fancisco Market Focus Report June 2019San Fancisco Market Focus Report June 2019
San Fancisco Market Focus Report June 2019Ronny Budiutama
 
San Francisco Market Focus Report Jan 2019
San Francisco Market Focus Report Jan 2019San Francisco Market Focus Report Jan 2019
San Francisco Market Focus Report Jan 2019Ronny Budiutama
 
San Francisco market report July 2020
San Francisco market report July 2020San Francisco market report July 2020
San Francisco market report July 2020Ronny Budiutama
 
San Francisco Market Report March 2021
San Francisco Market Report March 2021San Francisco Market Report March 2021
San Francisco Market Report March 2021Ronny Budiutama
 
San Francisco market report April 2020
San Francisco market report April 2020San Francisco market report April 2020
San Francisco market report April 2020Ronny Budiutama
 
San Francisco Market Data October 2020
San Francisco Market Data October 2020San Francisco Market Data October 2020
San Francisco Market Data October 2020Ronny Budiutama
 
San Francisco Market Focus Report July 2019
San Francisco Market Focus Report July 2019San Francisco Market Focus Report July 2019
San Francisco Market Focus Report July 2019Ronny Budiutama
 
San Francisco Market Report January 2021
San Francisco Market Report January 2021San Francisco Market Report January 2021
San Francisco Market Report January 2021Ronny Budiutama
 
San Francisco Market Focus Report Nov 2020
San Francisco Market Focus Report Nov 2020San Francisco Market Focus Report Nov 2020
San Francisco Market Focus Report Nov 2020Ronny Budiutama
 
San Francisco Market Focus Report August 2019
San Francisco Market Focus Report August 2019San Francisco Market Focus Report August 2019
San Francisco Market Focus Report August 2019Ronny Budiutama
 
San Francisco Market Report May 2021
San Francisco Market Report May 2021San Francisco Market Report May 2021
San Francisco Market Report May 2021Ronny Budiutama
 
San Francisco Market Report April 2021
San Francisco Market Report April 2021San Francisco Market Report April 2021
San Francisco Market Report April 2021Ronny Budiutama
 
San Francisco Market Report June 2021
San Francisco Market Report June 2021San Francisco Market Report June 2021
San Francisco Market Report June 2021Ronny Budiutama
 
San Francisco Market Report August 2021
San Francisco Market Report August 2021San Francisco Market Report August 2021
San Francisco Market Report August 2021Ronny Budiutama
 
April 2019 Market Reports for the Gallatin Valley
April 2019 Market Reports for the Gallatin ValleyApril 2019 Market Reports for the Gallatin Valley
April 2019 Market Reports for the Gallatin ValleyReferred Realty Group
 

La actualidad más candente (20)

San Francisco Market Report for March 2020
San Francisco Market Report for March 2020San Francisco Market Report for March 2020
San Francisco Market Report for March 2020
 
San Francisco Market Focus Report May 2019
San Francisco Market Focus Report May 2019San Francisco Market Focus Report May 2019
San Francisco Market Focus Report May 2019
 
San Francisco Market Focus Report December 2018
San Francisco Market Focus Report December 2018San Francisco Market Focus Report December 2018
San Francisco Market Focus Report December 2018
 
San Francisco Market Focus Report Feb 2020
San Francisco Market Focus Report Feb 2020San Francisco Market Focus Report Feb 2020
San Francisco Market Focus Report Feb 2020
 
San Francisco market focus report December 2019
San Francisco market focus report December 2019San Francisco market focus report December 2019
San Francisco market focus report December 2019
 
San Fancisco Market Focus Report June 2019
San Fancisco Market Focus Report June 2019San Fancisco Market Focus Report June 2019
San Fancisco Market Focus Report June 2019
 
San Francisco Market Focus Report Jan 2019
San Francisco Market Focus Report Jan 2019San Francisco Market Focus Report Jan 2019
San Francisco Market Focus Report Jan 2019
 
San Francisco market report July 2020
San Francisco market report July 2020San Francisco market report July 2020
San Francisco market report July 2020
 
San Francisco Market Report March 2021
San Francisco Market Report March 2021San Francisco Market Report March 2021
San Francisco Market Report March 2021
 
San Francisco market report April 2020
San Francisco market report April 2020San Francisco market report April 2020
San Francisco market report April 2020
 
San Francisco Market Data October 2020
San Francisco Market Data October 2020San Francisco Market Data October 2020
San Francisco Market Data October 2020
 
San Francisco Market Focus Report July 2019
San Francisco Market Focus Report July 2019San Francisco Market Focus Report July 2019
San Francisco Market Focus Report July 2019
 
San Francisco Market Report January 2021
San Francisco Market Report January 2021San Francisco Market Report January 2021
San Francisco Market Report January 2021
 
San Francisco Market Focus Report Nov 2020
San Francisco Market Focus Report Nov 2020San Francisco Market Focus Report Nov 2020
San Francisco Market Focus Report Nov 2020
 
San Francisco Market Focus Report August 2019
San Francisco Market Focus Report August 2019San Francisco Market Focus Report August 2019
San Francisco Market Focus Report August 2019
 
San Francisco Market Report May 2021
San Francisco Market Report May 2021San Francisco Market Report May 2021
San Francisco Market Report May 2021
 
San Francisco Market Report April 2021
San Francisco Market Report April 2021San Francisco Market Report April 2021
San Francisco Market Report April 2021
 
San Francisco Market Report June 2021
San Francisco Market Report June 2021San Francisco Market Report June 2021
San Francisco Market Report June 2021
 
San Francisco Market Report August 2021
San Francisco Market Report August 2021San Francisco Market Report August 2021
San Francisco Market Report August 2021
 
April 2019 Market Reports for the Gallatin Valley
April 2019 Market Reports for the Gallatin ValleyApril 2019 Market Reports for the Gallatin Valley
April 2019 Market Reports for the Gallatin Valley
 

Similar a San Francisco market report May 2020

San Francisco Market Focus May 2014
San Francisco Market Focus May 2014San Francisco Market Focus May 2014
San Francisco Market Focus May 2014Ronny Budiutama
 
San Francisco Market Report For July 2021
San Francisco Market Report For July 2021San Francisco Market Report For July 2021
San Francisco Market Report For July 2021Ronny Budiutama
 
San Francisco Market Focus October 2014
San Francisco Market Focus October 2014San Francisco Market Focus October 2014
San Francisco Market Focus October 2014Ronny Budiutama
 
San Francisco Market Focus May 2013
San Francisco Market Focus May 2013San Francisco Market Focus May 2013
San Francisco Market Focus May 2013Ronny Budiutama
 
San Francisco Market Report February 2021
San Francisco Market Report February 2021San Francisco Market Report February 2021
San Francisco Market Report February 2021Ronny Budiutama
 
San Francisco Market Focus June 2015
San Francisco Market Focus June 2015San Francisco Market Focus June 2015
San Francisco Market Focus June 2015Ronny Budiutama
 
San Francisco Market Focus March 2015
San Francisco Market Focus March 2015San Francisco Market Focus March 2015
San Francisco Market Focus March 2015Ronny Budiutama
 
San Francisco Market Focus May 2016
San Francisco Market Focus May 2016San Francisco Market Focus May 2016
San Francisco Market Focus May 2016Ronny Budiutama
 
San Francisco Market Focus April 2017
San Francisco Market Focus April 2017San Francisco Market Focus April 2017
San Francisco Market Focus April 2017Ronny Budiutama
 
San Francisco Market Focus April 2016
San Francisco Market Focus April 2016San Francisco Market Focus April 2016
San Francisco Market Focus April 2016Ronny Budiutama
 
San Francisco Market Focus March 2014
San Francisco Market Focus March 2014San Francisco Market Focus March 2014
San Francisco Market Focus March 2014Ronny Budiutama
 
San Francisco Market Focus April 2015
San Francisco Market Focus April 2015San Francisco Market Focus April 2015
San Francisco Market Focus April 2015Ronny Budiutama
 
San Francisco Market Report March 2022
San Francisco Market Report March 2022San Francisco Market Report March 2022
San Francisco Market Report March 2022Ronny Budiutama
 

Similar a San Francisco market report May 2020 (13)

San Francisco Market Focus May 2014
San Francisco Market Focus May 2014San Francisco Market Focus May 2014
San Francisco Market Focus May 2014
 
San Francisco Market Report For July 2021
San Francisco Market Report For July 2021San Francisco Market Report For July 2021
San Francisco Market Report For July 2021
 
San Francisco Market Focus October 2014
San Francisco Market Focus October 2014San Francisco Market Focus October 2014
San Francisco Market Focus October 2014
 
San Francisco Market Focus May 2013
San Francisco Market Focus May 2013San Francisco Market Focus May 2013
San Francisco Market Focus May 2013
 
San Francisco Market Report February 2021
San Francisco Market Report February 2021San Francisco Market Report February 2021
San Francisco Market Report February 2021
 
San Francisco Market Focus June 2015
San Francisco Market Focus June 2015San Francisco Market Focus June 2015
San Francisco Market Focus June 2015
 
San Francisco Market Focus March 2015
San Francisco Market Focus March 2015San Francisco Market Focus March 2015
San Francisco Market Focus March 2015
 
San Francisco Market Focus May 2016
San Francisco Market Focus May 2016San Francisco Market Focus May 2016
San Francisco Market Focus May 2016
 
San Francisco Market Focus April 2017
San Francisco Market Focus April 2017San Francisco Market Focus April 2017
San Francisco Market Focus April 2017
 
San Francisco Market Focus April 2016
San Francisco Market Focus April 2016San Francisco Market Focus April 2016
San Francisco Market Focus April 2016
 
San Francisco Market Focus March 2014
San Francisco Market Focus March 2014San Francisco Market Focus March 2014
San Francisco Market Focus March 2014
 
San Francisco Market Focus April 2015
San Francisco Market Focus April 2015San Francisco Market Focus April 2015
San Francisco Market Focus April 2015
 
San Francisco Market Report March 2022
San Francisco Market Report March 2022San Francisco Market Report March 2022
San Francisco Market Report March 2022
 

Más de Ronny Budiutama

San Francisco Market Update -February 2024
San Francisco Market Update -February 2024San Francisco Market Update -February 2024
San Francisco Market Update -February 2024Ronny Budiutama
 
San Francisco Market Update - March 2024
San Francisco Market Update - March 2024San Francisco Market Update - March 2024
San Francisco Market Update - March 2024Ronny Budiutama
 
San Francisco January 2024 Market Report
San Francisco January 2024 Market ReportSan Francisco January 2024 Market Report
San Francisco January 2024 Market ReportRonny Budiutama
 
San Francisco December 2023 Market Report
San Francisco December 2023 Market ReportSan Francisco December 2023 Market Report
San Francisco December 2023 Market ReportRonny Budiutama
 
San Francisco November 2023 Market Report
San Francisco November 2023 Market ReportSan Francisco November 2023 Market Report
San Francisco November 2023 Market ReportRonny Budiutama
 
2023 Annual San Francisco Housing Market
2023 Annual San Francisco Housing Market2023 Annual San Francisco Housing Market
2023 Annual San Francisco Housing MarketRonny Budiutama
 
October 2023 Report: San Francisco Real Estate Market Insights
October 2023 Report: San Francisco Real Estate Market InsightsOctober 2023 Report: San Francisco Real Estate Market Insights
October 2023 Report: San Francisco Real Estate Market InsightsRonny Budiutama
 
CA Weekly MLS Market Data Report - August 2023
CA Weekly MLS Market Data Report - August 2023CA Weekly MLS Market Data Report - August 2023
CA Weekly MLS Market Data Report - August 2023Ronny Budiutama
 
San Francisco Market Report July 2023.pdf
San Francisco Market Report July 2023.pdfSan Francisco Market Report July 2023.pdf
San Francisco Market Report July 2023.pdfRonny Budiutama
 
San Francisco May 2023 Market Report.pdf
San Francisco May 2023 Market Report.pdfSan Francisco May 2023 Market Report.pdf
San Francisco May 2023 Market Report.pdfRonny Budiutama
 
San Francisco June 2023 Market Report.pdf
San Francisco June 2023 Market Report.pdfSan Francisco June 2023 Market Report.pdf
San Francisco June 2023 Market Report.pdfRonny Budiutama
 
San Francisco Market Report March 2023.pdf
San Francisco Market Report March 2023.pdfSan Francisco Market Report March 2023.pdf
San Francisco Market Report March 2023.pdfRonny Budiutama
 
San Francisco Market Report February 2023
San Francisco Market Report February 2023San Francisco Market Report February 2023
San Francisco Market Report February 2023Ronny Budiutama
 
San Francisco Market Report January 2023.pdf
San Francisco Market Report January 2023.pdfSan Francisco Market Report January 2023.pdf
San Francisco Market Report January 2023.pdfRonny Budiutama
 
Annual Report on the San Francisco County Housing Market.pdf
Annual Report on the San Francisco County Housing Market.pdfAnnual Report on the San Francisco County Housing Market.pdf
Annual Report on the San Francisco County Housing Market.pdfRonny Budiutama
 
San Francisco Market Report December 2022.pdf
San Francisco Market Report December 2022.pdfSan Francisco Market Report December 2022.pdf
San Francisco Market Report December 2022.pdfRonny Budiutama
 
San Francisco Market Report November 2022.pdf
San Francisco Market Report November 2022.pdfSan Francisco Market Report November 2022.pdf
San Francisco Market Report November 2022.pdfRonny Budiutama
 
San Francisco Market Report October 2022.pdf
San Francisco Market Report October 2022.pdfSan Francisco Market Report October 2022.pdf
San Francisco Market Report October 2022.pdfRonny Budiutama
 
San Francisco Market Report September 2022.pdf
San Francisco Market Report September 2022.pdfSan Francisco Market Report September 2022.pdf
San Francisco Market Report September 2022.pdfRonny Budiutama
 
San Francisco Market Report August 2022.pdf
San Francisco Market Report August 2022.pdfSan Francisco Market Report August 2022.pdf
San Francisco Market Report August 2022.pdfRonny Budiutama
 

Más de Ronny Budiutama (20)

San Francisco Market Update -February 2024
San Francisco Market Update -February 2024San Francisco Market Update -February 2024
San Francisco Market Update -February 2024
 
San Francisco Market Update - March 2024
San Francisco Market Update - March 2024San Francisco Market Update - March 2024
San Francisco Market Update - March 2024
 
San Francisco January 2024 Market Report
San Francisco January 2024 Market ReportSan Francisco January 2024 Market Report
San Francisco January 2024 Market Report
 
San Francisco December 2023 Market Report
San Francisco December 2023 Market ReportSan Francisco December 2023 Market Report
San Francisco December 2023 Market Report
 
San Francisco November 2023 Market Report
San Francisco November 2023 Market ReportSan Francisco November 2023 Market Report
San Francisco November 2023 Market Report
 
2023 Annual San Francisco Housing Market
2023 Annual San Francisco Housing Market2023 Annual San Francisco Housing Market
2023 Annual San Francisco Housing Market
 
October 2023 Report: San Francisco Real Estate Market Insights
October 2023 Report: San Francisco Real Estate Market InsightsOctober 2023 Report: San Francisco Real Estate Market Insights
October 2023 Report: San Francisco Real Estate Market Insights
 
CA Weekly MLS Market Data Report - August 2023
CA Weekly MLS Market Data Report - August 2023CA Weekly MLS Market Data Report - August 2023
CA Weekly MLS Market Data Report - August 2023
 
San Francisco Market Report July 2023.pdf
San Francisco Market Report July 2023.pdfSan Francisco Market Report July 2023.pdf
San Francisco Market Report July 2023.pdf
 
San Francisco May 2023 Market Report.pdf
San Francisco May 2023 Market Report.pdfSan Francisco May 2023 Market Report.pdf
San Francisco May 2023 Market Report.pdf
 
San Francisco June 2023 Market Report.pdf
San Francisco June 2023 Market Report.pdfSan Francisco June 2023 Market Report.pdf
San Francisco June 2023 Market Report.pdf
 
San Francisco Market Report March 2023.pdf
San Francisco Market Report March 2023.pdfSan Francisco Market Report March 2023.pdf
San Francisco Market Report March 2023.pdf
 
San Francisco Market Report February 2023
San Francisco Market Report February 2023San Francisco Market Report February 2023
San Francisco Market Report February 2023
 
San Francisco Market Report January 2023.pdf
San Francisco Market Report January 2023.pdfSan Francisco Market Report January 2023.pdf
San Francisco Market Report January 2023.pdf
 
Annual Report on the San Francisco County Housing Market.pdf
Annual Report on the San Francisco County Housing Market.pdfAnnual Report on the San Francisco County Housing Market.pdf
Annual Report on the San Francisco County Housing Market.pdf
 
San Francisco Market Report December 2022.pdf
San Francisco Market Report December 2022.pdfSan Francisco Market Report December 2022.pdf
San Francisco Market Report December 2022.pdf
 
San Francisco Market Report November 2022.pdf
San Francisco Market Report November 2022.pdfSan Francisco Market Report November 2022.pdf
San Francisco Market Report November 2022.pdf
 
San Francisco Market Report October 2022.pdf
San Francisco Market Report October 2022.pdfSan Francisco Market Report October 2022.pdf
San Francisco Market Report October 2022.pdf
 
San Francisco Market Report September 2022.pdf
San Francisco Market Report September 2022.pdfSan Francisco Market Report September 2022.pdf
San Francisco Market Report September 2022.pdf
 
San Francisco Market Report August 2022.pdf
San Francisco Market Report August 2022.pdfSan Francisco Market Report August 2022.pdf
San Francisco Market Report August 2022.pdf
 

Último

Kalpataru Exquisite Wakad Pune E-Brochure.pdf
Kalpataru Exquisite Wakad Pune  E-Brochure.pdfKalpataru Exquisite Wakad Pune  E-Brochure.pdf
Kalpataru Exquisite Wakad Pune E-Brochure.pdfManishSaxena95
 
Jaipur Escorts 🥰 8617370543 Call Girls Offer VIP Hot Girls
Jaipur Escorts 🥰 8617370543 Call Girls Offer VIP Hot GirlsJaipur Escorts 🥰 8617370543 Call Girls Offer VIP Hot Girls
Jaipur Escorts 🥰 8617370543 Call Girls Offer VIP Hot GirlsDeepika Singh
 
Low rate ↬Call girls in Sabzi Mandi Delhi | 8447779280}Escort Service In All ...
Low rate ↬Call girls in Sabzi Mandi Delhi | 8447779280}Escort Service In All ...Low rate ↬Call girls in Sabzi Mandi Delhi | 8447779280}Escort Service In All ...
Low rate ↬Call girls in Sabzi Mandi Delhi | 8447779280}Escort Service In All ...asmaqueen5
 
Eldeco Dwarka Project In Delhi-brochure.pdf.pdf
Eldeco Dwarka Project In Delhi-brochure.pdf.pdfEldeco Dwarka Project In Delhi-brochure.pdf.pdf
Eldeco Dwarka Project In Delhi-brochure.pdf.pdfkratirudram
 
Low Rate ✨➥9711108085▻✨Call Girls In East Of Kailash (E.K) (Delhi)
Low Rate ✨➥9711108085▻✨Call Girls In East Of Kailash (E.K) (Delhi)Low Rate ✨➥9711108085▻✨Call Girls In East Of Kailash (E.K) (Delhi)
Low Rate ✨➥9711108085▻✨Call Girls In East Of Kailash (E.K) (Delhi)delhi24hrs1
 
BPTP THE AMAARIO Luxury Project Invest Like Royalty in Sector 37D Gurgaon Dwa...
BPTP THE AMAARIO Luxury Project Invest Like Royalty in Sector 37D Gurgaon Dwa...BPTP THE AMAARIO Luxury Project Invest Like Royalty in Sector 37D Gurgaon Dwa...
BPTP THE AMAARIO Luxury Project Invest Like Royalty in Sector 37D Gurgaon Dwa...ApartmentWala1
 
Prestige Sancoale Goa Residneces Brochure.pdf
Prestige Sancoale Goa Residneces Brochure.pdfPrestige Sancoale Goa Residneces Brochure.pdf
Prestige Sancoale Goa Residneces Brochure.pdfkishor21012022
 
BPTP THE AMAARIO For The Royals Of Tomorrow in Sector 37D Gurgaon Dwarka Expr...
BPTP THE AMAARIO For The Royals Of Tomorrow in Sector 37D Gurgaon Dwarka Expr...BPTP THE AMAARIO For The Royals Of Tomorrow in Sector 37D Gurgaon Dwarka Expr...
BPTP THE AMAARIO For The Royals Of Tomorrow in Sector 37D Gurgaon Dwarka Expr...ApartmentWala1
 
Call girls in Shakti Nagar Delhi~8447779280°/=@/ Short 1500 Night 6000}ESCORT...
Call girls in Shakti Nagar Delhi~8447779280°/=@/ Short 1500 Night 6000}ESCORT...Call girls in Shakti Nagar Delhi~8447779280°/=@/ Short 1500 Night 6000}ESCORT...
Call girls in Shakti Nagar Delhi~8447779280°/=@/ Short 1500 Night 6000}ESCORT...asmaqueen5
 
Low Rate Call girls in Sant Nagar{Delhi }8447779280} Service Escorts In South...
Low Rate Call girls in Sant Nagar{Delhi }8447779280} Service Escorts In South...Low Rate Call girls in Sant Nagar{Delhi }8447779280} Service Escorts In South...
Low Rate Call girls in Sant Nagar{Delhi }8447779280} Service Escorts In South...asmaqueen5
 
Bptp The Amaario Launch Luxury Project Sector 37D Gurgaon Dwarka Expressway...
Bptp The Amaario Launch  Luxury Project  Sector 37D Gurgaon Dwarka Expressway...Bptp The Amaario Launch  Luxury Project  Sector 37D Gurgaon Dwarka Expressway...
Bptp The Amaario Launch Luxury Project Sector 37D Gurgaon Dwarka Expressway...ApartmentWala1
 
Yedi Mavi TOBB Zeytinburnu - Listing Turkey
Yedi Mavi TOBB Zeytinburnu - Listing TurkeyYedi Mavi TOBB Zeytinburnu - Listing Turkey
Yedi Mavi TOBB Zeytinburnu - Listing TurkeyListing Turkey
 
Cheap Rate ✨➥9582086666▻✨Call Girls In Gurgaon Sector 1 (Gurgaon)
Cheap Rate ✨➥9582086666▻✨Call Girls In Gurgaon Sector 1 (Gurgaon)Cheap Rate ✨➥9582086666▻✨Call Girls In Gurgaon Sector 1 (Gurgaon)
Cheap Rate ✨➥9582086666▻✨Call Girls In Gurgaon Sector 1 (Gurgaon)delhi24hrs1
 
Ganga Platinum Kharadi Pune brochure.pdf
Ganga Platinum Kharadi Pune brochure.pdfGanga Platinum Kharadi Pune brochure.pdf
Ganga Platinum Kharadi Pune brochure.pdfsabhyara24
 
The Gale at Godrej Park World Hinjewadi Pune Brochure.pdf
The Gale at Godrej Park World Hinjewadi Pune Brochure.pdfThe Gale at Godrej Park World Hinjewadi Pune Brochure.pdf
The Gale at Godrej Park World Hinjewadi Pune Brochure.pdfPrachiRudram
 
Madhugiri Boucher Managed Farmland (knx)
Madhugiri Boucher Managed Farmland (knx)Madhugiri Boucher Managed Farmland (knx)
Madhugiri Boucher Managed Farmland (knx)knoxdigital1
 
Kohinoor Teiko Hinjewadi Phase 2 Pune E-Brochure.pdf
Kohinoor Teiko Hinjewadi Phase 2 Pune  E-Brochure.pdfKohinoor Teiko Hinjewadi Phase 2 Pune  E-Brochure.pdf
Kohinoor Teiko Hinjewadi Phase 2 Pune E-Brochure.pdfManishSaxena95
 
Best Interior Design Services in Haldwani
Best Interior Design Services in HaldwaniBest Interior Design Services in Haldwani
Best Interior Design Services in HaldwaniGeomatrix
 
Retail Space for Lease - 1221 W. Main St., Sun Prairie, WI
Retail Space for Lease - 1221 W. Main St., Sun Prairie, WIRetail Space for Lease - 1221 W. Main St., Sun Prairie, WI
Retail Space for Lease - 1221 W. Main St., Sun Prairie, WILee & Associates of Madison, WI
 
ACE Terra Yamuna Expressway | 8929888700
ACE Terra Yamuna Expressway | 8929888700ACE Terra Yamuna Expressway | 8929888700
ACE Terra Yamuna Expressway | 8929888700Truhomes
 

Último (20)

Kalpataru Exquisite Wakad Pune E-Brochure.pdf
Kalpataru Exquisite Wakad Pune  E-Brochure.pdfKalpataru Exquisite Wakad Pune  E-Brochure.pdf
Kalpataru Exquisite Wakad Pune E-Brochure.pdf
 
Jaipur Escorts 🥰 8617370543 Call Girls Offer VIP Hot Girls
Jaipur Escorts 🥰 8617370543 Call Girls Offer VIP Hot GirlsJaipur Escorts 🥰 8617370543 Call Girls Offer VIP Hot Girls
Jaipur Escorts 🥰 8617370543 Call Girls Offer VIP Hot Girls
 
Low rate ↬Call girls in Sabzi Mandi Delhi | 8447779280}Escort Service In All ...
Low rate ↬Call girls in Sabzi Mandi Delhi | 8447779280}Escort Service In All ...Low rate ↬Call girls in Sabzi Mandi Delhi | 8447779280}Escort Service In All ...
Low rate ↬Call girls in Sabzi Mandi Delhi | 8447779280}Escort Service In All ...
 
Eldeco Dwarka Project In Delhi-brochure.pdf.pdf
Eldeco Dwarka Project In Delhi-brochure.pdf.pdfEldeco Dwarka Project In Delhi-brochure.pdf.pdf
Eldeco Dwarka Project In Delhi-brochure.pdf.pdf
 
Low Rate ✨➥9711108085▻✨Call Girls In East Of Kailash (E.K) (Delhi)
Low Rate ✨➥9711108085▻✨Call Girls In East Of Kailash (E.K) (Delhi)Low Rate ✨➥9711108085▻✨Call Girls In East Of Kailash (E.K) (Delhi)
Low Rate ✨➥9711108085▻✨Call Girls In East Of Kailash (E.K) (Delhi)
 
BPTP THE AMAARIO Luxury Project Invest Like Royalty in Sector 37D Gurgaon Dwa...
BPTP THE AMAARIO Luxury Project Invest Like Royalty in Sector 37D Gurgaon Dwa...BPTP THE AMAARIO Luxury Project Invest Like Royalty in Sector 37D Gurgaon Dwa...
BPTP THE AMAARIO Luxury Project Invest Like Royalty in Sector 37D Gurgaon Dwa...
 
Prestige Sancoale Goa Residneces Brochure.pdf
Prestige Sancoale Goa Residneces Brochure.pdfPrestige Sancoale Goa Residneces Brochure.pdf
Prestige Sancoale Goa Residneces Brochure.pdf
 
BPTP THE AMAARIO For The Royals Of Tomorrow in Sector 37D Gurgaon Dwarka Expr...
BPTP THE AMAARIO For The Royals Of Tomorrow in Sector 37D Gurgaon Dwarka Expr...BPTP THE AMAARIO For The Royals Of Tomorrow in Sector 37D Gurgaon Dwarka Expr...
BPTP THE AMAARIO For The Royals Of Tomorrow in Sector 37D Gurgaon Dwarka Expr...
 
Call girls in Shakti Nagar Delhi~8447779280°/=@/ Short 1500 Night 6000}ESCORT...
Call girls in Shakti Nagar Delhi~8447779280°/=@/ Short 1500 Night 6000}ESCORT...Call girls in Shakti Nagar Delhi~8447779280°/=@/ Short 1500 Night 6000}ESCORT...
Call girls in Shakti Nagar Delhi~8447779280°/=@/ Short 1500 Night 6000}ESCORT...
 
Low Rate Call girls in Sant Nagar{Delhi }8447779280} Service Escorts In South...
Low Rate Call girls in Sant Nagar{Delhi }8447779280} Service Escorts In South...Low Rate Call girls in Sant Nagar{Delhi }8447779280} Service Escorts In South...
Low Rate Call girls in Sant Nagar{Delhi }8447779280} Service Escorts In South...
 
Bptp The Amaario Launch Luxury Project Sector 37D Gurgaon Dwarka Expressway...
Bptp The Amaario Launch  Luxury Project  Sector 37D Gurgaon Dwarka Expressway...Bptp The Amaario Launch  Luxury Project  Sector 37D Gurgaon Dwarka Expressway...
Bptp The Amaario Launch Luxury Project Sector 37D Gurgaon Dwarka Expressway...
 
Yedi Mavi TOBB Zeytinburnu - Listing Turkey
Yedi Mavi TOBB Zeytinburnu - Listing TurkeyYedi Mavi TOBB Zeytinburnu - Listing Turkey
Yedi Mavi TOBB Zeytinburnu - Listing Turkey
 
Cheap Rate ✨➥9582086666▻✨Call Girls In Gurgaon Sector 1 (Gurgaon)
Cheap Rate ✨➥9582086666▻✨Call Girls In Gurgaon Sector 1 (Gurgaon)Cheap Rate ✨➥9582086666▻✨Call Girls In Gurgaon Sector 1 (Gurgaon)
Cheap Rate ✨➥9582086666▻✨Call Girls In Gurgaon Sector 1 (Gurgaon)
 
Ganga Platinum Kharadi Pune brochure.pdf
Ganga Platinum Kharadi Pune brochure.pdfGanga Platinum Kharadi Pune brochure.pdf
Ganga Platinum Kharadi Pune brochure.pdf
 
The Gale at Godrej Park World Hinjewadi Pune Brochure.pdf
The Gale at Godrej Park World Hinjewadi Pune Brochure.pdfThe Gale at Godrej Park World Hinjewadi Pune Brochure.pdf
The Gale at Godrej Park World Hinjewadi Pune Brochure.pdf
 
Madhugiri Boucher Managed Farmland (knx)
Madhugiri Boucher Managed Farmland (knx)Madhugiri Boucher Managed Farmland (knx)
Madhugiri Boucher Managed Farmland (knx)
 
Kohinoor Teiko Hinjewadi Phase 2 Pune E-Brochure.pdf
Kohinoor Teiko Hinjewadi Phase 2 Pune  E-Brochure.pdfKohinoor Teiko Hinjewadi Phase 2 Pune  E-Brochure.pdf
Kohinoor Teiko Hinjewadi Phase 2 Pune E-Brochure.pdf
 
Best Interior Design Services in Haldwani
Best Interior Design Services in HaldwaniBest Interior Design Services in Haldwani
Best Interior Design Services in Haldwani
 
Retail Space for Lease - 1221 W. Main St., Sun Prairie, WI
Retail Space for Lease - 1221 W. Main St., Sun Prairie, WIRetail Space for Lease - 1221 W. Main St., Sun Prairie, WI
Retail Space for Lease - 1221 W. Main St., Sun Prairie, WI
 
ACE Terra Yamuna Expressway | 8929888700
ACE Terra Yamuna Expressway | 8929888700ACE Terra Yamuna Expressway | 8929888700
ACE Terra Yamuna Expressway | 8929888700
 

San Francisco market report May 2020

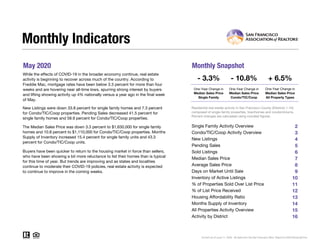
  • 1. May 2020 Monthly Snapshot One-Year Change in One-Year Change in Median Sales Price Single Family Median Sales Price Condo/TIC/Coop 2 3 4 5 6 7 8 9 10 11 12 13 14 15 16 Monthly Indicators - 3.3% - 10.8% + 6.5% One-Year Change in While the effects of COVID-19 in the broader economy continue, real estate activity is beginning to recover across much of the country. According to Freddie Mac, mortgage rates have been below 3.3 percent for more than four weeks and are hovering near all-time lows, spurring strong interest by buyers and lifting showing activity up 4% nationally versus a year ago in the final week of May. New Listings were down 33.8 percent for single family homes and 7.3 percent for Condo/TIC/Coop properties. Pending Sales decreased 41.5 percent for single family homes and 58.9 percent for Condo/TIC/Coop properties. The Median Sales Price was down 3.3 percent to $1,630,000 for single family homes and 10.8 percent to $1,110,000 for Condo/TIC/Coop properties. Months Supply of Inventory increased 15.4 percent for single family units and 43.3 percent for Condo/TIC/Coop units. Buyers have been quicker to return to the housing market in force than sellers, who have been showing a bit more reluctance to list their homes than is typical for this time of year. But trends are improving and as states and localities continue to moderate their COVID-19 policies, real estate activity is expected to continue to improve in the coming weeks. Median Sales Price All Property Types Residential real estate activity in San Francisco County (Districts 1-10) composed of single-family properties, townhomes and condominiums. Percent changes are calculated using rounded figures. Single Family Activity Overview Months Supply of Inventory Current as of June 11, 2020. All data from the San Francisco MLS. Report © 2020 ShowingTime. Condo/TIC/Coop Activity Overview Inventory of Active Listings % of Properties Sold Over List Price % of List Price Received Housing Affordability Ratio All Properties Activity Overview New Listings Pending Sales Sold Listings Median Sales Price Average Sales Price Days on Market Until Sale Activity by District
  • 2. Single Family Activity Overview Key metrics by report month and for year-to-date (YTD) starting from the first of the year. Key Metrics Historical Sparkbars 5-2019 5-2020 Percent Change YTD 2019 YTD 2020 Percent Change Current as of June 11, 2020. All data from the San Francisco MLS. Report © 2020 ShowingTime. | 2 Months Supply 2.6 3.0 + 15.4% -- -- -- Affordability Ratio 30 34 + 13.3% % of List Price Received 113.2% 106.1% - 6.3% 111.5% 31 69.6% - 6.5% - 1.2% 34 + 9.7% 110.2% % of Properties Sold Over List Price 79.9% 62.9% - 21.3% 74.4% Active Listings 474 473 - 0.2% -- Avg. Sales Price $2,141,318 $1,900,955 - 11.2% $2,065,405 Days on Market 22 24 + 9.1% 27 25 - 7.4% $2,093,948 -- -- Median Sales Price $1,685,000 $1,630,000 - 3.3% $1,600,000 Sold Listings 239 105 - 56.1% 850 New Listings 275 182 - 33.8% 1,183 Pending Sales 248 145 - 41.5% - 33.7%913 605 - 24.3%895 579 - 31.9% $1,618,000 + 1.1% + 1.4% 5-2017 5-2018 5-2019 5-2020 5-2017 5-2018 5-2019 5-2020 5-2017 5-2018 5-2019 5-2020 5-2017 5-2018 5-2019 5-2020 5-2017 5-2018 5-2019 5-2020 5-2017 5-2018 5-2019 5-2020 5-2017 5-2018 5-2019 5-2020 5-2017 5-2018 5-2019 5-2020 5-2017 5-2018 5-2019 5-2020 5-2017 5-2018 5-2019 5-2020 5-2017 5-2018 5-2019 5-2020
  • 3. Condo/TIC/Coop Activity Overview Key metrics by report month and for year-to-date (YTD) starting from the first of the year. Key Metrics Historical Sparkbars 5-2019 5-2020 Percent Change YTD 2019 YTD 2020 Percent Change Current as of June 11, 2020. All data from the San Francisco MLS. Report © 2020 ShowingTime. | 3 Months Supply 3.0 4.3 + 43.3% -- -- -- Affordability Ratio 47 58 + 23.4% % of List Price Received 107.4% 100.5% - 6.4% 105.1% 49 53.0% - 6.2% - 1.6% 52 + 6.1% 103.4% % of Properties Sold Over List Price 65.0% 42.3% - 34.9% 56.5% Active Listings 730 854 + 17.0% -- Avg. Sales Price $1,335,560 $1,311,712 - 1.8% $1,331,679 Days on Market 29 40 + 37.9% 37 $1,237,500 + 3.1% + 2.5% 37 0.0% $1,365,510 -- -- Sold Listings 337 104 - 69.1% 1,199 774 - 35.4% Median Sales Price $1,245,000 $1,110,000 - 10.8% $1,200,000 - 16.0% Pending Sales 336 138 - 58.9% 1,295 804 - 37.9% New Listings 368 341 - 7.3% 1,760 1,478 5-2017 5-2018 5-2019 5-2020 5-2017 5-2018 5-2019 5-2020 5-2017 5-2018 5-2019 5-2020 5-2017 5-2018 5-2019 5-2020 5-2017 5-2018 5-2019 5-2020 5-2017 5-2018 5-2019 5-2020 5-2017 5-2018 5-2019 5-2020 5-2017 5-2018 5-2019 5-2020 5-2017 5-2018 5-2019 5-2020 5-2017 5-2018 5-2019 5-2020 5-2017 5-2018 5-2019 5-2020
  • 4. New Listings New Listings Single Family Year-Over-Year Change Condo/TIC/ Coop Year-Over-Year Change Jun-2019 233 -12.1% 287 -19.8% Jul-2019 197 -17.6% 320 +22.1% Aug-2019 245 -2.0% 329 +5.8% Sep-2019 308 -8.9% 508 +11.9% Oct-2019 244 -5.4% 342 +0.3% Nov-2019 134 -15.7% 156 -20.4% Dec-2019 82 0.0% 130 +6.6% Jan-2020 209 -7.1% 352 -1.7% Feb-2020 229 +21.2% 365 +19.3% Mar-2020 143 -40.9% 226 -35.6% Apr-2020 132 -47.6% 194 -48.5% May-2020 182 -33.8% 341 -7.3% 12-Month Avg 195 -15.7% 296 -6.7% Historical New Listings by Month Current as of June 11, 2020. All data from the San Francisco MLS. Report © 2020 ShowingTime. | 4 A count of the properties that have been newly listed on the market in a given month. 271 370 275 368 182 341 Single Family Condo/TIC/Coop May 0 100 200 300 400 500 600 700 1-2005 1-2006 1-2007 1-2008 1-2009 1-2010 1-2011 1-2012 1-2013 1-2014 1-2015 1-2016 1-2017 1-2018 1-2019 1-2020 Single Family Condo/TIC/Coop 1,217 1,853 1,183 1,760 895 1,478 Single Family Condo/TIC/Coop Year to Date 2018 2019 2020 - 7.3%- 0.5%- 33.8%+ 1.5% - 5.0%- 24.3%- 2.8% - 16.0% 2018 2019 2020 2018 2019 2020 2018 2019 2020 - 5.6% + 3.6% + 11.9%+ 2.5%
  • 5. Pending Sales Pending Sales Single Family Year-Over-Year Change Condo/TIC/ Coop Year-Over-Year Change Jun-2019 194 -4.9% 245 -18.9% Jul-2019 182 +10.3% 207 -16.2% Aug-2019 150 -11.8% 212 -8.6% Sep-2019 195 +1.0% 229 +4.6% Oct-2019 247 -1.6% 303 +4.1% Nov-2019 190 +1.6% 234 +5.4% Dec-2019 114 -5.8% 155 +5.4% Jan-2020 101 +13.5% 157 +29.8% Feb-2020 135 -6.3% 236 +3.5% Mar-2020 153 -27.1% 184 -38.5% Apr-2020 71 -68.0% 89 -71.4% May-2020 145 -41.5% 138 -58.9% 12-Month Avg 156 -14.8% 199 -19.2% Historical Pending Sales by Month A count of the properties on which offers have been accepted in a given month. Current as of June 11, 2020. All data from the San Francisco MLS. Report © 2020 ShowingTime. | 5 275 297 248 336 145 138 Single Family Condo/TIC/Coop May 0 100 200 300 400 1-2005 1-2006 1-2007 1-2008 1-2009 1-2010 1-2011 1-2012 1-2013 1-2014 1-2015 1-2016 1-2017 1-2018 1-2019 1-2020 Single Family Condo/TIC/Coop 942 1,324 913 1,295 605 804 Single Family Condo/TIC/Coop Year to Date 2018 2019 2020 - 58.9%+ 13.1%- 41.5%- 9.8% - 2.2%- 33.7%- 3.1% - 37.9% 2018 2019 2020 2018 2019 2020 2018 2019 2020 + 14.6% + 7.2% + 11.4%- 2.9%
  • 6. Sold Listings Sold Listings Single Family Year-Over-Year Change Condo/TIC/ Coop Year-Over-Year Change Jun-2019 190 -17.7% 265 -12.5% Jul-2019 213 +10.9% 244 -10.9% Aug-2019 168 -12.0% 207 -20.4% Sep-2019 127 -13.6% 192 +4.9% Oct-2019 255 +2.8% 259 -11.6% Nov-2019 200 -9.1% 272 +3.0% Dec-2019 175 +9.4% 216 +11.3% Jan-2020 96 -4.0% 150 +31.6% Feb-2020 115 +1.8% 179 +9.1% Mar-2020 161 -6.4% 227 -14.3% Apr-2020 102 -54.9% 114 -64.3% May-2020 105 -56.1% 104 -69.1% 12-Month Avg 159 -14.8% 202 -18.2% Historical Sold Listings by Month A count of the actual sales that closed in a given month. Current as of June 11, 2020. All data from the San Francisco MLS. Report © 2020 ShowingTime. | 6 249 312 239 337 105 104 Single Family Condo/TIC/Coop May 0 100 200 300 400 1-2005 1-2006 1-2007 1-2008 1-2009 1-2010 1-2011 1-2012 1-2013 1-2014 1-2015 1-2016 1-2017 1-2018 1-2019 1-2020 Single Family Condo/TIC/Coop 841 1,248 850 1,199 579 774 Single Family Condo/TIC/Coop Year to Date 2018 2019 2020 - 69.1%+ 8.0%- 56.1%- 4.0% - 3.9%- 31.9%+ 1.1% - 35.4% 2018 2019 2020 2018 2019 2020 2018 2019 2020 + 14.2% + 3.7% + 13.7%+ 14.7%
  • 7. Median Sales Price Median Sales Price Single Family Year-Over-Year Change Condo/TIC/ Coop Year-Over-Year Change Jun-2019 $1,750,000 +7.7% $1,299,000 +11.0% Jul-2019 $1,576,000 -3.1% $1,222,444 +6.3% Aug-2019 $1,602,500 +4.2% $1,281,250 +3.8% Sep-2019 $1,530,000 +2.0% $1,325,000 +15.2% Oct-2019 $1,650,000 +3.1% $1,325,000 +9.1% Nov-2019 $1,604,000 +12.4% $1,180,000 -1.1% Dec-2019 $1,450,000 -2.8% $1,198,283 +2.4% Jan-2020 $1,462,500 +5.3% $1,172,000 +12.7% Feb-2020 $1,610,000 +7.3% $1,300,000 +15.0% Mar-2020 $1,650,000 0.0% $1,265,000 +1.6% Apr-2020 $1,699,500 +5.4% $1,294,000 +5.6% May-2020 $1,630,000 -3.3% $1,110,000 -10.8% 12-Month Avg* $1,601,539 +1.7% $1,255,000 +4.6% Historical Median Sales Price by Month Point at which half of the sales sold for more and half sold for less, not accounting for seller concessions, in a given month. * Median Sales Price for all properties from June 2019 through May 2020. This is not the average of the individual figures above. Current as of June 11, 2020. All data from the San Francisco MLS. Report © 2020 ShowingTime. | 7 $1,618,888 $1,257,500 $1,685,000 $1,245,000 $1,630,000 $1,110,000 Single Family Condo/TIC/Coop May $500,000 $750,000 $1,000,000 $1,250,000 $1,500,000 $1,750,000 $2,000,000 1-2005 1-2006 1-2007 1-2008 1-2009 1-2010 1-2011 1-2012 1-2013 1-2014 1-2015 1-2016 1-2017 1-2018 1-2019 1-2020 Single Family Condo/TIC/Coop $1,615,000 $1,215,000 $1,600,000 $1,200,000 $1,618,000 $1,237,500 Single Family Condo/TIC/Coop Year to Date 2018 2019 2020 - 10.8%- 1.0%- 3.3%+ 4.1% - 1.2%+ 1.1%- 0.9% + 3.1% 2018 2019 2020 2018 2019 2020 2018 2019 2020 + 9.8% + 18.7% + 7.6%+ 7.6%
  • 8. Average Sales Price Avg. Sales Price Single Family Year-Over-Year Change Condo/TIC/ Coop Year-Over-Year Change Jun-2019 $2,148,466 +10.6% $1,431,991 +7.1% Jul-2019 $1,959,574 -0.5% $1,310,687 +5.8% Aug-2019 $1,872,478 +3.3% $1,386,808 +2.9% Sep-2019 $2,065,723 +13.6% $1,449,604 +15.4% Oct-2019 $1,912,555 -11.1% $1,447,421 +7.8% Nov-2019 $1,986,456 +6.6% $1,322,998 +4.7% Dec-2019 $1,948,749 +9.1% $1,261,689 -5.1% Jan-2020 $2,212,609 +26.3% $1,319,209 +12.1% Feb-2020 $1,953,875 +4.4% $1,404,496 +3.0% Mar-2020 $2,089,204 +2.1% $1,381,742 +3.4% Apr-2020 $2,346,348 +5.0% $1,381,974 +1.4% May-2020 $1,900,955 -11.2% $1,311,712 -1.8% 12-Month Avg* $2,014,127 +1.9% $1,370,459 +4.2% Historical Average Sales Price by Month Average sales price for all closed sales, not accounting for seller concessions, in a given month. * Avg. Sales Price for all properties from June 2019 through May 2020. This is not the average of the individual figures above. Current as of June 11, 2020. All data from the San Francisco MLS. Report © 2020 ShowingTime. | 8 $2,020,490 $1,399,046 $2,141,318 $1,335,560 $1,900,955 $1,311,712 Single Family Condo/TIC/Coop May $500,000 $1,000,000 $1,500,000 $2,000,000 $2,500,000 1-2005 1-2006 1-2007 1-2008 1-2009 1-2010 1-2011 1-2012 1-2013 1-2014 1-2015 1-2016 1-2017 1-2018 1-2019 1-2020 Single Family Condo/TIC/Coop $2,025,563 $1,346,516 $2,065,405 $1,331,679 $2,093,948 $1,365,510 Single Family Condo/TIC/Coop Year to Date 2018 2019 2020 - 1.8%- 4.5%- 11.2%+ 6.0% - 1.1%+ 1.4%+ 2.0% + 2.5% 2018 2019 2020 2018 2019 2020 2018 2019 2020 + 10.1% + 11.8% + 3.9%+ 3.9%
  • 9. Days on Market Until Sale Days on Market Single Family Year-Over-Year Change Condo/TIC/ Coop Year-Over-Year Change Jun-2019 22 +22.2% 31 +14.8% Jul-2019 23 +9.5% 33 +6.5% Aug-2019 25 +13.6% 33 -8.3% Sep-2019 28 +16.7% 34 +13.3% Oct-2019 22 -8.3% 28 +3.7% Nov-2019 24 -7.7% 34 -10.5% Dec-2019 31 -6.1% 49 +11.4% Jan-2020 38 -2.6% 62 +12.7% Feb-2020 25 -13.8% 29 -27.5% Mar-2020 20 -23.1% 27 -22.9% Apr-2020 21 -19.2% 32 -15.8% May-2020 24 +9.1% 40 +37.9% 12-Month Avg* 25 -0.9% 35 +2.2% Historical Days on Market Until Sale by Month Average number of days between when a property is listed and when an offer is accepted in a given month. * Days on Market for all properties from June 2019 through May 2020. This is not the average of the individual figures above. Current as of June 11, 2020. All data from the San Francisco MLS. Report © 2020 ShowingTime. | 9 20 27 22 29 24 40 Single Family Condo/TIC/Coop May 0 20 40 60 80 100 120 1-2005 1-2006 1-2007 1-2008 1-2009 1-2010 1-2011 1-2012 1-2013 1-2014 1-2015 1-2016 1-2017 1-2018 1-2019 1-2020 Single Family Condo/TIC/Coop 22 32 27 37 25 37 Single Family Condo/TIC/Coop Year to Date 2018 2019 2020 + 37.9%+ 7.4%+ 9.1%+ 10.0% + 15.6%- 7.4%+ 22.7% 0.0% 2018 2019 2020 2018 2019 2020 2018 2019 2020 - 16.7% - 26.7% - 13.5%- 18.2%
  • 10. Inventory of Active Listings Active Listings Single Family Year-Over-Year Change Condo/TIC/ Coop Year-Over-Year Change Jun-2019 492 +14.4% 714 -0.3% Jul-2019 464 +0.4% 731 +11.1% Aug-2019 515 +4.7% 756 +12.7% Sep-2019 590 -0.5% 960 +12.8% Oct-2019 542 0.0% 914 +9.3% Nov-2019 439 -5.4% 747 +4.5% Dec-2019 324 -1.5% 545 +7.3% Jan-2020 414 -7.6% 705 +2.3% Feb-2020 492 +6.7% 779 +8.3% Mar-2020 427 -9.1% 671 -6.2% Apr-2020 460 -4.8% 722 -1.8% May-2020 473 -0.2% 854 +17.0% 12-Month Avg* 469 -0.3% 758 +6.5% Historical Inventory of Active Listings by Month The number of properties available for sale in active status at the end of a given month. * Active Listings for all properties from June 2019 through May 2020. This is not the average of the individual figures above. Current as of June 11, 2020. All data from the San Francisco MLS. Report © 2020 ShowingTime. | 10 406 724 474 730 473 854 Single Family Condo/TIC/Coop May 0 250 500 750 1,000 1,250 1,500 1-2005 1-2006 1-2007 1-2008 1-2009 1-2010 1-2011 1-2012 1-2013 1-2014 1-2015 1-2016 1-2017 1-2018 1-2019 1-2020 Single Family Condo/TIC/Coop 2018 2019 2020 + 17.0%+ 0.8%- 0.2%+ 16.7% 2018 2019 2020 - 5.4% + 9.5%
  • 11. % of Properties Sold Over List Price % of Properties Sold Over List Price Single Family Year-Over-Year Change Condo/TIC/ Coop Year-Over-Year Change Jun-2019 81.1% -8.2% 64.5% -5.6% Jul-2019 82.6% -3.3% 70.5% +11.7% Aug-2019 82.1% +1.9% 58.9% +2.1% Sep-2019 74.0% -8.6% 59.4% -6.3% Oct-2019 80.8% -2.3% 65.3% -4.4% Nov-2019 77.5% +5.3% 64.3% +18.0% Dec-2019 66.3% -2.6% 47.7% +3.9% Jan-2020 60.4% +0.7% 33.3% -19.2% Feb-2020 72.2% -7.3% 62.6% +18.1% Mar-2020 78.3% +6.8% 59.9% +7.3% Apr-2020 68.6% -7.2% 59.6% +8.0% May-2020 62.9% -21.3% 42.3% -34.9% 12-Month Avg 75.6% -3.2% 59.1% -0.0% Historical % of Properties Sold Over List Price by Month Percentage found when dividing the number of properties sold by properties sold over its original list price, not accounting for seller concessions. * % of Properties Sold Over List Price for all properties from June 2019 through May 2020. This is not the average of the individual figures above. Current as of June 11, 2020. All data from the San Francisco MLS. Report © 2020 ShowingTime. | 11 84.7% 67.6% 79.9% 65.0%62.9% 42.3% Single Family Condo/TIC/Coop May 0.0% 20.0% 40.0% 60.0% 80.0% 100.0% 1-2005 1-2006 1-2007 1-2008 1-2009 1-2010 1-2011 1-2012 1-2013 1-2014 1-2015 1-2016 1-2017 1-2018 1-2019 1-2020 Single Family Condo/TIC/Coop 79.2% 59.9% 74.4% 56.5% 69.6% 53.0% Single Family Condo/TIC/Coop Year to Date 2018 2019 2020 - 34.9%- 3.8%- 21.3%- 5.7% - 5.7%- 6.5%- 6.1% - 6.2% 2018 2019 2020 2018 2019 2020 2018 2019 2020 + 7.4% + 5.2% + 3.5%+ 10.8%
  • 12. % of List Price Received % of List Price Received Single Family Year-Over-Year Change Condo/TIC/ Coop Year-Over-Year Change Jun-2019 115.3% -4.0% 107.2% -0.1% Jul-2019 115.4% -1.5% 107.6% +0.5% Aug-2019 115.3% +0.4% 105.8% +0.2% Sep-2019 112.4% -2.5% 105.2% -1.2% Oct-2019 114.0% 0.0% 105.9% -1.7% Nov-2019 111.9% +0.6% 105.1% +1.0% Dec-2019 109.7% -0.7% 103.1% +1.0% Jan-2020 107.1% +1.0% 100.4% -0.6% Feb-2020 111.9% -0.6% 105.2% +1.0% Mar-2020 114.4% +3.5% 104.3% -0.4% Apr-2020 108.8% -3.2% 105.5% +0.6% May-2020 106.1% -6.3% 100.5% -6.4% 12-Month Avg* 112.5% -0.9% 105.0% -0.6% Historical % of List Price Received by Month Percentage found when dividing a property’s sales price by its most recent list price, then taking the average for all properties sold in a given month, not accounting for seller concessions. * % of List Price Received for all properties from June 2019 through May 2020. This is not the average of the individual figures above. Current as of June 11, 2020. All data from the San Francisco MLS. Report © 2020 ShowingTime. | 12 119.5% 108.4% 113.2% 107.4%106.1% 100.5% Single Family Condo/TIC/Coop May 117.7% 106.9% 111.5% 105.1% 110.2% 103.4% Single Family Condo/TIC/Coop Year to Date 90.0% 100.0% 110.0% 120.0% 130.0% 1-2005 1-2006 1-2007 1-2008 1-2009 1-2010 1-2011 1-2012 1-2013 1-2014 1-2015 1-2016 1-2017 1-2018 1-2019 1-2020 Single Family Condo/TIC/Coop 2018 2019 2020 - 6.4%- 0.9%- 6.3%- 5.3% 2018 2019 2020 + 3.6% + 2.8% 2018 2019 2020 - 1.6%- 1.7%- 1.2%- 5.3% 2018 2019 2020 + 3.7% + 2.4%
  • 13. Housing Affordability Ratio Affordability Ratio Single Family Year-Over-Year Change Condo/TIC/ Coop Year-Over-Year Change Jun-2019 29 -3.3% 45 -6.3% Jul-2019 33 +10.0% 49 0.0% Aug-2019 34 +9.7% 49 +8.9% Sep-2019 35 +12.9% 47 0.0% Oct-2019 33 +17.9% 48 +17.1% Nov-2019 33 +3.1% 52 +20.9% Dec-2019 36 +9.1% 51 +6.3% Jan-2020 37 +5.7% 54 0.0% Feb-2020 34 +3.0% 49 -3.9% Mar-2020 32 +6.7% 49 +4.3% Apr-2020 32 +3.2% 50 +4.2% May-2020 34 +13.3% 58 +23.4% 12-Month Avg* 33 +9.0% 31 +22.5% Historical Housing Affordability Ratio by Month This index measures housing affordability for the region. For example, an index of 120 means the median household income is 120% of what is necessary to qualify for the median-priced home under prevailing interest rates. A higher number means greater affordability. * Affordability Ratio for all properties from June 2019 through May 2020. This is not the average of the individual figures above. Current as of June 11, 2020. All data from the San Francisco MLS. Report © 2020 ShowingTime. | 13 30 44 30 47 34 58 Single Family Condo/TIC/Coop May 20 40 60 80 100 1-2005 1-2006 1-2007 1-2008 1-2009 1-2010 1-2011 1-2012 1-2013 1-2014 1-2015 1-2016 1-2017 1-2018 1-2019 1-2020 Single Family Condo/TIC/Coop 2018 2019 2020 + 23.4%+ 6.8%+ 13.3%0.0% 2018 2019 2020 - 14.3% - 13.7% 30 46 31 49 34 52 Single Family Condo/TIC/Coop Year to Date 2018 2019 2020 + 6.1%+ 6.5%+ 9.7%+ 3.3% 2018 2019 2020 - 21.1% - 13.2%
  • 14. Months Supply of Inventory Months Supply Single Family Year-Over-Year Change Condo/TIC/ Coop Year-Over-Year Change Jun-2019 2.7 +17.4% 3.0 +7.1% Jul-2019 2.5 +4.2% 3.1 +19.2% Aug-2019 2.8 +7.7% 3.2 +23.1% Sep-2019 3.2 0.0% 4.0 +21.2% Oct-2019 3.0 +3.4% 3.8 +15.2% Nov-2019 2.4 -4.0% 3.1 +10.7% Dec-2019 1.8 0.0% 2.3 +15.0% Jan-2020 2.3 -4.2% 2.9 +3.6% Feb-2020 2.7 +8.0% 3.2 +10.3% Mar-2020 2.4 -4.0% 2.9 -3.3% Apr-2020 2.8 +7.7% 3.3 +10.0% May-2020 3.0 +15.4% 4.3 +43.3% 12-Month Avg* 2.6 +4.1% 3.3 +14.4% Historical Months Supply of Inventory by Month The inventory of homes for sale at the end of a given month, divided by the average monthly pending sales from the last 12 months. * Months Supply for all properties from June 2019 through May 2020. This is not the average of the individual figures above. Current as of June 11, 2020. All data from the San Francisco MLS. Report © 2020 ShowingTime. | 14 2.1 2.9 2.6 3.03.0 4.3 Single Family Condo/TIC/Coop May 0.0 2.0 4.0 6.0 8.0 10.0 1-2005 1-2006 1-2007 1-2008 1-2009 1-2010 1-2011 1-2012 1-2013 1-2014 1-2015 1-2016 1-2017 1-2018 1-2019 1-2020 Single Family Condo/TIC/Coop 2018 2019 2020 + 43.3%+ 3.4%+ 15.4%+ 23.8% 2018 2019 2020 - 8.7% + 3.6%
  • 15. All Properties Activity Overview Key metrics by report month and for year-to-date (YTD) starting from the first of the year. Key Metrics Historical Sparkbars 5-2019 5-2020 Percent Change YTD 2019 YTD 2020 Percent Change Current as of June 11, 2020. All data from the San Francisco MLS. Report © 2020 ShowingTime. | 15 Months Supply 2.8 3.7 + 32.1% -- -- -- Affordability Ratio 35 41 + 17.1% % of List Price Received 109.8% 103.3% - 5.9% 107.8% 36 60.1% - 5.9% - 1.4% 39 + 8.3% 106.3% % of Properties Sold Over List Price 71.2% 52.6% - 26.1% 63.9% Active Listings 1,204 1,327 + 10.2% -- Avg. Sales Price $1,669,893 $1,607,743 - 3.7% $1,636,056 Days on Market 26 32 + 23.1% 33 $1,410,000 + 4.2% + 2.5% 32 - 3.0% $1,677,236 -- -- Sold Listings 576 209 - 63.7% 2,049 1,353 - 34.0% Median Sales Price $1,385,000 $1,475,000 + 6.5% $1,353,000 - 19.4% Pending Sales 584 283 - 51.5% 2,208 1,409 - 36.2% New Listings 643 523 - 18.7% 2,943 2,373 5-2017 5-2018 5-2019 5-2020 5-2017 5-2018 5-2019 5-2020 5-2017 5-2018 5-2019 5-2020 5-2017 5-2018 5-2019 5-2020 5-2017 5-2018 5-2019 5-2020 5-2017 5-2018 5-2019 5-2020 5-2017 5-2018 5-2019 5-2020 5-2017 5-2018 5-2019 5-2020 5-2017 5-2018 5-2019 5-2020 5-2017 5-2018 5-2019 5-2020 5-2017 5-2018 5-2019 5-2020
  • 16. Activity by District SF District 1: Northwest (Sea Cliff, Lake, Jordan Park / Laurel Heights, Outer Richmond, Central Richmond, Inner Richmond, Lone Mountain) SF District 2: Central West (Outer Sunset, Central Sunset, Inner Sunset, Outer Parkside, Parkside, Inner Parkside, Golden Gate Heights) SF District 3: Southwest (Pine Lake Park, Lake Shore, Merced Manor, Stonestown, Lakeside, Merced Heights, Ingleside, Ingleside Heights, Oceanview) SF District 4: Twin Peaks W (Forest Hill (& Ext), W Portal, St Francis Wd, Balboa Terr, Mt Dav Manor, Ingleside Terr, Monterey Hts, Wstwd Pk & H'lnds, Shrwd Fst, Miraloma Pk, Dmnd Hts, Mdtwn Terr) SF District 5: Central (Haight Ashbury, Cole Vly / Prnssus Hts, Clarndn Hts, Corona Hts, Twin Pks, Glen Pk, Noe Vly, Eureka Vly / Dolores Hts, Mission Dolores, Duboce Trngl, Buena Vista / Ashbury Hts) SF District 6: Central North (Lower Pacific Heights, Anza Vista, Western Addition, North Panhandle, Alamo Square, Hayes Valley) SF District 7: North (Marina, Cow Hollow, Presidio Heights, Pacific Heights) SF District 8: Northeast (North Waterfront, North Beach, Russian Hill, Telegraph Hill, Nob Hill, Financial District / Barbary Coast, Downtown, Van Ness / Civic Center, Tenderloin) SF District 9: Central East (Yerba Buena, South Beach, South of Market, Mission Bay, Inner Mission, Potrero Hill, Central Waterfront / Dogpatch, Bernal Heights) SF District 10: Southeast (Outer Mission, Mission Terr, Excelsior, Portola, Bayview, Silver Terr, Hunters Pt, Candlestick Pt, Bayview Hts, Little Hollywood, Visitation Vly, Crocker Amazon) 5-2019 5-2020 + / – 5-2019 5-2020 + / – 5-2019 5-2020 + / – 5-2019 5-2020 + / – 5-2019 5-2020 + / – Single Family 1 SF District 1 32 41 +28.1% 22 10 -54.5% $2,520,000 $1,824,500 -27.6% 23 27 +17.4% 2.0 2.9 +45.0% 2 SF District 2 69 38 -44.9% 43 26 -39.5% $1,695,000 $1,425,500 -15.9% 19 23 +21.1% 2.2 1.3 -40.9% 3 SF District 3 30 25 -16.7% 13 8 -38.5% $1,305,000 $1,335,000 +2.3% 18 23 +27.8% 2.5 2.3 -8.0% 4 SF District 4 44 42 -4.5% 35 15 -57.1% $1,685,000 $1,980,000 +17.5% 21 18 -14.3% 1.6 2.0 +25.0% 5 SF District 5 79 101 +27.8% 29 18 -37.9% $2,900,000 $2,187,500 -24.6% 27 16 -40.7% 2.9 4.2 +44.8% 6 SF District 6 19 18 -5.3% 4 3 -25.0% $3,177,500 $3,750,000 +18.0% 22 66 +200.0% 4.6 6.0 +30.4% 7 SF District 7 34 45 +32.4% 15 2 -86.7% $4,150,000 $2,376,925 -42.7% 43 13 -69.8% 4.0 6.9 +72.5% 8 SF District 8 19 28 +47.4% 5 0 -100.0% $4,600,000 $0 -100.0% 27 0 -100.0% 8.4 14.0 +66.7% 9 SF District 9 65 55 -15.4% 29 12 -58.6% $1,500,000 $1,795,000 +19.7% 15 24 +60.0% 3.4 3.3 -2.9% 10 SF District 10 83 80 -3.6% 44 11 -75.0% $1,150,000 $1,225,000 +6.5% 23 38 +65.2% 2.3 2.7 +17.4% Condo/TIC/Coop 1 SF District 1 30 33 +10.0% 14 8 -42.9% $1,447,500 $932,500 -35.6% 27 44 +63.0% 2.1 3.0 +42.9% 2 SF District 2 6 9 +50.0% 4 0 -100.0% $1,315,000 $0 -100.0% 18 0 -100.0% 1.5 2.2 +46.7% 3 SF District 3 7 6 -14.3% 5 1 -80.0% $1,220,000 $825,000 -32.4% 50 48 -4.0% 2.1 2.1 0.0% 4 SF District 4 7 7 0.0% 13 3 -76.9% $879,000 $1,151,000 +30.9% 40 41 +2.5% 1.3 1.4 +7.7% 5 SF District 5 83 90 +8.4% 51 24 -52.9% $1,455,000 $1,467,500 +0.9% 16 34 +112.5% 2.3 2.8 +21.7% 6 SF District 6 63 60 -4.8% 34 11 -67.6% $1,187,500 $1,230,000 +3.6% 19 33 +73.7% 3.0 3.2 +6.7% 7 SF District 7 58 79 +36.2% 26 13 -50.0% $2,125,000 $1,495,000 -29.6% 33 34 +3.0% 2.4 3.5 +45.8% 8 SF District 8 179 177 -1.1% 51 13 -74.5% $1,150,000 $1,280,000 +11.3% 39 57 +46.2% 4.2 5.6 +33.3% 9 SF District 9 258 351 +36.0% 131 29 -77.9% $1,185,000 $920,000 -22.4% 31 41 +32.3% 2.9 5.1 +75.9% 10 SF District 10 39 42 +7.7% 8 2 -75.0% $825,000 $649,000 -21.3% 25 19 -24.0% 6.6 9.0 +36.4% Key metrics by report month for the districts of San Fransisco. Current as of June 11, 2020. All data from the San Francisco MLS. Report © 2020 ShowingTime. | 16 Active Listings Sold Listings Median Sales Price Days on Market Months Supply