San Francisco Residential Real Estate Market Data November 2012
•
0 recomendaciones•382 vistas

San Francisco Residential Real Estate Market Data November 2012

Recomendados
Recomendados
Más contenido relacionado
La actualidad más candente
La actualidad más candente (15)
Destacado
Destacado (9)
Similar a San Francisco Residential Real Estate Market Data November 2012
Similar a San Francisco Residential Real Estate Market Data November 2012 (20)
Más de Ronny Budiutama
Más de Ronny Budiutama (20)
Último
Último (20)
San Francisco Residential Real Estate Market Data November 2012
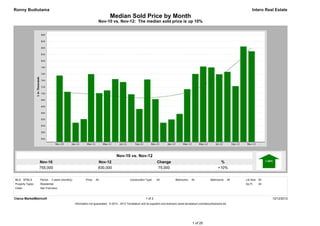
- 1. Ronny Budiutama Intero Real Estate Median Sold Price by Month Nov-10 vs. Nov-12: The median sold price is up 10% Nov-10 vs. Nov-12 Nov-10 Nov-12 Change % 755,000 830,000 75,000 +10% MLS: SFMLS Period: 2 years (monthly) Price: All Construction Type: All Bedrooms: All Bathrooms: All Lot Size: All Property Types: Residential Sq Ft: All Cities: San Francisco Clarus MarketMetrics® 1 of 2 12/12/2012 Information not guaranteed. © 2012 - 2013 Terradatum and its suppliers and licensors (www.terradatum.com/about/licensors.td). 1 of 20
- 2. Ronny Budiutama Intero Real Estate Median Sold Price by Month Nov-10 vs. Nov-12: The median sold price is up 10% Time Period Median Price # Units Average DOM Nov-12 830,000 263 42 Oct-12 844,500 250 45 Sep-12 722,500 178 46 Aug-12 766,500 240 50 Jul-12 759,000 216 47 Jun-12 780,000 267 60 May-12 783,000 236 47 Apr-12 760,000 221 54 Mar-12 713,250 222 64 Feb-12 637,000 181 63 Jan-12 620,000 129 81 Dec-11 610,000 231 63 Nov-11 682,500 232 57 Oct-11 743,000 201 54 Sep-11 652,325 211 65 Aug-11 697,620 209 64 Jul-11 735,000 205 62 Jun-11 744,225 264 59 May-11 709,500 222 63 Apr-11 701,000 197 67 Mar-11 759,500 216 65 Feb-11 621,000 124 83 Jan-11 610,000 161 71 Dec-10 705,000 231 66 Nov-10 755,000 184 59 Clarus MarketMetrics® 2 of 2 12/12/2012 Information not guaranteed. © 2012 - 2013 Terradatum and its suppliers and licensors (www.terradatum.com/about/licensors.td). 2 of 20
- 3. Ronny Budiutama Intero Real Estate Median For Sale vs. Median Sold Nov-10 vs. Nov-12: The median price of for sale properties is up 22% and the median price of sold properties is up 10% Nov-10 vs. Nov-12 Nov-10 vs. Nov-12 Nov-10 Nov-12 Change % Nov-10 Nov-12 Change % 699,000 850,000 151,000 +22% 755,000 830,000 75,000 +10% MLS: SFMLS Period: 2 years (monthly) Price: All Construction Type: All Bedrooms: All Bathrooms: All Lot Size: All Property Types: Residential Sq Ft: All Cities: San Francisco Clarus MarketMetrics® 1 of 2 12/12/2012 Information not guaranteed. © 2012 - 2013 Terradatum and its suppliers and licensors (www.terradatum.com/about/licensors.td). 3 of 20
- 4. Ronny Budiutama Intero Real Estate Median For Sale vs. Median Sold Nov-10 vs. Nov-12: The median price of for sale properties is up 22% and the median price of sold properties is up 10% For Sale # Properties Sold # Properties Price Time Period Median For Sale Median Sold Difference Nov-12 850,000 520 830,000 263 -20,000 Oct-12 834,500 696 844,500 250 10,000 Sep-12 858,000 669 722,500 178 -135,500 Aug-12 799,000 595 766,500 240 -32,500 Jul-12 789,000 627 759,000 216 -30,000 Jun-12 799,000 636 780,000 267 -19,000 May-12 750,000 705 783,000 236 33,000 Apr-12 699,000 705 760,000 221 61,000 Mar-12 699,000 734 713,250 222 14,250 Feb-12 699,000 689 637,000 181 -62,000 Jan-12 649,000 635 620,000 129 -29,000 Dec-11 659,000 640 610,000 231 -49,000 Nov-11 678,000 833 682,500 232 4,500 Oct-11 668,000 1,013 743,000 201 75,000 Sep-11 674,498 1,056 652,325 211 -22,172 Aug-11 650,000 971 697,620 209 47,620 Jul-11 659,000 1,001 735,000 205 76,000 Jun-11 678,000 976 744,225 264 66,225 May-11 689,000 914 709,500 222 20,500 Apr-11 699,000 924 701,000 197 2,000 Mar-11 675,000 919 759,500 216 84,500 Feb-11 666,500 820 621,000 124 -45,500 Jan-11 649,000 763 610,000 161 -39,000 Dec-10 659,900 819 705,000 231 45,100 Nov-10 699,000 1,038 755,000 184 56,000 Clarus MarketMetrics® 2 of 2 12/12/2012 Information not guaranteed. © 2012 - 2013 Terradatum and its suppliers and licensors (www.terradatum.com/about/licensors.td). 4 of 20
- 5. Ronny Budiutama Intero Real Estate Sold Properties by Month Nov-10 vs. Nov-12: The number of Sold properties is up 43% Nov-10 vs. Nov-12 Nov-10 Nov-12 Change % 184 263 79 +43% MLS: SFMLS Period: 2 years (monthly) Price: All Construction Type: All Bedrooms: All Bathrooms: All Lot Size: All Property Types: Residential Sq Ft: All Cities: San Francisco Clarus MarketMetrics® 1 of 2 12/12/2012 Information not guaranteed. © 2012 - 2013 Terradatum and its suppliers and licensors (www.terradatum.com/about/licensors.td). 5 of 20
- 6. Ronny Budiutama Intero Real Estate Sold Properties by Month Nov-10 vs. Nov-12: The number of Sold properties is up 43% Full Market Bank Properties Non-Bank Properties Time Period # Properties Median Price Average DOM # Properties % Bank Median Price # Properties % Non-Bank Median Price Nov-12 263 830,000 42 26 9.9 497,500 237 90.1 860,000 Oct-12 250 844,500 45 25 10.0 495,000 225 90.0 925,000 Sep-12 178 722,500 46 30 16.9 467,500 148 83.2 779,000 Aug-12 240 766,500 50 32 13.3 485,000 208 86.7 810,750 Jul-12 216 759,000 47 43 19.9 385,000 173 80.1 890,000 Jun-12 267 780,000 60 55 20.6 500,000 212 79.4 842,500 May-12 236 783,000 47 31 13.1 480,000 205 86.9 839,000 Apr-12 221 760,000 54 38 17.2 437,000 183 82.8 801,000 Mar-12 222 713,250 64 52 23.4 465,000 170 76.6 783,000 Feb-12 181 637,000 63 40 22.1 465,000 141 77.9 700,000 Jan-12 129 620,000 81 41 31.8 488,000 88 68.2 729,750 Dec-11 231 610,000 63 47 20.4 471,000 184 79.7 685,500 Nov-11 232 682,500 57 36 15.5 432,500 196 84.5 749,750 Oct-11 201 743,000 54 34 16.9 458,500 167 83.1 792,000 Sep-11 211 652,325 65 49 23.2 450,000 162 76.8 732,000 Aug-11 209 697,620 64 45 21.5 430,000 164 78.5 751,750 Jul-11 205 735,000 62 36 17.6 453,000 169 82.4 825,000 Jun-11 264 744,225 59 44 16.7 459,500 220 83.3 767,500 May-11 222 709,500 63 48 21.6 451,000 174 78.4 757,500 Apr-11 197 701,000 67 42 21.3 434,000 155 78.7 825,000 Mar-11 216 759,500 65 44 20.4 462,500 172 79.6 811,000 Feb-11 124 621,000 83 42 33.9 506,000 82 66.1 730,000 Jan-11 161 610,000 71 38 23.6 422,000 123 76.4 660,000 Dec-10 231 705,000 66 39 16.9 482,500 192 83.1 777,000 Nov-10 184 755,000 59 25 13.6 450,000 159 86.4 800,000 Clarus MarketMetrics® 2 of 2 12/12/2012 Information not guaranteed. © 2012 - 2013 Terradatum and its suppliers and licensors (www.terradatum.com/about/licensors.td). 6 of 20
- 7. Ronny Budiutama Intero Real Estate Under Contract Properties by Month Nov-10 vs. Nov-12: The number of Under Contract properties is up 12% Nov-10 vs. Nov-12 Nov-10 Nov-12 Change % 197 221 24 +12% MLS: SFMLS Period: 2 years (monthly) Price: All Construction Type: All Bedrooms: All Bathrooms: All Lot Size: All Property Types: Residential Sq Ft: All Cities: San Francisco Clarus MarketMetrics® 1 of 2 12/12/2012 Information not guaranteed. © 2012 - 2013 Terradatum and its suppliers and licensors (www.terradatum.com/about/licensors.td). 7 of 20
- 8. Ronny Budiutama Intero Real Estate Under Contract Properties by Month Nov-10 vs. Nov-12: The number of Under Contract properties is up 12% Full Market Bank Properties Non-Bank Properties Time Period # Properties Median Price Average DOM # Properties % Bank Median Price # Properties % Non-Bank Median Price Nov-12 221 765,000 47 29 13.1 464,900 192 86.9 799,000 Oct-12 297 799,000 35 29 9.8 460,000 268 90.2 812,000 Sep-12 227 799,000 42 27 11.9 457,900 200 88.1 849,000 Aug-12 200 699,000 36 23 11.5 410,000 177 88.5 749,000 Jul-12 238 727,000 45 35 14.7 499,000 203 85.3 779,000 Jun-12 204 699,000 46 33 16.2 399,999 171 83.8 799,000 May-12 277 738,000 54 52 18.8 446,250 225 81.2 799,000 Apr-12 224 699,000 50 41 18.3 465,000 183 81.7 799,000 Mar-12 256 717,450 51 51 19.9 425,000 205 80.1 799,000 Feb-12 214 704,231 65 51 23.8 450,000 163 76.2 775,000 Jan-12 166 649,000 68 46 27.7 420,000 120 72.3 765,000 Dec-11 134 604,500 76 30 22.4 494,450 104 77.6 677,000 Nov-11 216 614,000 71 51 23.6 429,000 165 76.4 699,000 Oct-11 248 660,000 66 59 23.8 469,900 189 76.2 775,000 Sep-11 220 699,944 60 34 15.4 488,500 186 84.5 787,000 Aug-11 214 679,000 62 45 21.0 444,900 169 79.0 738,000 Jul-11 223 649,888 57 48 21.5 434,778 175 78.5 725,000 Jun-11 221 699,000 64 43 19.5 429,900 178 80.5 762,000 May-11 239 725,000 57 39 16.3 449,000 200 83.7 798,000 Apr-11 213 729,000 57 35 16.4 488,000 178 83.6 793,500 Mar-11 229 699,000 67 62 27.1 434,900 167 72.9 799,000 Feb-11 192 739,000 64 39 20.3 469,900 153 79.7 799,000 Jan-11 150 630,315 82 52 34.7 446,200 98 65.3 703,200 Dec-10 147 630,000 81 41 27.9 419,900 106 72.1 674,500 Nov-10 197 748,000 69 26 13.2 502,150 171 86.8 789,000 Clarus MarketMetrics® 2 of 2 12/12/2012 Information not guaranteed. © 2012 - 2013 Terradatum and its suppliers and licensors (www.terradatum.com/about/licensors.td). 8 of 20
- 9. Ronny Budiutama Intero Real Estate New Properties by Month Nov-10 vs. Nov-12: The number of New properties is down 15% Nov-10 vs. Nov-12 Nov-10 Nov-12 Change % 198 169 -29 -15% MLS: SFMLS Period: 2 years (monthly) Price: All Construction Type: All Bedrooms: All Bathrooms: All Lot Size: All Property Types: Residential Sq Ft: All Cities: San Francisco Clarus MarketMetrics® 1 of 2 12/12/2012 Information not guaranteed. © 2012 - 2013 Terradatum and its suppliers and licensors (www.terradatum.com/about/licensors.td). 9 of 20
- 10. Ronny Budiutama Intero Real Estate New Properties by Month Nov-10 vs. Nov-12: The number of New properties is down 15% Full Market Bank Properties Non-Bank Properties Time Period # Properties Median Price # Properties % Bank Median Price # Properties % Non-Bank Median Price Nov-12 169 795,000 23 13.6 559,000 146 86.4 799,000 Oct-12 290 789,000 32 11.0 501,700 258 89.0 799,000 Sep-12 320 850,000 32 10.0 454,500 288 90.0 942,000 Aug-12 256 795,000 27 10.6 449,900 229 89.5 825,000 Jul-12 255 699,000 33 12.9 498,000 222 87.1 762,500 Jun-12 260 829,000 30 11.5 450,000 230 88.5 871,000 May-12 265 829,000 43 16.2 449,000 222 83.8 949,000 Apr-12 267 720,000 48 18.0 486,400 219 82.0 799,000 Mar-12 297 725,000 49 16.5 431,700 248 83.5 818,500 Feb-12 262 749,000 51 19.5 424,900 211 80.5 830,000 Jan-12 248 675,000 61 24.6 415,000 187 75.4 788,417 Dec-11 121 559,900 47 38.8 474,900 74 61.2 644,000 Nov-11 151 678,000 39 25.8 459,999 112 74.2 749,500 Oct-11 260 678,500 52 20.0 402,375 208 80.0 727,500 Sep-11 397 735,000 74 18.6 462,450 323 81.4 798,000 Aug-11 289 649,000 58 20.1 468,900 231 79.9 715,000 Jul-11 330 692,000 62 18.8 492,450 268 81.2 738,500 Jun-11 349 698,000 78 22.4 430,550 271 77.7 775,000 May-11 279 699,000 65 23.3 430,000 214 76.7 761,500 Apr-11 293 779,000 43 14.7 475,000 250 85.3 849,500 Mar-11 345 699,000 75 21.7 439,900 270 78.3 798,500 Feb-11 287 690,000 72 25.1 450,550 215 74.9 799,000 Jan-11 274 686,500 69 25.2 467,500 205 74.8 750,000 Dec-10 103 560,000 46 44.7 494,450 57 55.3 695,000 Nov-10 198 656,944 64 32.3 414,800 134 67.7 797,000 Clarus MarketMetrics® 2 of 2 12/12/2012 Information not guaranteed. © 2012 - 2013 Terradatum and its suppliers and licensors (www.terradatum.com/about/licensors.td). 10 of 20
- 11. Ronny Budiutama Intero Real Estate For Sale Properties by Month Nov-10 vs. Nov-12: The number of For Sale properties is down 50% Nov-10 vs. Nov-12 Nov-10 Nov-12 Change % 1,038 520 -518 -50% MLS: SFMLS Period: 2 years (monthly) Price: All Construction Type: All Bedrooms: All Bathrooms: All Lot Size: All Property Types: Residential Sq Ft: All Cities: San Francisco Clarus MarketMetrics® 1 of 2 12/12/2012 Information not guaranteed. © 2012 - 2013 Terradatum and its suppliers and licensors (www.terradatum.com/about/licensors.td). 11 of 20
- 12. Ronny Budiutama Intero Real Estate For Sale Properties by Month Nov-10 vs. Nov-12: The number of For Sale properties is down 50% Full Market Bank Properties Non-Bank Properties Time Period # Properties Median Price Average DOM # Properties % Bank Median Price # Properties % Non-Bank Median Price Nov-12 520 850,000 60 65 12.5 510,000 455 87.5 929,000 Oct-12 696 834,500 54 79 11.3 499,000 617 88.7 899,000 Sep-12 669 858,000 54 81 12.1 469,950 588 87.9 949,000 Aug-12 595 799,000 59 81 13.6 450,000 514 86.4 877,000 Jul-12 627 789,000 63 100 15.9 481,950 527 84.0 889,000 Jun-12 636 799,000 65 115 18.1 450,000 521 81.9 929,000 May-12 705 750,000 69 155 22.0 455,000 550 78.0 899,000 Apr-12 705 699,000 70 164 23.3 465,000 541 76.7 825,000 Mar-12 734 699,000 71 177 24.1 449,500 557 75.9 799,000 Feb-12 689 699,000 80 194 28.2 450,000 495 71.8 799,000 Jan-12 635 649,000 92 201 31.6 450,000 434 68.3 775,000 Dec-11 640 659,000 108 191 29.8 470,000 449 70.2 749,000 Nov-11 833 678,000 94 216 25.9 457,000 617 74.1 750,000 Oct-11 1,013 668,000 81 259 25.6 455,000 754 74.4 749,000 Sep-11 1,056 674,498 75 263 24.9 467,900 793 75.1 759,000 Aug-11 971 650,000 80 257 26.5 459,000 714 73.5 749,000 Jul-11 1,001 659,000 76 268 26.8 449,900 733 73.2 759,000 Jun-11 976 678,000 77 265 27.1 435,000 711 72.8 786,000 May-11 914 689,000 77 233 25.5 448,888 681 74.5 799,000 Apr-11 924 699,000 74 223 24.1 449,950 701 75.9 799,000 Mar-11 919 675,000 74 258 28.1 448,944 661 71.9 795,000 Feb-11 820 666,500 80 238 29.0 454,600 582 71.0 796,225 Jan-11 763 649,000 94 234 30.7 449,925 529 69.3 775,000 Dec-10 819 659,900 104 231 28.2 435,000 588 71.8 779,000 Nov-10 1,038 699,000 87 233 22.4 439,900 805 77.5 790,000 Clarus MarketMetrics® 2 of 2 12/12/2012 Information not guaranteed. © 2012 - 2013 Terradatum and its suppliers and licensors (www.terradatum.com/about/licensors.td). 12 of 20
- 13. Ronny Budiutama Intero Real Estate Expired Properties by Month Nov-10 vs. Nov-12: The number of Expired properties is down 74% Nov-10 vs. Nov-12 Nov-10 Nov-12 Change % 125 33 -92 -74% MLS: SFMLS Period: 2 years (monthly) Price: All Construction Type: All Bedrooms: All Bathrooms: All Lot Size: All Property Types: Residential Sq Ft: All Cities: San Francisco Clarus MarketMetrics® 1 of 2 12/12/2012 Information not guaranteed. © 2012 - 2013 Terradatum and its suppliers and licensors (www.terradatum.com/about/licensors.td). 13 of 20
- 14. Ronny Budiutama Intero Real Estate Expired Properties by Month Nov-10 vs. Nov-12: The number of Expired properties is down 74% Full Market Bank Properties Non-Bank Properties Time Period # Properties Median Price Average DOM # Properties % Bank Median Price # Properties % Non-Bank Median Price Nov-12 33 1,395,000 81 3 9.1 680,000 30 90.9 1,622,500 Oct-12 48 969,000 124 8 16.7 558,000 40 83.3 1,219,000 Sep-12 36 940,500 75 7 19.4 368,000 29 80.6 999,000 Aug-12 46 833,500 85 9 19.6 499,000 37 80.4 1,059,000 Jul-12 50 1,429,995 85 11 22.0 470,000 39 78.0 1,699,000 Jun-12 60 878,500 72 15 25.0 510,000 45 75.0 1,095,000 May-12 52 678,500 69 18 34.6 454,750 34 65.4 898,500 Apr-12 41 675,000 81 11 26.8 487,000 30 73.2 789,000 Mar-12 40 662,475 89 10 25.0 462,500 30 75.0 764,000 Feb-12 38 649,500 122 15 39.5 484,950 23 60.5 949,000 Jan-12 42 599,450 120 12 28.6 444,500 30 71.4 799,000 Dec-11 119 770,000 113 21 17.6 490,000 98 82.3 849,500 Nov-11 98 669,000 96 21 21.4 450,000 77 78.6 764,000 Oct-11 83 629,000 101 23 27.7 449,000 60 72.3 723,000 Sep-11 83 669,000 105 22 26.5 402,500 61 73.5 738,000 Aug-11 98 759,500 92 23 23.5 448,888 75 76.5 799,950 Jul-11 96 699,475 92 21 21.9 435,000 75 78.1 786,000 Jun-11 84 769,000 109 16 19.1 404,500 68 81.0 849,500 May-11 48 784,000 108 7 14.6 434,900 41 85.4 850,000 Apr-11 76 676,500 113 20 26.3 425,000 56 73.7 786,500 Mar-11 59 670,000 108 16 27.1 524,500 43 72.9 729,000 Feb-11 54 622,000 116 16 29.6 479,500 38 70.4 799,000 Jan-11 80 699,000 119 16 20.0 409,500 64 80.0 779,000 Dec-10 183 799,000 115 25 13.7 417,000 158 86.3 843,500 Nov-10 125 738,000 108 22 17.6 488,500 103 82.4 789,000 Clarus MarketMetrics® 2 of 2 12/12/2012 Information not guaranteed. © 2012 - 2013 Terradatum and its suppliers and licensors (www.terradatum.com/about/licensors.td). 14 of 20
- 15. Ronny Budiutama Intero Real Estate Supply & Demand by Month Nov-10 vs. Nov-12: The number of for sale properties is down 50% and the number of sold properties is up 43% Nov-10 vs. Nov-12 Nov-10 vs. Nov-12 Nov-10 Nov-12 Change % Nov-10 Nov-12 Change % 1,038 520 -518 -50% 184 263 79 +43% MLS: SFMLS Period: 2 years (monthly) Price: All Construction Type: All Bedrooms: All Bathrooms: All Lot Size: All Property Types: Residential Sq Ft: All Cities: San Francisco Clarus MarketMetrics® 1 of 2 12/12/2012 Information not guaranteed. © 2012 - 2013 Terradatum and its suppliers and licensors (www.terradatum.com/about/licensors.td). 15 of 20
- 16. Ronny Budiutama Intero Real Estate Supply & Demand by Month Nov-10 vs. Nov-12: The number of for sale properties is down 50% and the number of sold properties is up 43% # Properties Average DOM # Properties Average DOM Time Period For Sale For Sale Sold Sold Nov-12 520 60 263 42 Oct-12 696 54 250 45 Sep-12 669 54 178 46 Aug-12 595 59 240 50 Jul-12 627 63 216 47 Jun-12 636 65 267 60 May-12 705 69 236 47 Apr-12 705 70 221 54 Mar-12 734 71 222 64 Feb-12 689 80 181 63 Jan-12 635 92 129 81 Dec-11 640 108 231 63 Nov-11 833 94 232 57 Oct-11 1,013 81 201 54 Sep-11 1,056 75 211 65 Aug-11 971 80 209 64 Jul-11 1,001 76 205 62 Jun-11 976 77 264 59 May-11 914 77 222 63 Apr-11 924 74 197 67 Mar-11 919 74 216 65 Feb-11 820 80 124 83 Jan-11 763 94 161 71 Dec-10 819 104 231 66 Nov-10 1,038 87 184 59 Clarus MarketMetrics® 2 of 2 12/12/2012 Information not guaranteed. © 2012 - 2013 Terradatum and its suppliers and licensors (www.terradatum.com/about/licensors.td). 16 of 20
- 17. Ronny Budiutama Intero Real Estate The Average Days on Market by Month Nov-10 vs. Nov-12: The average days on market is down 32% Nov-10 vs. Nov-12 Nov-10 Nov-12 Change % 69 47 -22 -32% MLS: SFMLS Period: 2 years (monthly) Price: All Construction Type: All Bedrooms: All Bathrooms: All Lot Size: All Property Types: Residential Sq Ft: All Cities: San Francisco Clarus MarketMetrics® 1 of 2 12/12/2012 Information not guaranteed. © 2012 - 2013 Terradatum and its suppliers and licensors (www.terradatum.com/about/licensors.td). 17 of 20
- 18. Ronny Budiutama Intero Real Estate The Average Days on Market by Month Nov-10 vs. Nov-12: The average days on market is down 32% Time Period Average DOM # UC Units Nov-12 47 221 Oct-12 35 297 Sep-12 42 227 Aug-12 36 200 Jul-12 45 238 Jun-12 46 204 May-12 54 277 Apr-12 50 224 Mar-12 51 256 Feb-12 65 214 Jan-12 68 166 Dec-11 76 134 Nov-11 71 216 Oct-11 66 248 Sep-11 60 220 Aug-11 62 214 Jul-11 57 223 Jun-11 64 221 May-11 57 239 Apr-11 57 213 Mar-11 67 229 Feb-11 64 192 Jan-11 82 150 Dec-10 81 147 Nov-10 69 197 Clarus MarketMetrics® 2 of 2 12/12/2012 Information not guaranteed. © 2012 - 2013 Terradatum and its suppliers and licensors (www.terradatum.com/about/licensors.td). 18 of 20
- 19. Ronny Budiutama Intero Real Estate Months Supply of Inventory Nov-10 vs. Nov-12: The average months supply of inventory is down 67% Nov-10 vs. Nov-12 Nov-10 Nov-12 Change % 3.6 1.2 -2.4 -67% MLS: SFMLS Period: 2 years (monthly) Price: All Construction Type: All Bedrooms: All Bathrooms: All Lot Size: All Property Types: Residential Sq Ft: All Cities: San Francisco Clarus MarketMetrics® 1 of 2 12/12/2012 Information not guaranteed. © 2012 - 2013 Terradatum and its suppliers and licensors (www.terradatum.com/about/licensors.td). 19 of 20
- 20. Ronny Budiutama Intero Real Estate Months Supply of Inventory Nov-10 vs. Nov-12: The average months supply of inventory is down 67% # Units For Sale # UC Units UC Average Time Period Last Day of Month During Month MSI DOM Nov-12 266 221 1.2 47 Oct-12 351 297 1.2 35 Sep-12 406 227 1.8 42 Aug-12 349 200 1.7 36 Jul-12 339 238 1.4 45 Jun-12 372 204 1.8 46 May-12 376 277 1.4 54 Apr-12 440 224 2.0 50 Mar-12 438 256 1.7 51 Feb-12 437 214 2.0 65 Jan-12 427 166 2.6 68 Dec-11 387 134 2.9 76 Nov-11 519 216 2.4 71 Oct-11 682 248 2.8 66 Sep-11 753 220 3.4 60 Aug-11 659 214 3.1 62 Jul-11 682 223 3.1 57 Jun-11 671 221 3.0 64 May-11 627 239 2.6 57 Apr-11 635 213 3.0 57 Mar-11 631 229 2.8 67 Feb-11 574 192 3.0 64 Jan-11 533 150 3.6 82 Dec-10 489 147 3.3 81 Nov-10 716 197 3.6 69 Clarus MarketMetrics® 2 of 2 12/12/2012 Information not guaranteed. © 2012 - 2013 Terradatum and its suppliers and licensors (www.terradatum.com/about/licensors.td). 20 of 20