

Recomendados
Más contenido relacionado
La actualidad más candente
La actualidad más candente (20)
Similar a Strategic Plan 2020-2022
Similar a Strategic Plan 2020-2022 (20)
Más de TIM RI
Más de TIM RI (20)
Último
Último (20)
Strategic Plan 2020-2022
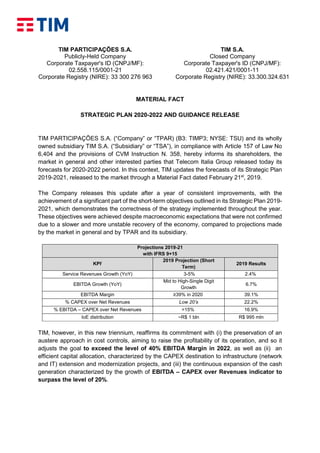
- 1. TIM PARTICIPAÇÕES S.A. Publicly-Held Company Corporate Taxpayer's ID (CNPJ/MF): 02.558.115/0001-21 Corporate Registry (NIRE): 33 300 276 963 TIM S.A. Closed Company Corporate Taxpayer's ID (CNPJ/MF): 02.421.421/0001-11 Corporate Registry (NIRE): 33.300.324.631 MATERIAL FACT STRATEGIC PLAN 2020-2022 AND GUIDANCE RELEASE TIM PARTICIPAÇÕES S.A. (“Company” or “TPAR) (B3: TIMP3; NYSE: TSU) and its wholly owned subsidiary TIM S.A. (“Subsidiary” or “TSA”), in compliance with Article 157 of Law No 6,404 and the provisions of CVM Instruction N. 358, hereby informs its shareholders, the market in general and other interested parties that Telecom Italia Group released today its forecasts for 2020-2022 period. In this context, TIM updates the forecasts of its Strategic Plan 2019-2021, released to the market through a Material Fact dated February 21st , 2019. The Company releases this update after a year of consistent improvements, with the achievement of a significant part of the short-term objectives outlined in its Strategic Plan 2019- 2021, which demonstrates the correctness of the strategy implemented throughout the year. These objectives were achieved despite macroeconomic expectations that were not confirmed due to a slower and more unstable recovery of the economy, compared to projections made by the market in general and by TPAR and its subsidiary. Projections 2019-21 with IFRS 9+15 KPIi 2019 Projection (Short Term) 2019 Results Service Revenues Growth (YoY) 3-5% 2.4% EBITDA Growth (YoY) Mid to High-Single Digit Growth 6.7% EBITDA Margin ≥39% in 2020 39.1% % CAPEX over Net Revenues Low 20’s 22.2% % EBITDA – CAPEX over Net Revenues >15% 16.9% IoE distribution ~R$ 1 bln R$ 995 mln TIM, however, in this new triennium, reaffirms its commitment with (i) the preservation of an austere approach in cost controls, aiming to raise the profitability of its operation, and so it adjusts the goal to exceed the level of 40% EBITDA Margin in 2022, as well as (ii) an efficient capital allocation, characterized by the CAPEX destination to infrastructure (network and IT) extension and modernization projects, and (iii) the continuous expansion of the cash generation characterized by the growth of EBITDA – CAPEX over Revenues indicator to surpass the level of 20%.
- 2. Projections 2019-21 with IFRS 9+15 Projections 2020-22 with IFRS 9+15 and IFRS16 KPIi 2019 (Short Term) Long Term 2020 (Short Term) Long Term Service Revenues Growth (YoY) 3-5% CAGR ’18-’21 Mid-Single Digit Mid-Single Digit CAGR ’19-’22 Mid-Single Digit EBITDA Growth (YoY) / % EBITDA Margin Mid to High-Single Digit Growth ≥39% in 2020 Mid-Single Digit ≥40% in 2022 (≥47% w/ IFRS 16) % CAPEX over Net Revs. / ∑ CAPEX Low 20’s ~R$ 12.0 bln (∑‘19-’21) Low 20’s R$ 12.0 - 12.5 bln (∑‘20-’22) % EBITDA – CAPEX over Net Revenues >15% ≥20% in 2021 >16% (>20% w/ IFRS 16) ≥20% in 2022 (≥25% w/ IFRS 16) Lastly, TIM presents, as an attachment to this Material Fact, additional details about the 2020- 2022 Strategic Plan and its guidance. Rio de Janeiro, March 10th , 2020. TIM Participações S.A. TIM S.A. Adrian Calaza Chief Financial Officer and Investor Relations Officer Adrian Calaza Chief Financial Officer and Investor Relations Officer
- 3. March 16, 2020 2020-2022 Strategic Plan March, 2020
- 4. 2 0.6 0.7 1.8 2.7 2.93.7% 4.7% 11.1% 15.6% 16.9% 2015 2016 2017 2018 2019 31.5% 33.5% 36.6% 38.5% 39.8% 2015 2016 2017 2018 2019 2019 Financial and Operational Highlights EBITDA1,2 R$ 6.8 bln (+6.7% YoY) 6 consecutive years of EBITDA growth (CAGR 15-19: 6.5%) Net Service Revenues1,2 R$ 16.6 bln (+2.4% YoY) TIM Live1,2 R$ 491 mln (+30.6% YoY) Network evolution supported by innovation: 5G trials, massive MIMO, refarming, MOU with Vivo 22.5 23.7 2018 2019 Improved network quality recognized by independent measures +5.6% (1) In 2019; (2) KPIs ex-IFRS 16 impacts; (3) Pro-forma basis (excluding IFRS 9, 15 and 16 impacts) Assertive adjustment in offers’ portfolio, back to the right dynamic in go-to-market Record high organization climate results Image recovery in all segments 1.0% 2.4% 3.0% 3.2% 1Q19 2Q19 3Q19 4Q19 Net Service Revenues Growth2 (%YoY) EBITDA Margin3 Mobile ARPU2 (R$) EBITDA – CAPEX3 (% on Net Revenues ; R$ bln) The year 2019 confirms the company’s transformation in the last 5 years
- 5. 3 Strategic Pillars for 2020-22 INFRASTRUCTURE Preparing for the future1 → 5G and data monetization → Artificial Intelligence → 2G / 3G consolidation → Content distribution → IT: solve operational issues through architecture and platforms review leveraging digital and automation → Network: focus to improve spectrum efficiency through new sites deployments and use of innovative technology (M- MIMO) and refarming MOBILE From Volume to Value 2 → Sustaining residual growth opportunity in a mature market → Portfolio review to unlock upselling opportunities → Selective “more for more” approach to increase ARPU → Leveraging customer experience and mitigate attrition to reduce churn UBB Growth Opportunity 3 → Creation of an infrastructure vehicle through partnership to further accelerate the coverage → Rollout plan with cherry picking approach based on geomarketing analyses → Naked broadband with OTT friendly approach to differentiate our offers EFFICIENCY To the next level, enhancing CEX 4 → Accelerate digital & automation → Revise make vs. buy approach BEYOND CORE Monetizing customer base 5 → IoT Services → Growing market in mobile digital advertising → Unique opportunity in mobile financial services → E2E transformation to improve cash cost efficiency → Network sharing → Cloudification Evolution Transformation Evolution Transformation Evolution Evolution Evolution Transformation Transformation Transformation
- 6. 4 Infrastructure: Preparing TIM Brasil for the future IT to the next level in 18-24 months Network 5 key pillars Benefits: Big data evolution NBA roll-out Application and architecture review Catalogue creation Cognitive systems Data Growth 5G ready New initiatives IoT Fixed Broadband New capabilities Customers’ Integrated view Time-to- market Automation of processes and efficiency increase Densification and innovative solutions Fixed Wireless Access Convergent architecture New IoT businesses opportunities Decommissioning Savings Evolution Transformation
- 7. 5 Attack all segments → Prepaid acceleration (regional + smart promo, channel mgmt.) → Postpaid: brand positioning, handsets → SMB: consumerization 36 33 20 21 Postpaid >45% in 2022 167 185 117 30 56 82 Playing by opportunity, meeting clients true needs Postpaid Prepaid Customer Base Mix1 (MM) Mobile Customer Base by Segment (MM) Mobile: Move from volume to value to sustain mobile business growth, leveraging customer experience (1) Total market; (2) Population > 10 years. Innovation positioning: ensuring execution and customer satisfaction to succeed. Low Price Convergence 2014 2019 2022 P2 P3 P4 Innovation Premium Price Reduce churn → Eliminate pain points: discount management → Lock in high propensity customers → Improve service level 3.5% 3.8% -0.6 p.p. until 2022 104 139 146 Residual growth: churn management becomes more important Mobile Unique Users1,2 (MM) Postpaid Churn Rate (% p.m.) ARPU increase → Unlock upselling opportunities → Price with “more for more” approach → Boost big data, data analytics, NBA capabilities 22.5 23.7 CAGR 19-22 low to mid single digit 1.9 1.7 1.4 Increasing “share of wallet” SIMs per Unique Users1 Mobile ARPU (R$ / month) 2018 2020 20222010 2015 2020 2022 Evolution Transformation
- 8. 6 Ultrabroadband: Industrialization to capture growth opportunity with financial discipline - 0,5 1,0 1,5 2018 2019 2020 2021 2022 Milhões FTTH FTTC FTTx Customer Base 2018 2019 2020 2021 2022 TIM Live CAGR 19-22: >30% Fixed Net Revenues TIM Live Others From Evolution… Footprint expansion and operational improvement → Cherry peaking deployment → Reduce early churn → Improve care and self-care → Reliable bill to cash processes The lever for fixed business growth. Differentiation: UBB + Content → OTT content friendly approach → Wi-Fi experience ... To Transformation +15 cities+40% households covered In2020… Expanding TIM Live's services with the right balance between Sales and Capex, unlocking additional value of this asset Create in partnership a neutral fiber infrastructure asset in Brazil Market sound process with an advisor to find the right partner Evolution Transformation Strategic Partnership Mln 1.5 1.0 0.5
- 9. 7 Efficiency: Keep the lead in profitability taking efficiency to the next level, while enhancing customer experience E2E transformation to improve cash cost efficiency, leveraging digital, automation, new make vs buy models. → Bad Debt (e.g. new credit models, collections systems improvement) → Legal processes (e.g. predictive models to reduce JEC expenses - special court for small cases) → Self-Provisioning (e.g., Naked SIM) → Self-caring: Cognitive IVR and WhatsApp services (e.g., second invoice, balance check and etc.) → Self-healing (e.g., technical resolution for broadband services) → Administrative processes (e.g., commissioning, ground leasing) → Pay-roll management IT Planning & Development → Industrial agreements (e.g. VIVO MoU) → Innovative Technologies (Massive MIMO) → TIM Live’s Transformation with partnership → Cloudification (storage as commodity) Process efficiency Digital & Automation Make vs buy Smart CAPEX Evolution Transformation
- 10. 8 Beyond the core: Leverage our assets with strategic partnerships through a unique window of opportunity TIM as publisher Exploring available touch- points. TIM as ad tech player Leveraging on customer knowledge and ownership. R$ 24.2 bln Brazil’s digital ad market in 2022 R$ 19 bln delivered through mobile 1 2 Mobile Advertising HIGH-END Convenience and simplicity. 1 LOW-END Access to banking services. 2 → Symbiotic partnership (JV like) → Value generated by profit sharing → Full bank offer → Commercial partnership → Value generated by commissions in fees + equity Mobile Financial ServicesIoT Develop at scale and monetize IoT verticals to explore B2B opportunities. 2x connections reaching 106.3 mln of IoT devices (19.6% CAGR). US$~750mln addressable market in agriculture US$~400mln addressable market in transport / logistics Evolution Transformation Sole operator in the initiative developing agribusiness solutions based on IoT. First mover: agreement with car manufacturer to provide in-car connectivity and automation. Connected Car R$ 190 mln already generated in mobile ads products with a ~35% upside in 2020. New trial contracts signed in the past 2 months. Telecom + digital banking services. Agreement with a digital bank to be announced in the coming weeks. Partners short list under analysis Sources: GlobalData Market Opportunity Forecasts to 2023: Global IoT; Latin America Digital Ad Spending 2019 eMarketer; Global Findex Database 2017 27% 59% 79% Credit Card Ownership Debit Card Ownership Mobile Penetration 1 1 2 (1) Population > 15 years; (2) Population > 10 years. Latin America IoT Market in 2022 Penetration over Brazilian Population
- 11. 9 TIM Brasil 2020-’22 Targets GOALS DRIVERS SHORT TERM TARGETS (2020) LONG TERM TARGETS Revenue Growth Sustainability → Leverage mobile ARPU improve → Expand Residential UBB operations → Tap B2B opportunity Service Revenues Growth: Mid single digit (YoY) Service Revenues Growth: Mid single digit (CAGR ‘19-’22) Improve Profitability → Accelerate digital transformation → Maintain zero-based budget approach → Reliable bill to cash process EBITDA Growth: Mid single digit (YoY) EBITDA Margin: ≥40% in 2022 (≥47% w/ IFRS 16) Infrastructure Development → Smart and selective Capex approach Capex on Net Revenues: Low 20’s Capex: R$ 12.0 - 12.5 bln (∑‘20-’22) Expand Cash Generation → Strict financial discipline → Continue debt and tax rate optimization EBITDA-Capex on Net Revenues: >16% (>20% w/ IFRS 16) EBITDA-Capex on Net Revenues: ≥20% in 2022 (≥25% w/ IFRS 16) (1) KPIs with IFRS 15/9, except when otherwise indicated.
- 12. 10