SlideShare una empresa de Scribd logo
1 de 10
Descargar para leer sin conexión
1 of 10
Charlottesville Area First Quarter 2015 Highlights:
 Median sales price for the region was up 5.1% over Q1-2014, rising from $244,250 to $256,750.
 Sellers received 94% of original list price at sale, 2.7 points higher than the five-year average for the quarter.
 Closed sales remain consistent as new pending sales were up 18%, boding well for the spring market.
 Homes in the $300-$400K price range sold fastest, with half of the 80 homes in this segment selling in 34 days
or less.
 Detached median sales price was up 8.2% year-over-year whereas the attached median sales price decreased
by 6.5%.
©2015 RealEstate Business Intelligence, LLC. All Rights Reserved
Data Source: CAAR MLS. Statistics calculated April 3, 2015
2015 First Quarter
Market Report
2011 Year End Market Report Market
ReportReport
CAAR Member Copy – Expanded Edition
2 of 10
Sales Activity –
There were 493 homes sold in the 1st
Quarter in Greater Charlottesville, virtually unchanged from Q1-2014 with only one
additional closed sale. While the sales rate is even versus the same quarter last year, it is 4.3% higher than the five-year
average for the quarter. The 106 attached homes sold (including condos and attached single family homes) is 3.9% higher
in Q1-2014 posted sales. Condos had the largest jump in sales, increasing from 34 last year to 48 in Q1-2015, a gain of
41.2%. The 387 detached homes sold represented a nominal 0.8% decrease (-3 sales) compared to Q1-2014.
There were notable shifts in the number of smaller homes purchased compared to larger home segments. Sales of homes
with a living area of less than 1,200 square feet increased 27.5% versus Q1-2014 (88 vs. 69 sales) while 3,000+ square
foot home sales decreased 5.3% (90 vs. 95 sales). While these home size segments account for less than a fifth of the
total sales respectively, diverging trends in these outer quantiles can have an outsized effect on the average (mean) sales
price. This helps explain why, despite a 5.1% jump in the median sales price seen in Greater Charlottesville compared to
Q1-2014, the average sales price dropped 8.9%. Further influencing this average/mean price decline, the 13 homes sold
in the largest home segment analyzed (5,000+ sqft) had an average sales price of $1.1M in Q1-2015, down 29.4%
compared to the average sales price of $1.6M for the 16 homes sold in Q1-2014. The exaggerated impact that outlier
segments can have on average/mean trends is why analysts tend to refer almost exclusively to shifts in the median when
describing housing market trends.
©2015 RealEstate Business Intelligence, LLC. All Rights Reserved
Data Source: CAAR MLS. Statistics calculated April 3, 2015
Nelson County, the most affordable county with a Q1 median sales price that was over $100,000 lower than that of the
greater region, had the largest percent increase in sales (+27.1%). Conversely, in Albemarle County, the most expensive
county with a Q1 median sales price nearly $75,000 higher than that of the region, closed sales were down a modest
3.4%. Fluvanna (-15.1%) had the largest percent decrease, with 14 fewer sales than Q1-2014. Louisa’s 48 sales were
seven more than last year (+17.1%), while Charlottesville and Greene both saw modest sales gains of 5.1% and 2.3%,
respectively. All told, Albemarle home sales accounted for just 39.8% of Greater Charlottesville’s total sales, the lowest
Q1 share for the county since Q1-2008. Normal seasonal patterns suggest Albemarle’s share should approach 50% in the
second quarter and the Q2 median sales price for Greater Charlottesville should increase significantly from the Q1 level
as well.
3 of 10
Inventory –
While closed sales were level with the same period one year ago, the 929 new pending sales represent an 18% increase
over Q1-2014. Notably, the 399 new pending sales in March were the highest March-level since 2005, and exceeded the
five-year March average of 318 new pendings by 25.5%. The 855 pendings at quarter’s end is 25.2% higher than the total
pendings headed into the 2nd
Quarter last year indicating a strong start to spring sales. Five of the six jurisdictions have
over 20% more pending sales at quarter’s end than last year, Charlottesville being the exception with 5.9% fewer pending
sales.
For the fourth consecutive quarter, Q1 seller activity
exceeded the prior year’s level. The 1,401 new listings
added were 9.4% more than the 1,281 new listings added
in Q1-2014. Albemarle had the largest net gain with over
100 more listings added than last year, 726 versus 618
(+17.5%). Louisa’s 116 new listings for the quarter
represented the highest percent increase, gaining 34.9%
over it’s Q1-2014 total. With 227 new listings,
Charlottesville was the only other jurisdiction with more
respective listings added, gaining 6.6%. Fluvanna saw the
largest year-over-year decline in new listing activity for
the quarter, dipping 11% to 145. Greene’s 82 new listings
were 7.9% down while Nelson saw 6.3% fewer listings
with 105.
Despite the momentum of new listings added to the market, active inventory headed into the 2nd
Quarter was 7.6% lower
than the same point last year. With 1,915 active listings, 2015 marked the first time in nine years that supply headed into
April dipped below the 2,000 listings. The 18% gain in new pending sales more than offset the 9.4% uptick in new listings.
Using the average monthly sales pace over the last twelve months, the 1,915 active listings represent 9.0 months of
supply. This is down from 9.7 months at this point in 2014 and two months lower than the five-year average of 10.9
months for this time of year.
“Our first quarter statistics remain consistent compared to previous years, which reconfirms the value appreciation when
investing in real estate,” said CAAR President, Anita Dunbar. “Despite having limited homes available, our market home
prices are holding strong and the demand is growing as indicated by the high percentage of pending sales.”
©2015 RealEstate Business Intelligence, LLC. All Rights Reserved
Data Source: CAAR MLS. Statistics calculated April 3, 2015
4 of 10
Days on Market (DOM) and Pricing –
The median DOM for Greater Charlottesville in the 1st
Quarter was 73 days, three days lower than Q1-2014 and the
lowest Q1-level since 2006. One in five homes sold during the quarter (20.9%) were on the market 10 days or less. Homes
in the $300k-$400k price range sold fastest, with half of the 80 homes in this segment selling in 34 days or fewer. With a
median DOM of 52 days, townhomes sold faster than detached homes (71 days) and condos (136 days). The average
DOM for homes sold in the 1st
Quarter was 138 days, 12 days more than the Q1-2014 level (126 days), but more than two
weeks lower than the five-year Q1 average of 155 days.
©2015 RealEstate Business Intelligence, LLC. All Rights Reserved
Data Source: CAAR MLS. Statistics calculated April 3, 2015
Homes sold fastest, based on median DOM levels, in Louisa (56 days) and Greene (59 days). Albemarle homes took nine
days fewer to sell than last year, with a median DOM of 64 days. The city of Charlottesville was the other jurisdiction with
a lower level than the region, but its 69-day median was 19 days higher than Q1-2014. Fluvanna homes took more than a
month longer than the rest of the region, though the county saw its median DOM fall by more than two weeks, from 122
to 106 days. Nelson’s level more than doubled from Q1-2014, spiking to 185 days. With half of its 47 sales in the 1st
Quarter sitting on the market for over six months, it’s not surprising that Nelson sellers received a significantly lower
percentage of original asking price than the other jurisdictions in Greater Charlottesville.
©2015 RealEstate Business Intelligence, LLC. All Rights Reserved
Data Source: CAAR MLS. Statistics calculated April 3, 2015
5 of 10
Nelson sellers received 85.7% of the original list price in Q1-2015 compared to 87.9% last year, eight points below the
94.0% mark for Greater Charlottesville. This regional level was 1.4 points higher than in Q1-2014 (92.6%) and 2.7 points
above the five-year Q1 average (91.3%). As demand improved, five of the six jurisdictions saw gains in their average sold
price (SP) to original list price (OLP) ratio, led by a 3.3 point bump in Louisa. At 96.4%, the average SP to OLP ratio in
Louisa was slightly higher than Charlottesville, which had an average ratio of 96%. Greene (95.9%) and Albemarle (95.3%)
also had higher averages than the greater region. Fluvanna’s 91.1% level was an improvement from Q1-2014, but nearly
three points below the regional average.
“Nelson County had the most dramatic statistics from this first quarter. Although it had a 27.1% increase in total sales,
the jurisdiction showed a dramatic drop in median sales price and doubled its days on the market from Q1-2014,” said
CAAR President-Elect, Donna Patton.
Home Prices –
©2015 RealEstate Business Intelligence, LLC. All Rights Reserved
Data Source: CAAR MLS. Statistics calculated April 3, 2015
At $256,750, the 1st
Quarter median sales price in Greater Charlottesville reached the highest Q1-level since 2009. It was
5.1% higher than Q1-2014 and shows a 12.9% appreciation over Q1-2013 when prices bottomed out at $227,500.
Detached homes saw the highest year-over-year price gains, increasing 8.2% to $277,750. The $204,500 median price for
the attached segment (which includes both single family homes and condos) represented a 6.5% decrease from Q1-2014.
©2015 RealEstate Business Intelligence, LLC. All Rights Reserved
Data Source: CAAR MLS. Statistics calculated April 3, 2015
6 of 10
Half of the jurisdictions saw year-over-year gains in median sales price in the 1st
Quarter. Louisa ($211,500) led the region
in price gains with a 23.6% increase. Albemarle ($330,000) and Greene ($205,000) saw modest gains, up 3.8% and 1.3%,
respectively. Charlottesville ($275,100) and Fluvanna ($174,750) only saw modest declines of 1.8% and 3.6%. Nelson
($147,000) was the only county to see a significant drop, falling 33.2% from Q1-2014.
7 of 10
8 of 10
Attached vs. Detached Homes –
Prices in the detached housing segment outperformed the attached segment in Greater Charlottesville in the 1st
Quarter.
The median sales price for detached homes was up 8.2% from Q1-2014 to $277,750. This represented the highest Q1-
level since 2009. The $204,500 median sales price for attached homes was 6.5% less than Q1-2014, primarily due to the
increased share that condos accounted for this quarter. Condo properties, which had a median sales price of $139,000,
accounted for 45% of attached homes sold, while the higher priced townhome segment (median sales price of $243,500)
made up 55% of attached sales. This is a significant shift compared to Q1-2014, when condos accounted for only 33% of
all attached sales.
There was a 3.9% increase in attached sales, with four more than Q1-2014. This despite the fact that townhome sales
dropped 14.7%, or ten sales, to a total of 58 for the quarter. The 41.2% spike in condos, with 48 1st
Quarter sales
compared to 34 in Q1-2014, kept the attached segment tally above last year’s level. Detached home sales were flat with
only three fewer sales than last year. Townhomes continue to sell faster than detached homes and condos, with a
median DOM of 52 days. Half the condos sold were on the market for 136 days or longer, the highest median DOM for
this segment since the 1st
quarter of 2013. Detached homes had a median of 71 days, seven days lower than Q1-2014.
Distressed Inventory –
Only 46 of the 493 sales in the 1st
Quarter, or 9.3%, were foreclosures. This represents 17 fewer foreclosure sales versus
Q1-2014, when foreclosures accounted for 12.8% of sales. This was the fifth consecutive quarter with fewer foreclosure
sales than the previous year and the ninth quarter in the last ten quarters. Short sales continue to be a virtual non-factor
All Residential Q1-15 % Q-O-Q Q4-14 % Y-O-Y Q1-14 % Y-O-2Y Q1-13 % Y-O-3Y Q1-12
Average Sales Price $306,075 -9.1% $336,818 -7.9% $332,461 10.6% $276,795 9.2% $280,244
Median Sales Price $256,750 -0.9% $259,000 5.1% $244,250 12.9% $227,500 11.6% $230,000
Units Sold (Closed) 493 -25.4% 661 0.2% 492 0.2% 492 6.5% 463
Average DOM (Closed) 138 9.5% 126 9.5% 126 -18.8% 170 -17.4% 167
Listing Discount (Average) 6.0% 6.5% 7.4% 9.1% 10.3%
Avg SP to OLP Ratio 94.0% 93.5% 92.6% 91.0% 89.7%
Avg SP/Sq Ft $139 -2.8% $143 1.5% $137 7.8% $129 10.3% $126
Detached Q1-15 % Q-O-Q Q4-14 % Y-O-Y Q1-14 % Y-O-2Y Q1-13 % Y-O-3Y Q1-12
Average Sales Price $328,190 -9.6% $363,123 -7.3% $353,854 10.0% $298,318 8.5% $302,614
Median Sales Price $277,750 1.7% $273,000 8.2% $256,750 13.6% $244,500 12.4% $247,000
Units Sold (Closed) 387 -25.7% 521 -0.8% 390 -0.3% 388 9.9% 352
Average DOM (Closed) 139 9.4% 127 6.1% 131 -15.8% 165 -16.8% 167
Listing Discount (Average) 5.6% 6.4% 8.1% 9.4% 11.1%
Avg SP to OLP Ratio 94.4% 93.6% 91.9% 90.6% 88.9%
Avg SP/Sq Ft $137 -4.2% $143 3.0% $133 7.9% $127 13.2% $121
Attached Q1-15 % Q-O-Q Q4-14 % Y-O-Y Q1-14 % Y-O-2Y Q1-13 % Y-O-3Y Q1-12
Average Sales Price $225,545 -5.6% $238,926 -10.0% $250,665 14.8% $196,498 7.8% $209,304
Median Sales Price $204,500 -4.3% $213,750 -6.5% $218,750 11.4% $183,520 6.0% $193,000
Units Sold (Closed) 106 -24.3% 140 3.9% 102 1.9% 104 -4.5% 111
Average DOM (Closed) 136 11.5% 122 28.3% 106 -28.4% 190 -18.1% 166
Listing Discount (Average) 7.3% 7.1% 4.8% 7.8% 7.5%
Avg SP to OLP Ratio 92.7% 93.0% 95.3% 92.2% 92.5%
Avg SP/Sq Ft $145 2.8% $141 -3.3% $150 5.8% $137 2.8% $141
RBI Key Housing Trend Metrics
Charlottesville Area Association of REALTORS®
9 of 10
in Greater Charlottesville, accounting for only 3.4% of all sales. The 17 short sales were three less than Q1-2014, when
short sales accounted for 4.1% of sales.
The median sales price for foreclosures was $115,000, down 7.3% from last year. The median sales price for short sales
was $197,250, a gain of 6.9%. The 430 non-distressed sales were 5.1% more than the 409 in Q1-2014 and their median
sales price of $276,000 represented a 1.5% year-over-year increase.
The 1,401 listings added during the 1st
Quarter represented a 9.4% increase from last year’s total. However, the 76
distressed listings added during the quarter represented an 8.4% decrease from the number listed during the same
quarter last year. There were 63 foreclosed properties listed, slightly more than the 60 added in Q1-2014. There were
only 14 new short sale listings, down from 23. The 1,325 non-distressed listings added represented a 10.6% increase from
Q1-2014. Distressed listings accounted for only 5.5% of new listings, down from 6.5% of new listings in Q1-2014.
Land/Acreage Sales –
There were 63 land/acreage sales in Greater Charlottesville in the 1st
Quarter, down 35.1% from Q1-2014 and the lowest
1st
Quarter tally since 2011. With 35 sales, the <5 acre segment saw the largest decrease, with 22 fewer sales than Q1-
2014. Land sales in the 5-25 acre segment also declined, from 26 sales in Q1-2014 to 18 sales in Q1-2015. There were ten
sales in the >25 acre segment, three fewer than the same quarter last year.
10 of 10
©2015 RealEstate Business Intelligence, LLC. All Rights Reserved
Data Source: CAAR MLS. Statistics calculated April 3, 2015
Land sales were down in all six jurisdictions, with the biggest decrease in Albemarle, where land sales dropped from 42 in
Q1-2014 to 25 this quarter. Nelson had the next highest land sales total at 13, though this was down from 16 last year.
Fluvanna had 11 land sales, five fewer than last year. The four land sales in Greene were down from seven last year,
though the three of the four sales were for 5 acres or more. Land sales in Louisa fell from 13 to nine, though there was a
>25 acre sale this quarter. There was only one land sale in Charlottesville in the 1st
Quarter, down from three last year.
©2015 RealEstate Business Intelligence, LLC. All Rights Reserved
Data Source: CAAR MLS. Statistics calculated April 3, 2015

Más contenido relacionado

La actualidad más candente

January 2018 San Francisco Market Update
January 2018 San Francisco Market UpdateJanuary 2018 San Francisco Market Update
January 2018 San Francisco Market UpdateRonny Budiutama
 
San Francisco Market Focus February 2016
San Francisco Market Focus February 2016San Francisco Market Focus February 2016
San Francisco Market Focus February 2016Ronny Budiutama
 
CANADIAN HOME SALES ACTIVITY IMPROVES IN JUNE - 16 JULY 2018
CANADIAN HOME SALES ACTIVITY IMPROVES IN JUNE - 16 JULY 2018CANADIAN HOME SALES ACTIVITY IMPROVES IN JUNE - 16 JULY 2018
CANADIAN HOME SALES ACTIVITY IMPROVES IN JUNE - 16 JULY 2018Shawn Venasse
 
Market Report: MSA Market Detail - Single Family - 3rd Quarter 2017
Market Report: MSA Market Detail - Single Family - 3rd Quarter 2017Market Report: MSA Market Detail - Single Family - 3rd Quarter 2017
Market Report: MSA Market Detail - Single Family - 3rd Quarter 2017Al Graham
 
January 2015 Greater Boston Real Estate Market Trends Report
January 2015 Greater Boston Real Estate Market Trends ReportJanuary 2015 Greater Boston Real Estate Market Trends Report
January 2015 Greater Boston Real Estate Market Trends ReportUnit Realty Group
 
San Francisco Market Focus Report November 2018
San Francisco Market Focus Report November 2018San Francisco Market Focus Report November 2018
San Francisco Market Focus Report November 2018Ronny Budiutama
 
April 2019: Sales up! - Toronto real estate market charts
April 2019: Sales up! - Toronto real estate market chartsApril 2019: Sales up! - Toronto real estate market charts
April 2019: Sales up! - Toronto real estate market chartsScott Ingram, CPA, CA, MBA
 
February 2017 Home Sales Report
February 2017 Home Sales ReportFebruary 2017 Home Sales Report
February 2017 Home Sales ReportPhil Sveum
 
February 2015 Greater Boston Real Estate Market Trends Report
February 2015 Greater Boston Real Estate Market Trends ReportFebruary 2015 Greater Boston Real Estate Market Trends Report
February 2015 Greater Boston Real Estate Market Trends ReportUnit Realty Group
 
October 2015 Greater Boston Real Estate Market Trends Report
October 2015 Greater Boston Real Estate Market Trends ReportOctober 2015 Greater Boston Real Estate Market Trends Report
October 2015 Greater Boston Real Estate Market Trends ReportUnit Realty Group
 
May 2018 - Continued conflicting signs: Toronto real estate market charts
May 2018 - Continued conflicting signs: Toronto real estate market chartsMay 2018 - Continued conflicting signs: Toronto real estate market charts
May 2018 - Continued conflicting signs: Toronto real estate market chartsScott Ingram, CPA, CA, MBA
 
October 2015 Home Sales Report
October 2015 Home Sales ReportOctober 2015 Home Sales Report
October 2015 Home Sales ReportPhil Sveum
 
August 2015 Greater Boston Real Estate Market Trends Report
August 2015 Greater Boston Real Estate Market Trends ReportAugust 2015 Greater Boston Real Estate Market Trends Report
August 2015 Greater Boston Real Estate Market Trends ReportUnit Realty Group
 
TORONTO REAL ESTATE BOARD'S JUNE 2017 MARKET STATS
TORONTO REAL ESTATE BOARD'S JUNE 2017 MARKET STATSTORONTO REAL ESTATE BOARD'S JUNE 2017 MARKET STATS
TORONTO REAL ESTATE BOARD'S JUNE 2017 MARKET STATSShawn Venasse
 
TORONTO REAL ESTATE SALES - APRIL 2018 (TREB)
TORONTO REAL ESTATE SALES - APRIL 2018 (TREB)TORONTO REAL ESTATE SALES - APRIL 2018 (TREB)
TORONTO REAL ESTATE SALES - APRIL 2018 (TREB)Shawn Venasse
 
June 2019 and YTD Calgary Home Sale Stats from Calgary Real Estate Board and ...
June 2019 and YTD Calgary Home Sale Stats from Calgary Real Estate Board and ...June 2019 and YTD Calgary Home Sale Stats from Calgary Real Estate Board and ...
June 2019 and YTD Calgary Home Sale Stats from Calgary Real Estate Board and ...Jerry Charlton
 
May 2019: Stress test, schmess test - Toronto real estate market charts
May 2019: Stress test, schmess test - Toronto real estate market chartsMay 2019: Stress test, schmess test - Toronto real estate market charts
May 2019: Stress test, schmess test - Toronto real estate market chartsScott Ingram, CPA, CA, MBA
 
Annual report on sf county housing market
Annual report on sf county housing marketAnnual report on sf county housing market
Annual report on sf county housing marketRonny Budiutama
 
San Francisco Real Estate Housing Market January 2017
San Francisco Real Estate Housing Market January 2017San Francisco Real Estate Housing Market January 2017
San Francisco Real Estate Housing Market January 2017Ronny Budiutama
 

La actualidad más candente (20)

January 2018 San Francisco Market Update
January 2018 San Francisco Market UpdateJanuary 2018 San Francisco Market Update
January 2018 San Francisco Market Update
 
San Francisco Market Focus February 2016
San Francisco Market Focus February 2016San Francisco Market Focus February 2016
San Francisco Market Focus February 2016
 
CANADIAN HOME SALES ACTIVITY IMPROVES IN JUNE - 16 JULY 2018
CANADIAN HOME SALES ACTIVITY IMPROVES IN JUNE - 16 JULY 2018CANADIAN HOME SALES ACTIVITY IMPROVES IN JUNE - 16 JULY 2018
CANADIAN HOME SALES ACTIVITY IMPROVES IN JUNE - 16 JULY 2018
 
Market Report: MSA Market Detail - Single Family - 3rd Quarter 2017
Market Report: MSA Market Detail - Single Family - 3rd Quarter 2017Market Report: MSA Market Detail - Single Family - 3rd Quarter 2017
Market Report: MSA Market Detail - Single Family - 3rd Quarter 2017
 
January 2015 Greater Boston Real Estate Market Trends Report
January 2015 Greater Boston Real Estate Market Trends ReportJanuary 2015 Greater Boston Real Estate Market Trends Report
January 2015 Greater Boston Real Estate Market Trends Report
 
San Francisco Market Focus Report November 2018
San Francisco Market Focus Report November 2018San Francisco Market Focus Report November 2018
San Francisco Market Focus Report November 2018
 
April 2019: Sales up! - Toronto real estate market charts
April 2019: Sales up! - Toronto real estate market chartsApril 2019: Sales up! - Toronto real estate market charts
April 2019: Sales up! - Toronto real estate market charts
 
February 2017 Home Sales Report
February 2017 Home Sales ReportFebruary 2017 Home Sales Report
February 2017 Home Sales Report
 
February 2015 Greater Boston Real Estate Market Trends Report
February 2015 Greater Boston Real Estate Market Trends ReportFebruary 2015 Greater Boston Real Estate Market Trends Report
February 2015 Greater Boston Real Estate Market Trends Report
 
October 2015 Greater Boston Real Estate Market Trends Report
October 2015 Greater Boston Real Estate Market Trends ReportOctober 2015 Greater Boston Real Estate Market Trends Report
October 2015 Greater Boston Real Estate Market Trends Report
 
May 2018 - Continued conflicting signs: Toronto real estate market charts
May 2018 - Continued conflicting signs: Toronto real estate market chartsMay 2018 - Continued conflicting signs: Toronto real estate market charts
May 2018 - Continued conflicting signs: Toronto real estate market charts
 
October 2015 Home Sales Report
October 2015 Home Sales ReportOctober 2015 Home Sales Report
October 2015 Home Sales Report
 
August 2015 Greater Boston Real Estate Market Trends Report
August 2015 Greater Boston Real Estate Market Trends ReportAugust 2015 Greater Boston Real Estate Market Trends Report
August 2015 Greater Boston Real Estate Market Trends Report
 
TORONTO REAL ESTATE BOARD'S JUNE 2017 MARKET STATS
TORONTO REAL ESTATE BOARD'S JUNE 2017 MARKET STATSTORONTO REAL ESTATE BOARD'S JUNE 2017 MARKET STATS
TORONTO REAL ESTATE BOARD'S JUNE 2017 MARKET STATS
 
Hudson valley market report
Hudson valley market reportHudson valley market report
Hudson valley market report
 
TORONTO REAL ESTATE SALES - APRIL 2018 (TREB)
TORONTO REAL ESTATE SALES - APRIL 2018 (TREB)TORONTO REAL ESTATE SALES - APRIL 2018 (TREB)
TORONTO REAL ESTATE SALES - APRIL 2018 (TREB)
 
June 2019 and YTD Calgary Home Sale Stats from Calgary Real Estate Board and ...
June 2019 and YTD Calgary Home Sale Stats from Calgary Real Estate Board and ...June 2019 and YTD Calgary Home Sale Stats from Calgary Real Estate Board and ...
June 2019 and YTD Calgary Home Sale Stats from Calgary Real Estate Board and ...
 
May 2019: Stress test, schmess test - Toronto real estate market charts
May 2019: Stress test, schmess test - Toronto real estate market chartsMay 2019: Stress test, schmess test - Toronto real estate market charts
May 2019: Stress test, schmess test - Toronto real estate market charts
 
Annual report on sf county housing market
Annual report on sf county housing marketAnnual report on sf county housing market
Annual report on sf county housing market
 
San Francisco Real Estate Housing Market January 2017
San Francisco Real Estate Housing Market January 2017San Francisco Real Estate Housing Market January 2017
San Francisco Real Estate Housing Market January 2017
 

Similar a Charlottesville Real Estate Market Update - 1st Quater 2015

Charlottesville Area 3rd Qtr 2014 Real Estate Market Data
Charlottesville Area 3rd Qtr 2014 Real Estate Market DataCharlottesville Area 3rd Qtr 2014 Real Estate Market Data
Charlottesville Area 3rd Qtr 2014 Real Estate Market DataRobert Earl
 
Buoyed by stronger economy, California housing market accelerates in March as...
Buoyed by stronger economy, California housing market accelerates in March as...Buoyed by stronger economy, California housing market accelerates in March as...
Buoyed by stronger economy, California housing market accelerates in March as...weakhamper1200
 
April Phoenix East Valley Real Estate Market report
April Phoenix East Valley Real Estate Market reportApril Phoenix East Valley Real Estate Market report
April Phoenix East Valley Real Estate Market reportLen Nevin
 
Northeast Ohio Home Sellers Guide
Northeast Ohio Home Sellers GuideNortheast Ohio Home Sellers Guide
Northeast Ohio Home Sellers GuideLisa Humenik
 
Sue adler 2014 summary millburn short hills
Sue adler 2014 summary millburn short hillsSue adler 2014 summary millburn short hills
Sue adler 2014 summary millburn short hillsSue Adler
 
Building Products and Materials Industry Insights - Q3 2015
Building Products and Materials Industry Insights - Q3 2015Building Products and Materials Industry Insights - Q3 2015
Building Products and Materials Industry Insights - Q3 2015Duff & Phelps
 
March Phoenix East Valley Real Estate Market report
March Phoenix East Valley Real Estate Market reportMarch Phoenix East Valley Real Estate Market report
March Phoenix East Valley Real Estate Market reportLen Nevin
 
Pierce Duncan Team - Fall 2015 Newsletter
Pierce Duncan Team - Fall 2015 NewsletterPierce Duncan Team - Fall 2015 Newsletter
Pierce Duncan Team - Fall 2015 NewsletterNancy Pierce
 
Market Summary September 2015
Market Summary September 2015Market Summary September 2015
Market Summary September 2015Stephanie Lindsey
 
March 2015 Phoenix East Valley Real Estate Market report
March 2015 Phoenix East Valley Real Estate Market reportMarch 2015 Phoenix East Valley Real Estate Market report
March 2015 Phoenix East Valley Real Estate Market reportLen Nevin
 
Annie Williams Real Estate Report Nov-Dec 2015
Annie Williams Real Estate Report Nov-Dec 2015Annie Williams Real Estate Report Nov-Dec 2015
Annie Williams Real Estate Report Nov-Dec 2015Jon Weaver
 
Parma OH Home Owners Guide to the 2015 Real Esate Market
Parma OH Home Owners Guide to the 2015 Real Esate MarketParma OH Home Owners Guide to the 2015 Real Esate Market
Parma OH Home Owners Guide to the 2015 Real Esate MarketLisa Humenik
 
FINAL-McGuire-QR-4th2015
FINAL-McGuire-QR-4th2015FINAL-McGuire-QR-4th2015
FINAL-McGuire-QR-4th2015kylehsf
 
Inventory and Sales Down - Real Estate Report February
Inventory and Sales Down - Real Estate Report FebruaryInventory and Sales Down - Real Estate Report February
Inventory and Sales Down - Real Estate Report FebruaryAMSI, San Francisco
 
2011.01 Market Watch
2011.01  Market  Watch2011.01  Market  Watch
2011.01 Market Watchtoddcmenard
 
Median Home Price Stays Over $1MM - July/August Real Estate Report
Median Home Price Stays Over $1MM - July/August Real Estate ReportMedian Home Price Stays Over $1MM - July/August Real Estate Report
Median Home Price Stays Over $1MM - July/August Real Estate ReportAMSI, San Francisco
 
Home Sales Pop in March - Real Estate Report April/May
Home Sales Pop in March - Real Estate Report April/MayHome Sales Pop in March - Real Estate Report April/May
Home Sales Pop in March - Real Estate Report April/MayAMSI, San Francisco
 

Similar a Charlottesville Real Estate Market Update - 1st Quater 2015 (20)

Charlottesville Area 3rd Qtr 2014 Real Estate Market Data
Charlottesville Area 3rd Qtr 2014 Real Estate Market DataCharlottesville Area 3rd Qtr 2014 Real Estate Market Data
Charlottesville Area 3rd Qtr 2014 Real Estate Market Data
 
Wright Report Q1-2, 2015
Wright Report Q1-2, 2015Wright Report Q1-2, 2015
Wright Report Q1-2, 2015
 
Buoyed by stronger economy, California housing market accelerates in March as...
Buoyed by stronger economy, California housing market accelerates in March as...Buoyed by stronger economy, California housing market accelerates in March as...
Buoyed by stronger economy, California housing market accelerates in March as...
 
April Phoenix East Valley Real Estate Market report
April Phoenix East Valley Real Estate Market reportApril Phoenix East Valley Real Estate Market report
April Phoenix East Valley Real Estate Market report
 
Northeast Ohio Home Sellers Guide
Northeast Ohio Home Sellers GuideNortheast Ohio Home Sellers Guide
Northeast Ohio Home Sellers Guide
 
Sue adler 2014 summary millburn short hills
Sue adler 2014 summary millburn short hillsSue adler 2014 summary millburn short hills
Sue adler 2014 summary millburn short hills
 
Building Products and Materials Industry Insights - Q3 2015
Building Products and Materials Industry Insights - Q3 2015Building Products and Materials Industry Insights - Q3 2015
Building Products and Materials Industry Insights - Q3 2015
 
August Market Report
August Market ReportAugust Market Report
August Market Report
 
March Phoenix East Valley Real Estate Market report
March Phoenix East Valley Real Estate Market reportMarch Phoenix East Valley Real Estate Market report
March Phoenix East Valley Real Estate Market report
 
Pierce Duncan Team - Fall 2015 Newsletter
Pierce Duncan Team - Fall 2015 NewsletterPierce Duncan Team - Fall 2015 Newsletter
Pierce Duncan Team - Fall 2015 Newsletter
 
Market Summary September 2015
Market Summary September 2015Market Summary September 2015
Market Summary September 2015
 
March 2015 Phoenix East Valley Real Estate Market report
March 2015 Phoenix East Valley Real Estate Market reportMarch 2015 Phoenix East Valley Real Estate Market report
March 2015 Phoenix East Valley Real Estate Market report
 
Annie Williams Real Estate Report Nov-Dec 2015
Annie Williams Real Estate Report Nov-Dec 2015Annie Williams Real Estate Report Nov-Dec 2015
Annie Williams Real Estate Report Nov-Dec 2015
 
Parma OH Home Owners Guide to the 2015 Real Esate Market
Parma OH Home Owners Guide to the 2015 Real Esate MarketParma OH Home Owners Guide to the 2015 Real Esate Market
Parma OH Home Owners Guide to the 2015 Real Esate Market
 
FINAL-McGuire-QR-4th2015
FINAL-McGuire-QR-4th2015FINAL-McGuire-QR-4th2015
FINAL-McGuire-QR-4th2015
 
Inventory and Sales Down - Real Estate Report February
Inventory and Sales Down - Real Estate Report FebruaryInventory and Sales Down - Real Estate Report February
Inventory and Sales Down - Real Estate Report February
 
December 2018 Realtor Report
December 2018 Realtor ReportDecember 2018 Realtor Report
December 2018 Realtor Report
 
2011.01 Market Watch
2011.01  Market  Watch2011.01  Market  Watch
2011.01 Market Watch
 
Median Home Price Stays Over $1MM - July/August Real Estate Report
Median Home Price Stays Over $1MM - July/August Real Estate ReportMedian Home Price Stays Over $1MM - July/August Real Estate Report
Median Home Price Stays Over $1MM - July/August Real Estate Report
 
Home Sales Pop in March - Real Estate Report April/May
Home Sales Pop in March - Real Estate Report April/MayHome Sales Pop in March - Real Estate Report April/May
Home Sales Pop in March - Real Estate Report April/May
 

Más de Rob Alley

West River Meadows Lot 52 has been sold by RE/MAX Realty Specialists and is u...
West River Meadows Lot 52 has been sold by RE/MAX Realty Specialists and is u...West River Meadows Lot 52 has been sold by RE/MAX Realty Specialists and is u...
West River Meadows Lot 52 has been sold by RE/MAX Realty Specialists and is u...Rob Alley
 
Kerr lake home construction 5 sep 2012
Kerr lake home construction 5 sep 2012Kerr lake home construction 5 sep 2012
Kerr lake home construction 5 sep 2012Rob Alley
 
Kerr lake home construction 1 sep 2012
Kerr lake home construction 1 sep 2012Kerr lake home construction 1 sep 2012
Kerr lake home construction 1 sep 2012Rob Alley
 
Construction 20120814
Construction 20120814Construction 20120814
Construction 20120814Rob Alley
 
Construction 20120810
Construction 20120810Construction 20120810
Construction 20120810Rob Alley
 
Winning with foreclosures
Winning with foreclosuresWinning with foreclosures
Winning with foreclosuresRob Alley
 
Short sale, foreclosure, reo
Short sale, foreclosure, reoShort sale, foreclosure, reo
Short sale, foreclosure, reoRob Alley
 
Distressed properties
Distressed propertiesDistressed properties
Distressed propertiesRob Alley
 
Reg Z Changes Ppt
Reg Z Changes PptReg Z Changes Ppt
Reg Z Changes PptRob Alley
 

Más de Rob Alley (9)

West River Meadows Lot 52 has been sold by RE/MAX Realty Specialists and is u...
West River Meadows Lot 52 has been sold by RE/MAX Realty Specialists and is u...West River Meadows Lot 52 has been sold by RE/MAX Realty Specialists and is u...
West River Meadows Lot 52 has been sold by RE/MAX Realty Specialists and is u...
 
Kerr lake home construction 5 sep 2012
Kerr lake home construction 5 sep 2012Kerr lake home construction 5 sep 2012
Kerr lake home construction 5 sep 2012
 
Kerr lake home construction 1 sep 2012
Kerr lake home construction 1 sep 2012Kerr lake home construction 1 sep 2012
Kerr lake home construction 1 sep 2012
 
Construction 20120814
Construction 20120814Construction 20120814
Construction 20120814
 
Construction 20120810
Construction 20120810Construction 20120810
Construction 20120810
 
Winning with foreclosures
Winning with foreclosuresWinning with foreclosures
Winning with foreclosures
 
Short sale, foreclosure, reo
Short sale, foreclosure, reoShort sale, foreclosure, reo
Short sale, foreclosure, reo
 
Distressed properties
Distressed propertiesDistressed properties
Distressed properties
 
Reg Z Changes Ppt
Reg Z Changes PptReg Z Changes Ppt
Reg Z Changes Ppt
 

Último

Listing Turkey - 2024 - May Featured Portfolio
Listing Turkey - 2024 - May Featured PortfolioListing Turkey - 2024 - May Featured Portfolio
Listing Turkey - 2024 - May Featured PortfolioListing Turkey
 
Top tourism places in Dubai - Inch & Brick Realty
Top tourism places in Dubai - Inch & Brick RealtyTop tourism places in Dubai - Inch & Brick Realty
Top tourism places in Dubai - Inch & Brick Realtypunitranainchbrick02
 
Vanam At Purva Soukhyam Guduvanchery.pdf.pdf
Vanam At Purva Soukhyam Guduvanchery.pdf.pdfVanam At Purva Soukhyam Guduvanchery.pdf.pdf
Vanam At Purva Soukhyam Guduvanchery.pdf.pdfkratirudram
 
Eldeco Dwarka Project In Delhi-brochure.pdf.pdf
Eldeco Dwarka Project In Delhi-brochure.pdf.pdfEldeco Dwarka Project In Delhi-brochure.pdf.pdf
Eldeco Dwarka Project In Delhi-brochure.pdf.pdfkratirudram
 
Low Rate Call girls in Sant Nagar{Delhi }8447779280} Service Escorts In South...
Low Rate Call girls in Sant Nagar{Delhi }8447779280} Service Escorts In South...Low Rate Call girls in Sant Nagar{Delhi }8447779280} Service Escorts In South...
Low Rate Call girls in Sant Nagar{Delhi }8447779280} Service Escorts In South...asmaqueen5
 
Rohan Harita Tathawade Pune Brochure.pdf
Rohan Harita Tathawade Pune Brochure.pdfRohan Harita Tathawade Pune Brochure.pdf
Rohan Harita Tathawade Pune Brochure.pdfabbu831446
 
Kalpataru Exquisite Wakad Pune E-Brochure.pdf
Kalpataru Exquisite Wakad Pune  E-Brochure.pdfKalpataru Exquisite Wakad Pune  E-Brochure.pdf
Kalpataru Exquisite Wakad Pune E-Brochure.pdfManishSaxena95
 
BPTP THE AMAARIO Luxury Project Invest Like Royalty in Sector 37D Gurgaon Dwa...
BPTP THE AMAARIO Luxury Project Invest Like Royalty in Sector 37D Gurgaon Dwa...BPTP THE AMAARIO Luxury Project Invest Like Royalty in Sector 37D Gurgaon Dwa...
BPTP THE AMAARIO Luxury Project Invest Like Royalty in Sector 37D Gurgaon Dwa...ApartmentWala1
 
Escort—>Call GiRls In Mori Gate Delhi —>8447779280—Service Escorts In South D...
Escort—>Call GiRls In Mori Gate Delhi —>8447779280—Service Escorts In South D...Escort—>Call GiRls In Mori Gate Delhi —>8447779280—Service Escorts In South D...
Escort—>Call GiRls In Mori Gate Delhi —>8447779280—Service Escorts In South D...asmaqueen5
 
Low Rate ✨➥9711108085▻✨Call Girls In East Of Kailash (E.K) (Delhi)
Low Rate ✨➥9711108085▻✨Call Girls In East Of Kailash (E.K) (Delhi)Low Rate ✨➥9711108085▻✨Call Girls In East Of Kailash (E.K) (Delhi)
Low Rate ✨➥9711108085▻✨Call Girls In East Of Kailash (E.K) (Delhi)delhi24hrs1
 
Real Estate Finance and Investments (2019).pdf
Real Estate Finance and Investments (2019).pdfReal Estate Finance and Investments (2019).pdf
Real Estate Finance and Investments (2019).pdfZahraYusuf9
 
Nyati Elite NIBM Road Pune E Brochure.pdf
Nyati Elite NIBM Road Pune E Brochure.pdfNyati Elite NIBM Road Pune E Brochure.pdf
Nyati Elite NIBM Road Pune E Brochure.pdfabbu831446
 
Yedi Mavi TOBB Zeytinburnu - Listing Turkey
Yedi Mavi TOBB Zeytinburnu - Listing TurkeyYedi Mavi TOBB Zeytinburnu - Listing Turkey
Yedi Mavi TOBB Zeytinburnu - Listing TurkeyListing Turkey
 
Cheap Rate ✨➥9711108085▻✨Call Girls In Connaught Place (Delhi)
Cheap Rate ✨➥9711108085▻✨Call Girls In Connaught Place (Delhi)Cheap Rate ✨➥9711108085▻✨Call Girls In Connaught Place (Delhi)
Cheap Rate ✨➥9711108085▻✨Call Girls In Connaught Place (Delhi)delhi24hrs1
 
Parksville 96 Surrey Floor Plans May 2024
Parksville 96 Surrey Floor Plans May 2024Parksville 96 Surrey Floor Plans May 2024
Parksville 96 Surrey Floor Plans May 2024VickyAulakh1
 
Call girls in Shakti Nagar Delhi~8447779280°/=@/ Short 1500 Night 6000}ESCORT...
Call girls in Shakti Nagar Delhi~8447779280°/=@/ Short 1500 Night 6000}ESCORT...Call girls in Shakti Nagar Delhi~8447779280°/=@/ Short 1500 Night 6000}ESCORT...
Call girls in Shakti Nagar Delhi~8447779280°/=@/ Short 1500 Night 6000}ESCORT...asmaqueen5
 
Low Rate ✨➥9711108085▻✨Call Girls In Majnu Ka Tilla (Mt) (Delhi)
Low Rate ✨➥9711108085▻✨Call Girls In Majnu Ka Tilla (Mt) (Delhi)Low Rate ✨➥9711108085▻✨Call Girls In Majnu Ka Tilla (Mt) (Delhi)
Low Rate ✨➥9711108085▻✨Call Girls In Majnu Ka Tilla (Mt) (Delhi)delhi24hrs1
 
Call girls In Rana Pratap Bagh {Delhi ↫8447779280↬Escort Service (Delhi)
Call girls In Rana Pratap Bagh {Delhi ↫8447779280↬Escort Service (Delhi)Call girls In Rana Pratap Bagh {Delhi ↫8447779280↬Escort Service (Delhi)
Call girls In Rana Pratap Bagh {Delhi ↫8447779280↬Escort Service (Delhi)asmaqueen5
 
construction material procurement in India
construction material procurement in Indiaconstruction material procurement in India
construction material procurement in Indiarohanindosup
 
Bridge & Elliot Ladner Floor Plans May 2024.pdf
Bridge & Elliot Ladner Floor Plans May 2024.pdfBridge & Elliot Ladner Floor Plans May 2024.pdf
Bridge & Elliot Ladner Floor Plans May 2024.pdfVickyAulakh1
 

Último (20)

Listing Turkey - 2024 - May Featured Portfolio
Listing Turkey - 2024 - May Featured PortfolioListing Turkey - 2024 - May Featured Portfolio
Listing Turkey - 2024 - May Featured Portfolio
 
Top tourism places in Dubai - Inch & Brick Realty
Top tourism places in Dubai - Inch & Brick RealtyTop tourism places in Dubai - Inch & Brick Realty
Top tourism places in Dubai - Inch & Brick Realty
 
Vanam At Purva Soukhyam Guduvanchery.pdf.pdf
Vanam At Purva Soukhyam Guduvanchery.pdf.pdfVanam At Purva Soukhyam Guduvanchery.pdf.pdf
Vanam At Purva Soukhyam Guduvanchery.pdf.pdf
 
Eldeco Dwarka Project In Delhi-brochure.pdf.pdf
Eldeco Dwarka Project In Delhi-brochure.pdf.pdfEldeco Dwarka Project In Delhi-brochure.pdf.pdf
Eldeco Dwarka Project In Delhi-brochure.pdf.pdf
 
Low Rate Call girls in Sant Nagar{Delhi }8447779280} Service Escorts In South...
Low Rate Call girls in Sant Nagar{Delhi }8447779280} Service Escorts In South...Low Rate Call girls in Sant Nagar{Delhi }8447779280} Service Escorts In South...
Low Rate Call girls in Sant Nagar{Delhi }8447779280} Service Escorts In South...
 
Rohan Harita Tathawade Pune Brochure.pdf
Rohan Harita Tathawade Pune Brochure.pdfRohan Harita Tathawade Pune Brochure.pdf
Rohan Harita Tathawade Pune Brochure.pdf
 
Kalpataru Exquisite Wakad Pune E-Brochure.pdf
Kalpataru Exquisite Wakad Pune  E-Brochure.pdfKalpataru Exquisite Wakad Pune  E-Brochure.pdf
Kalpataru Exquisite Wakad Pune E-Brochure.pdf
 
BPTP THE AMAARIO Luxury Project Invest Like Royalty in Sector 37D Gurgaon Dwa...
BPTP THE AMAARIO Luxury Project Invest Like Royalty in Sector 37D Gurgaon Dwa...BPTP THE AMAARIO Luxury Project Invest Like Royalty in Sector 37D Gurgaon Dwa...
BPTP THE AMAARIO Luxury Project Invest Like Royalty in Sector 37D Gurgaon Dwa...
 
Escort—>Call GiRls In Mori Gate Delhi —>8447779280—Service Escorts In South D...
Escort—>Call GiRls In Mori Gate Delhi —>8447779280—Service Escorts In South D...Escort—>Call GiRls In Mori Gate Delhi —>8447779280—Service Escorts In South D...
Escort—>Call GiRls In Mori Gate Delhi —>8447779280—Service Escorts In South D...
 
Low Rate ✨➥9711108085▻✨Call Girls In East Of Kailash (E.K) (Delhi)
Low Rate ✨➥9711108085▻✨Call Girls In East Of Kailash (E.K) (Delhi)Low Rate ✨➥9711108085▻✨Call Girls In East Of Kailash (E.K) (Delhi)
Low Rate ✨➥9711108085▻✨Call Girls In East Of Kailash (E.K) (Delhi)
 
Real Estate Finance and Investments (2019).pdf
Real Estate Finance and Investments (2019).pdfReal Estate Finance and Investments (2019).pdf
Real Estate Finance and Investments (2019).pdf
 
Nyati Elite NIBM Road Pune E Brochure.pdf
Nyati Elite NIBM Road Pune E Brochure.pdfNyati Elite NIBM Road Pune E Brochure.pdf
Nyati Elite NIBM Road Pune E Brochure.pdf
 
Yedi Mavi TOBB Zeytinburnu - Listing Turkey
Yedi Mavi TOBB Zeytinburnu - Listing TurkeyYedi Mavi TOBB Zeytinburnu - Listing Turkey
Yedi Mavi TOBB Zeytinburnu - Listing Turkey
 
Cheap Rate ✨➥9711108085▻✨Call Girls In Connaught Place (Delhi)
Cheap Rate ✨➥9711108085▻✨Call Girls In Connaught Place (Delhi)Cheap Rate ✨➥9711108085▻✨Call Girls In Connaught Place (Delhi)
Cheap Rate ✨➥9711108085▻✨Call Girls In Connaught Place (Delhi)
 
Parksville 96 Surrey Floor Plans May 2024
Parksville 96 Surrey Floor Plans May 2024Parksville 96 Surrey Floor Plans May 2024
Parksville 96 Surrey Floor Plans May 2024
 
Call girls in Shakti Nagar Delhi~8447779280°/=@/ Short 1500 Night 6000}ESCORT...
Call girls in Shakti Nagar Delhi~8447779280°/=@/ Short 1500 Night 6000}ESCORT...Call girls in Shakti Nagar Delhi~8447779280°/=@/ Short 1500 Night 6000}ESCORT...
Call girls in Shakti Nagar Delhi~8447779280°/=@/ Short 1500 Night 6000}ESCORT...
 
Low Rate ✨➥9711108085▻✨Call Girls In Majnu Ka Tilla (Mt) (Delhi)
Low Rate ✨➥9711108085▻✨Call Girls In Majnu Ka Tilla (Mt) (Delhi)Low Rate ✨➥9711108085▻✨Call Girls In Majnu Ka Tilla (Mt) (Delhi)
Low Rate ✨➥9711108085▻✨Call Girls In Majnu Ka Tilla (Mt) (Delhi)
 
Call girls In Rana Pratap Bagh {Delhi ↫8447779280↬Escort Service (Delhi)
Call girls In Rana Pratap Bagh {Delhi ↫8447779280↬Escort Service (Delhi)Call girls In Rana Pratap Bagh {Delhi ↫8447779280↬Escort Service (Delhi)
Call girls In Rana Pratap Bagh {Delhi ↫8447779280↬Escort Service (Delhi)
 
construction material procurement in India
construction material procurement in Indiaconstruction material procurement in India
construction material procurement in India
 
Bridge & Elliot Ladner Floor Plans May 2024.pdf
Bridge & Elliot Ladner Floor Plans May 2024.pdfBridge & Elliot Ladner Floor Plans May 2024.pdf
Bridge & Elliot Ladner Floor Plans May 2024.pdf
 

Charlottesville Real Estate Market Update - 1st Quater 2015

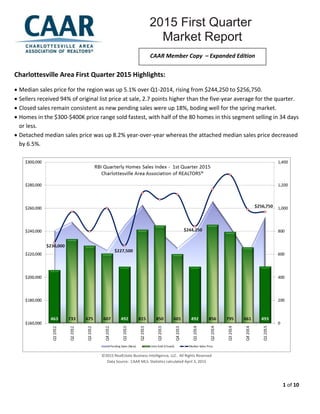
  • 1. 1 of 10 Charlottesville Area First Quarter 2015 Highlights:  Median sales price for the region was up 5.1% over Q1-2014, rising from $244,250 to $256,750.  Sellers received 94% of original list price at sale, 2.7 points higher than the five-year average for the quarter.  Closed sales remain consistent as new pending sales were up 18%, boding well for the spring market.  Homes in the $300-$400K price range sold fastest, with half of the 80 homes in this segment selling in 34 days or less.  Detached median sales price was up 8.2% year-over-year whereas the attached median sales price decreased by 6.5%. ©2015 RealEstate Business Intelligence, LLC. All Rights Reserved Data Source: CAAR MLS. Statistics calculated April 3, 2015 2015 First Quarter Market Report 2011 Year End Market Report Market ReportReport CAAR Member Copy – Expanded Edition
  • 2. 2 of 10 Sales Activity – There were 493 homes sold in the 1st Quarter in Greater Charlottesville, virtually unchanged from Q1-2014 with only one additional closed sale. While the sales rate is even versus the same quarter last year, it is 4.3% higher than the five-year average for the quarter. The 106 attached homes sold (including condos and attached single family homes) is 3.9% higher in Q1-2014 posted sales. Condos had the largest jump in sales, increasing from 34 last year to 48 in Q1-2015, a gain of 41.2%. The 387 detached homes sold represented a nominal 0.8% decrease (-3 sales) compared to Q1-2014. There were notable shifts in the number of smaller homes purchased compared to larger home segments. Sales of homes with a living area of less than 1,200 square feet increased 27.5% versus Q1-2014 (88 vs. 69 sales) while 3,000+ square foot home sales decreased 5.3% (90 vs. 95 sales). While these home size segments account for less than a fifth of the total sales respectively, diverging trends in these outer quantiles can have an outsized effect on the average (mean) sales price. This helps explain why, despite a 5.1% jump in the median sales price seen in Greater Charlottesville compared to Q1-2014, the average sales price dropped 8.9%. Further influencing this average/mean price decline, the 13 homes sold in the largest home segment analyzed (5,000+ sqft) had an average sales price of $1.1M in Q1-2015, down 29.4% compared to the average sales price of $1.6M for the 16 homes sold in Q1-2014. The exaggerated impact that outlier segments can have on average/mean trends is why analysts tend to refer almost exclusively to shifts in the median when describing housing market trends. ©2015 RealEstate Business Intelligence, LLC. All Rights Reserved Data Source: CAAR MLS. Statistics calculated April 3, 2015 Nelson County, the most affordable county with a Q1 median sales price that was over $100,000 lower than that of the greater region, had the largest percent increase in sales (+27.1%). Conversely, in Albemarle County, the most expensive county with a Q1 median sales price nearly $75,000 higher than that of the region, closed sales were down a modest 3.4%. Fluvanna (-15.1%) had the largest percent decrease, with 14 fewer sales than Q1-2014. Louisa’s 48 sales were seven more than last year (+17.1%), while Charlottesville and Greene both saw modest sales gains of 5.1% and 2.3%, respectively. All told, Albemarle home sales accounted for just 39.8% of Greater Charlottesville’s total sales, the lowest Q1 share for the county since Q1-2008. Normal seasonal patterns suggest Albemarle’s share should approach 50% in the second quarter and the Q2 median sales price for Greater Charlottesville should increase significantly from the Q1 level as well.
  • 3. 3 of 10 Inventory – While closed sales were level with the same period one year ago, the 929 new pending sales represent an 18% increase over Q1-2014. Notably, the 399 new pending sales in March were the highest March-level since 2005, and exceeded the five-year March average of 318 new pendings by 25.5%. The 855 pendings at quarter’s end is 25.2% higher than the total pendings headed into the 2nd Quarter last year indicating a strong start to spring sales. Five of the six jurisdictions have over 20% more pending sales at quarter’s end than last year, Charlottesville being the exception with 5.9% fewer pending sales. For the fourth consecutive quarter, Q1 seller activity exceeded the prior year’s level. The 1,401 new listings added were 9.4% more than the 1,281 new listings added in Q1-2014. Albemarle had the largest net gain with over 100 more listings added than last year, 726 versus 618 (+17.5%). Louisa’s 116 new listings for the quarter represented the highest percent increase, gaining 34.9% over it’s Q1-2014 total. With 227 new listings, Charlottesville was the only other jurisdiction with more respective listings added, gaining 6.6%. Fluvanna saw the largest year-over-year decline in new listing activity for the quarter, dipping 11% to 145. Greene’s 82 new listings were 7.9% down while Nelson saw 6.3% fewer listings with 105. Despite the momentum of new listings added to the market, active inventory headed into the 2nd Quarter was 7.6% lower than the same point last year. With 1,915 active listings, 2015 marked the first time in nine years that supply headed into April dipped below the 2,000 listings. The 18% gain in new pending sales more than offset the 9.4% uptick in new listings. Using the average monthly sales pace over the last twelve months, the 1,915 active listings represent 9.0 months of supply. This is down from 9.7 months at this point in 2014 and two months lower than the five-year average of 10.9 months for this time of year. “Our first quarter statistics remain consistent compared to previous years, which reconfirms the value appreciation when investing in real estate,” said CAAR President, Anita Dunbar. “Despite having limited homes available, our market home prices are holding strong and the demand is growing as indicated by the high percentage of pending sales.” ©2015 RealEstate Business Intelligence, LLC. All Rights Reserved Data Source: CAAR MLS. Statistics calculated April 3, 2015
  • 4. 4 of 10 Days on Market (DOM) and Pricing – The median DOM for Greater Charlottesville in the 1st Quarter was 73 days, three days lower than Q1-2014 and the lowest Q1-level since 2006. One in five homes sold during the quarter (20.9%) were on the market 10 days or less. Homes in the $300k-$400k price range sold fastest, with half of the 80 homes in this segment selling in 34 days or fewer. With a median DOM of 52 days, townhomes sold faster than detached homes (71 days) and condos (136 days). The average DOM for homes sold in the 1st Quarter was 138 days, 12 days more than the Q1-2014 level (126 days), but more than two weeks lower than the five-year Q1 average of 155 days. ©2015 RealEstate Business Intelligence, LLC. All Rights Reserved Data Source: CAAR MLS. Statistics calculated April 3, 2015 Homes sold fastest, based on median DOM levels, in Louisa (56 days) and Greene (59 days). Albemarle homes took nine days fewer to sell than last year, with a median DOM of 64 days. The city of Charlottesville was the other jurisdiction with a lower level than the region, but its 69-day median was 19 days higher than Q1-2014. Fluvanna homes took more than a month longer than the rest of the region, though the county saw its median DOM fall by more than two weeks, from 122 to 106 days. Nelson’s level more than doubled from Q1-2014, spiking to 185 days. With half of its 47 sales in the 1st Quarter sitting on the market for over six months, it’s not surprising that Nelson sellers received a significantly lower percentage of original asking price than the other jurisdictions in Greater Charlottesville. ©2015 RealEstate Business Intelligence, LLC. All Rights Reserved Data Source: CAAR MLS. Statistics calculated April 3, 2015
  • 5. 5 of 10 Nelson sellers received 85.7% of the original list price in Q1-2015 compared to 87.9% last year, eight points below the 94.0% mark for Greater Charlottesville. This regional level was 1.4 points higher than in Q1-2014 (92.6%) and 2.7 points above the five-year Q1 average (91.3%). As demand improved, five of the six jurisdictions saw gains in their average sold price (SP) to original list price (OLP) ratio, led by a 3.3 point bump in Louisa. At 96.4%, the average SP to OLP ratio in Louisa was slightly higher than Charlottesville, which had an average ratio of 96%. Greene (95.9%) and Albemarle (95.3%) also had higher averages than the greater region. Fluvanna’s 91.1% level was an improvement from Q1-2014, but nearly three points below the regional average. “Nelson County had the most dramatic statistics from this first quarter. Although it had a 27.1% increase in total sales, the jurisdiction showed a dramatic drop in median sales price and doubled its days on the market from Q1-2014,” said CAAR President-Elect, Donna Patton. Home Prices – ©2015 RealEstate Business Intelligence, LLC. All Rights Reserved Data Source: CAAR MLS. Statistics calculated April 3, 2015 At $256,750, the 1st Quarter median sales price in Greater Charlottesville reached the highest Q1-level since 2009. It was 5.1% higher than Q1-2014 and shows a 12.9% appreciation over Q1-2013 when prices bottomed out at $227,500. Detached homes saw the highest year-over-year price gains, increasing 8.2% to $277,750. The $204,500 median price for the attached segment (which includes both single family homes and condos) represented a 6.5% decrease from Q1-2014. ©2015 RealEstate Business Intelligence, LLC. All Rights Reserved Data Source: CAAR MLS. Statistics calculated April 3, 2015
  • 6. 6 of 10 Half of the jurisdictions saw year-over-year gains in median sales price in the 1st Quarter. Louisa ($211,500) led the region in price gains with a 23.6% increase. Albemarle ($330,000) and Greene ($205,000) saw modest gains, up 3.8% and 1.3%, respectively. Charlottesville ($275,100) and Fluvanna ($174,750) only saw modest declines of 1.8% and 3.6%. Nelson ($147,000) was the only county to see a significant drop, falling 33.2% from Q1-2014.
  • 8. 8 of 10 Attached vs. Detached Homes – Prices in the detached housing segment outperformed the attached segment in Greater Charlottesville in the 1st Quarter. The median sales price for detached homes was up 8.2% from Q1-2014 to $277,750. This represented the highest Q1- level since 2009. The $204,500 median sales price for attached homes was 6.5% less than Q1-2014, primarily due to the increased share that condos accounted for this quarter. Condo properties, which had a median sales price of $139,000, accounted for 45% of attached homes sold, while the higher priced townhome segment (median sales price of $243,500) made up 55% of attached sales. This is a significant shift compared to Q1-2014, when condos accounted for only 33% of all attached sales. There was a 3.9% increase in attached sales, with four more than Q1-2014. This despite the fact that townhome sales dropped 14.7%, or ten sales, to a total of 58 for the quarter. The 41.2% spike in condos, with 48 1st Quarter sales compared to 34 in Q1-2014, kept the attached segment tally above last year’s level. Detached home sales were flat with only three fewer sales than last year. Townhomes continue to sell faster than detached homes and condos, with a median DOM of 52 days. Half the condos sold were on the market for 136 days or longer, the highest median DOM for this segment since the 1st quarter of 2013. Detached homes had a median of 71 days, seven days lower than Q1-2014. Distressed Inventory – Only 46 of the 493 sales in the 1st Quarter, or 9.3%, were foreclosures. This represents 17 fewer foreclosure sales versus Q1-2014, when foreclosures accounted for 12.8% of sales. This was the fifth consecutive quarter with fewer foreclosure sales than the previous year and the ninth quarter in the last ten quarters. Short sales continue to be a virtual non-factor All Residential Q1-15 % Q-O-Q Q4-14 % Y-O-Y Q1-14 % Y-O-2Y Q1-13 % Y-O-3Y Q1-12 Average Sales Price $306,075 -9.1% $336,818 -7.9% $332,461 10.6% $276,795 9.2% $280,244 Median Sales Price $256,750 -0.9% $259,000 5.1% $244,250 12.9% $227,500 11.6% $230,000 Units Sold (Closed) 493 -25.4% 661 0.2% 492 0.2% 492 6.5% 463 Average DOM (Closed) 138 9.5% 126 9.5% 126 -18.8% 170 -17.4% 167 Listing Discount (Average) 6.0% 6.5% 7.4% 9.1% 10.3% Avg SP to OLP Ratio 94.0% 93.5% 92.6% 91.0% 89.7% Avg SP/Sq Ft $139 -2.8% $143 1.5% $137 7.8% $129 10.3% $126 Detached Q1-15 % Q-O-Q Q4-14 % Y-O-Y Q1-14 % Y-O-2Y Q1-13 % Y-O-3Y Q1-12 Average Sales Price $328,190 -9.6% $363,123 -7.3% $353,854 10.0% $298,318 8.5% $302,614 Median Sales Price $277,750 1.7% $273,000 8.2% $256,750 13.6% $244,500 12.4% $247,000 Units Sold (Closed) 387 -25.7% 521 -0.8% 390 -0.3% 388 9.9% 352 Average DOM (Closed) 139 9.4% 127 6.1% 131 -15.8% 165 -16.8% 167 Listing Discount (Average) 5.6% 6.4% 8.1% 9.4% 11.1% Avg SP to OLP Ratio 94.4% 93.6% 91.9% 90.6% 88.9% Avg SP/Sq Ft $137 -4.2% $143 3.0% $133 7.9% $127 13.2% $121 Attached Q1-15 % Q-O-Q Q4-14 % Y-O-Y Q1-14 % Y-O-2Y Q1-13 % Y-O-3Y Q1-12 Average Sales Price $225,545 -5.6% $238,926 -10.0% $250,665 14.8% $196,498 7.8% $209,304 Median Sales Price $204,500 -4.3% $213,750 -6.5% $218,750 11.4% $183,520 6.0% $193,000 Units Sold (Closed) 106 -24.3% 140 3.9% 102 1.9% 104 -4.5% 111 Average DOM (Closed) 136 11.5% 122 28.3% 106 -28.4% 190 -18.1% 166 Listing Discount (Average) 7.3% 7.1% 4.8% 7.8% 7.5% Avg SP to OLP Ratio 92.7% 93.0% 95.3% 92.2% 92.5% Avg SP/Sq Ft $145 2.8% $141 -3.3% $150 5.8% $137 2.8% $141 RBI Key Housing Trend Metrics Charlottesville Area Association of REALTORS®
  • 9. 9 of 10 in Greater Charlottesville, accounting for only 3.4% of all sales. The 17 short sales were three less than Q1-2014, when short sales accounted for 4.1% of sales. The median sales price for foreclosures was $115,000, down 7.3% from last year. The median sales price for short sales was $197,250, a gain of 6.9%. The 430 non-distressed sales were 5.1% more than the 409 in Q1-2014 and their median sales price of $276,000 represented a 1.5% year-over-year increase. The 1,401 listings added during the 1st Quarter represented a 9.4% increase from last year’s total. However, the 76 distressed listings added during the quarter represented an 8.4% decrease from the number listed during the same quarter last year. There were 63 foreclosed properties listed, slightly more than the 60 added in Q1-2014. There were only 14 new short sale listings, down from 23. The 1,325 non-distressed listings added represented a 10.6% increase from Q1-2014. Distressed listings accounted for only 5.5% of new listings, down from 6.5% of new listings in Q1-2014. Land/Acreage Sales – There were 63 land/acreage sales in Greater Charlottesville in the 1st Quarter, down 35.1% from Q1-2014 and the lowest 1st Quarter tally since 2011. With 35 sales, the <5 acre segment saw the largest decrease, with 22 fewer sales than Q1- 2014. Land sales in the 5-25 acre segment also declined, from 26 sales in Q1-2014 to 18 sales in Q1-2015. There were ten sales in the >25 acre segment, three fewer than the same quarter last year.
  • 10. 10 of 10 ©2015 RealEstate Business Intelligence, LLC. All Rights Reserved Data Source: CAAR MLS. Statistics calculated April 3, 2015 Land sales were down in all six jurisdictions, with the biggest decrease in Albemarle, where land sales dropped from 42 in Q1-2014 to 25 this quarter. Nelson had the next highest land sales total at 13, though this was down from 16 last year. Fluvanna had 11 land sales, five fewer than last year. The four land sales in Greene were down from seven last year, though the three of the four sales were for 5 acres or more. Land sales in Louisa fell from 13 to nine, though there was a >25 acre sale this quarter. There was only one land sale in Charlottesville in the 1st Quarter, down from three last year. ©2015 RealEstate Business Intelligence, LLC. All Rights Reserved Data Source: CAAR MLS. Statistics calculated April 3, 2015