Chapter 7
Medical Care Production and Costs
(c) 2012 Cengage Learning. All Rights Reserved. May not be copied, scanned, or duplicated, in whole or in part, except for use as permitted in a license distributed with a certain product or service or otherwise on a password-protected website for classroom use.
The Short-Run Production Function of the Representative Medical Firm
Assumptions of short-run production:
Medical firm produces a single output of medical services, q
Only two medical inputs exist: nurse-hours, n, and a composite capital good, k
Quantity of capital is fixed at some amount
(c) 2012 Cengage Learning. All Rights Reserved. May not be copied, scanned, or duplicated, in whole or in part, except for use as permitted in a license distributed with a certain product or service or otherwise on a password-protected website for classroom use.
The Short-Run Production Function of the Representative Medical Firm
Medical firm faces an incentive to produce as efficiently as possible
Medical firm possesses perfect information regarding the demands for its product
(c) 2012 Cengage Learning. All Rights Reserved. May not be copied, scanned, or duplicated, in whole or in part, except for use as permitted in a license distributed with a certain product or service or otherwise on a password-protected website for classroom use.
The Short-Run Production Function of the Representative Medical Firm
Production function:
Identifies different ways nurse-hours & capital can be combined
To produce various levels of medical services
(c) 2012 Cengage Learning. All Rights Reserved. May not be copied, scanned, or duplicated, in whole or in part, except for use as permitted in a license distributed with a certain product or service or otherwise on a password-protected website for classroom use.
The Short-Run Production Function of the Representative Medical Firm
Each level of output produced by -
Several different combinations of the nurse and capital inputs
Each combination – assumed to be technically efficient – maximum amount of output that is feasible given the state of technology
(c) 2012 Cengage Learning. All Rights Reserved. May not be copied, scanned, or duplicated, in whole or in part, except for use as permitted in a license distributed with a certain product or service or otherwise on a password-protected website for classroom use.
The Short-Run Production Function of the Representative Medical Firm
Law of diminishing marginal productivity
At first, total output increases at an increasing rate
After some point, it increases at a decreasing rate
Total product curve, TP
Depicts total output produced by different levels of the variable input, holding all other inputs constant
(c) 2012 Cengage Learning. All Rights Reserved. May not be copied, scanned, or duplicated, in whole or in part, except for use as permitted in a license distributed with a certain product or service or otherwise on a password-protected website for classro.
Chapter 7Medical Care Production and Costs(c) 2012 Cengage.docx
1. Chapter 7
Medical Care Production and Costs
(c) 2012 Cengage Learning. All Rights Reserved. May not be
copied, scanned, or duplicated, in whole or in part, except for
use as permitted in a license distributed with a certain product
or service or otherwise on a password-protected website for
classroom use.
The Short-Run Production Function of the Representative
Medical Firm
Assumptions of short-run production:
Medical firm produces a single output of medical services, q
Only two medical inputs exist: nurse-hours, n, and a composite
capital good, k
Quantity of capital is fixed at some amount
(c) 2012 Cengage Learning. All Rights Reserved. May not be
copied, scanned, or duplicated, in whole or in part, except for
use as permitted in a license distributed with a certain product
or service or otherwise on a password-protected website for
classroom use.
The Short-Run Production Function of the Representative
Medical Firm
Medical firm faces an incentive to produce as efficiently as
possible
Medical firm possesses perfect information regarding the
demands for its product
2. (c) 2012 Cengage Learning. All Rights Reserved. May not be
copied, scanned, or duplicated, in whole or in part, except for
use as permitted in a license distributed with a certain product
or service or otherwise on a password-protected website for
classroom use.
The Short-Run Production Function of the Representative
Medical Firm
Production function:
Identifies different ways nurse-hours & capital can be combined
To produce various levels of medical services
(c) 2012 Cengage Learning. All Rights Reserved. May not be
copied, scanned, or duplicated, in whole or in part, except for
use as permitted in a license distributed with a certain product
or service or otherwise on a password-protected website for
classroom use.
The Short-Run Production Function of the Representative
Medical Firm
Each level of output produced by -
Several different combinations of the nurse and capital inputs
Each combination – assumed to be technically efficient –
maximum amount of output that is feasible given the state of
technology
(c) 2012 Cengage Learning. All Rights Reserved. May not be
copied, scanned, or duplicated, in whole or in part, except for
3. use as permitted in a license distributed with a certain product
or service or otherwise on a password-protected website for
classroom use.
The Short-Run Production Function of the Representative
Medical Firm
Law of diminishing marginal productivity
At first, total output increases at an increasing rate
After some point, it increases at a decreasing rate
Total product curve, TP
Depicts total output produced by different levels of the variable
input, holding all other inputs constant
(c) 2012 Cengage Learning. All Rights Reserved. May not be
copied, scanned, or duplicated, in whole or in part, except for
use as permitted in a license distributed with a certain product
or service or otherwise on a password-protected website for
classroom use.
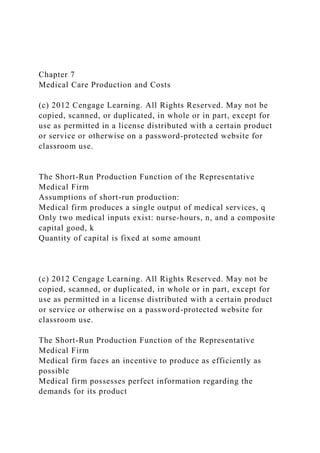
Figure 7.1 - The Total Product Curve
Nurse-hours (n)
n2
n1
Δq
Δn
The total product curve shows that output initially increases at
an increasing rate from 0 to n1 nurse-hours, then increases at a
decreasing rate from n1 to n2 nurse-hours, and finally declines
after n2 nurse-hours as the medical firm employs more nurse-
hours.
Quantity of
medical
services
(q)
4. 0
Diminishing marginal productivity provides the reason why
output fails to expand at an increasing rate after n1 nurse-hours.
TP
(c) 2012 Cengage Learning. All Rights Reserved. May not be
copied, scanned, or duplicated, in whole or in part, except for
use as permitted in a license distributed with a certain product
or service or otherwise on a password-protected website for
classroom use.
Marginal and Average Products
Marginal product
Change in total output associated with a one-unit change in the
variable input
MPn= Δ q/Δn
Magnitude of the marginal product of a nurse-hour reveals -
Additional quantity of medical services produced by each
additional nurse-hour
(c) 2012 Cengage Learning. All Rights Reserved. May not be
copied, scanned, or duplicated, in whole or in part, except for
use as permitted in a license distributed with a certain product
or service or otherwise on a password-protected website for
classroom use.
Marginal and Average Products
Marginal product
Initially, increasing marginal productivity
MPn is positive and increasing
Next, diminishing marginal productivity sets in
5. MPn is positive but decreasing
Next, MPn = 0
When total product is maximized
After, MPn is negative
(c) 2012 Cengage Learning. All Rights Reserved. May not be
copied, scanned, or duplicated, in whole or in part, except for
use as permitted in a license distributed with a certain product
or service or otherwise on a password-protected website for
classroom use.
Figure 7.2 - The Marginal Product Curve
Nurse-hours (n)
Marginal
product of
nurse-hours
(MPn)
0
n2
n1
MPn
Marginal productivity first increases with the number of nurse-
hours because of synergy and labor specialization and then falls
because of the fixed input that exists in the short run.
The marginal product of an additional nurse-hour is found by
dividing the change in output by the change in the number of
nurse-hours and is measured by the slope of the total product
curve.
(c) 2012 Cengage Learning. All Rights Reserved. May not be
copied, scanned, or duplicated, in whole or in part, except for
6. use as permitted in a license distributed with a certain product
or service or otherwise on a password-protected website for
classroom use.
Marginal and Average Products
Average product, APn
Total quantity of medical services divided by the total number
of nurse-hours
APn = q/n
Average quantity of medical services produced within an hour
Derived from the total product curve
(c) 2012 Cengage Learning. All Rights Reserved. May not be
copied, scanned, or duplicated, in whole or in part, except for
use as permitted in a license distributed with a certain product
or service or otherwise on a password-protected website for
classroom use.
Figure 7.3 - Deriving the Average Product Curve from Total
Product Curve
Nurse-hours (n)
TP
n3
Quantity of
medical
services
(q)
0
Nurse-hours (n)
Average
product of
nurse-hours
(APn)
7. 0
n3
APn
The average product of a nurse-hour is found by dividing total
output by the total number of nurse-hours and can be derived by
measuring the slope of a ray emanating from the origin to each
point on the total product curve. Average productivity first
increases with the number of nurse-hours and then declines
because of increasing and then diminishing marginal
productivity.
A
C
B
(c) 2012 Cengage Learning. All Rights Reserved. May not be
copied, scanned, or duplicated, in whole or in part, except for
use as permitted in a license distributed with a certain product
or service or otherwise on a password-protected website for
classroom use.
Marginal and Average Products
Average product, APn
Initially increases
Reaches a maximum
Then decreases
Law of diminishing marginal productivity
(c) 2012 Cengage Learning. All Rights Reserved. May not be
8. copied, scanned, or duplicated, in whole or in part, except for
use as permitted in a license distributed with a certain product
or service or otherwise on a password-protected website for
classroom use.
Marginal and Average Products
Marginal and average product curves
MP curve cuts AP curve at its maximum point
MP is above AP whenever AP is increasing
MP is below AP whenever AP is declining
(c) 2012 Cengage Learning. All Rights Reserved. May not be
copied, scanned, or duplicated, in whole or in part, except for
use as permitted in a license distributed with a certain product
or service or otherwise on a password-protected website for
classroom use.
Marginal and Average Products
At some point in the production process:
The additional nurse becomes less productive due to the
constraint imposed by the fixed input
Marginal productivity
Influences the average productivity of the team of nurses
(c) 2012 Cengage Learning. All Rights Reserved. May not be
copied, scanned, or duplicated, in whole or in part, except for
use as permitted in a license distributed with a certain product
or service or otherwise on a password-protected website for
classroom use.
Figure 7.4 - Relation between Marginal and Average Product
Curves
9. Nurse-hours (n)
Marginal
and average
products of
nurse-hours
0
n1
MPn
n3
APn
n2
Average productivity rises when marginal productivity exceeds
average productivity. Average productivity falls when marginal
productivity lies below average productivity. Marginal
productivity equals average productivity when average
productivity is maximized.
(c) 2012 Cengage Learning. All Rights Reserved. May not be
copied, scanned, or duplicated, in whole or in part, except for
use as permitted in a license distributed with a certain product
or service or otherwise on a password-protected website for
classroom use.
Elasticity of Input Substitution
More than one variable input
Substitution between any two variable inputs
Degree of substitutability depends on technical and legal
considerations
Elasticity of substitution
Percentage change in the input ratio divided by the percentage
change in the ratio of the inputs’ marginal productivities,
holding constant the level of output
10. (c) 2012 Cengage Learning. All Rights Reserved. May not be
copied, scanned, or duplicated, in whole or in part, except for
use as permitted in a license distributed with a certain product
or service or otherwise on a password-protected website for
classroom use.
Elasticity of Input Substitution
Elasticity of substitution, σ
Ii(i=1,2) - Quantity employed of each input
MP2/MP1 - ratio of marginal productivities
Marginal rate of technical substitution
Rate at which one input substitutes for the other in the
production process, at the margin
(c) 2012 Cengage Learning. All Rights Reserved. May not be
copied, scanned, or duplicated, in whole or in part, except for
use as permitted in a license distributed with a certain product
or service or otherwise on a password-protected website for
classroom use.
Elasticity of Input Substitution
Elasticity of substitution, σ
Percentage change in the input ratio that results from a 1
percent change in the marginal rate of technical substitution
If σ = 0
Variable inputs cannot be substituted
11. If σ = ∞
Variable inputs are perfect substitutes in production
(c) 2012 Cengage Learning. All Rights Reserved. May not be
copied, scanned, or duplicated, in whole or in part, except for
use as permitted in a license distributed with a certain product
or service or otherwise on a password-protected website for
classroom use.
A Production Function for Hospital Admissions
Case-mix-adjusted hospital admissions = f(Physicians,
nurses, other non-physician staff, hospital beds, X)
Marginal product for each input
Positive, declined in magnitude with greater usage
Law of diminishing marginal product
Nurse input - The most productive input
(c) 2012 Cengage Learning. All Rights Reserved. May not be
copied, scanned, or duplicated, in whole or in part, except for
use as permitted in a license distributed with a certain product
or service or otherwise on a password-protected website for
classroom use.
A Production Function for Hospital Admissions
Each input - a substitute for the others
Substitution elasticities between
Physicians and nurses - 0.547
A 10% increase in the marginal productivity of a doctor causes
a 5.47% increase in the ratio of nurses to doctors
Physicians and beds - 0.175
12. Nurses and beds - 0.124
Hospital policy makers can avoid some of the price (wage)
increase in any one input by substituting with the others
(c) 2012 Cengage Learning. All Rights Reserved. May not be
copied, scanned, or duplicated, in whole or in part, except for
use as permitted in a license distributed with a certain product
or service or otherwise on a password-protected website for
classroom use.
Short-Run Cost Theory of the Representative Medical Firm
Total cost = Explicit + Implicit costs
Explicit costs
Market transaction
Wage payments to the hourly medical staff, electric utility bills,
and medical supply expenses
Accountants
Implicit costs
Opportunity costs of using any resources the medical firm owns
(c) 2012 Cengage Learning. All Rights Reserved. May not be
copied, scanned, or duplicated, in whole or in part, except for
use as permitted in a license distributed with a certain product
or service or otherwise on a password-protected website for
classroom use.
The Short-Run Cost Curves of the Representative Medical Firm
Short-run total cost, STC
Variable input nurse-hours - n
Fixed input capital - k
Level of medical output - q
Input prices - Assumed fixed
13. w- hourly wage for a nurse
r- rental or opportunity cost of capital
(c) 2012 Cengage Learning. All Rights Reserved. May not be
copied, scanned, or duplicated, in whole or in part, except for
use as permitted in a license distributed with a certain product
or service or otherwise on a password-protected website for
classroom use.
The Short-Run Cost Curves of the Representative Medical Firm
Short-run total costs of production, STC
Depend on quantities and prices of inputs employed
Total variable cost of production, STVC
Wage rate times the number of nurse-hours
Total wage bill
Responds to changes in the level of output
Total fixed costs of production, STFC
Rental price times the quantity of capital
Does not respond to changes in output
(c) 2012 Cengage Learning. All Rights Reserved. May not be
copied, scanned, or duplicated, in whole or in part, except for
use as permitted in a license distributed with a certain product
or service or otherwise on a password-protected website for
classroom use.
The Short-Run Cost Curves of the Representative Medical Firm
14. Calculating short-run total cost
Identify necessary number of nurse hours, n
Or each level of medical output
STVC = w × n
STC = STFC + STVC
Relation between STC and TP
When TP is increasing at an increasing rate
STC – increasing at a decreasing rate
When TP increasing at a decreasing rate
STC - increasing at an increasing rate
(c) 2012 Cengage Learning. All Rights Reserved. May not be
copied, scanned, or duplicated, in whole or in part, except for
use as permitted in a license distributed with a certain product
or service or otherwise on a password-protected website for
classroom use.
Figure 7.5 - The Short-Run Total Cost Curve
Quantity of
medical services (q)
STC
q2
q1
Cost of medical
services
0
STC2
w × n=STVC
r × k=STFC
STC first increases at a decreasing rate up to point q1 and then
increases at an increasing rate with respect to producing more
15. output. STC increases at an increasing rate after q1 because of
diminishing marginal productivity.
The short-run total cost, STC, of producing medical services
equals the sum of the total variable, STVC, and fixed costs,
STFC.
(c) 2012 Cengage Learning. All Rights Reserved. May not be
copied, scanned, or duplicated, in whole or in part, except for
use as permitted in a license distributed with a certain product
or service or otherwise on a password-protected website for
classroom use.
The Short-Run Cost Curves of the Representative Medical Firm
Fixed costs
Occur in the short-run (operating period)
Levels of some inputs are fixed
Variable costs
All inputs are variable during the long run or planning period
(c) 2012 Cengage Learning. All Rights Reserved. May not be
copied, scanned, or duplicated, in whole or in part, except for
use as permitted in a license distributed with a certain product
or service or otherwise on a password-protected website for
classroom use.
Short-Run Per-Unit Costs of Production
Short-run marginal costs, SMC
Change in total costs associated with a one-unit change in
output
16. (c) 2012 Cengage Learning. All Rights Reserved. May not be
copied, scanned, or duplicated, in whole or in part, except for
use as permitted in a license distributed with a certain product
or service or otherwise on a password-protected website for
classroom use.
Short-Run Per-Unit Costs of Production
Short-run average variable costs, SAVC
Short-run total variable costs, STVC, divided by the quantity of
medical output
(c) 2012 Cengage Learning. All Rights Reserved. May not be
copied, scanned, or duplicated, in whole or in part, except for
use as permitted in a license distributed with a certain product
or service or otherwise on a password-protected website for
classroom use.
Short-Run Per-Unit Costs of Production
Short-run marginal variable costs
Inversely related to marginal product of labor
Short-run average variable costs
Inversely related to average product of labor
Maximum points on marginal product curve
Minimum point on marginal variable cost curves
(c) 2012 Cengage Learning. All Rights Reserved. May not be
17. copied, scanned, or duplicated, in whole or in part, except for
use as permitted in a license distributed with a certain product
or service or otherwise on a password-protected website for
classroom use.
Short-Run Per-Unit Costs of Production
Maximum points on average product curve
Minimum point on average variable cost curves
(c) 2012 Cengage Learning. All Rights Reserved. May not be
copied, scanned, or duplicated, in whole or in part, except for
use as permitted in a license distributed with a certain product
or service or otherwise on a password-protected website for
classroom use.
Figure 7.6 - Relation between the Per-Unit Product and Cost
Curves
Nurse-hours (n)
Marginal
and average
products of
nurse-hours
0
n1
MPn
n3
APn
Quantity of medical services (q)
Cost of medical
services
0
18. SMC
SAVC
q1
q3
Short-run marginal cost, SMC, equals the change in total costs
brought on by a one-unit change in output. Short-run average
variable cost, SAVC, equals short-run total variable cost
divided by total output. SMC and SAVC are inversely related to
marginal and average productivity. For example, marginal costs
decline as marginal productivity increases.
(c) 2012 Cengage Learning. All Rights Reserved. May not be
copied, scanned, or duplicated, in whole or in part, except for
use as permitted in a license distributed with a certain product
or service or otherwise on a password-protected website for
classroom use.
Short-Run Per-Unit Costs of Production
Short-run average fixed cost, SAFC
Total fixed costs, STFC divided by the level of output, q
SAFC = STFC/q
As medical services, q, increases
SAFC declines
(c) 2012 Cengage Learning. All Rights Reserved. May not be
copied, scanned, or duplicated, in whole or in part, except for
use as permitted in a license distributed with a certain product
or service or otherwise on a password-protected website for
classroom use.
Figure 7.7 - Relation among Short-Run Marginal, Average
19. Variable, and Average Total Costs
Quantity of medical services (q)
Cost of medical
services
0
SMC
SAVC
SATC
q0
a
b
SMC0
SATC0
SAVC0
SAFC0
Short-run average total cost, SATC, equals the sum of short-run
average variable cost, SAVC, and short-run average fixed cost,
SAFC. Hence, SAFC is reflected in the vertical distance
between the SATC and SAVC curves at each level of output.
SMC cuts both of the average cost curves at their minimum
points. SMC lies above the SAVC and SATC curves when they
are rising and below them when they are falling.
(c) 2012 Cengage Learning. All Rights Reserved. May not be
copied, scanned, or duplicated, in whole or in part, except for
use as permitted in a license distributed with a certain product
or service or otherwise on a password-protected website for
classroom use.
20. Factors Affecting the Position of the Short-Run Cost Curves
Prices of the variable inputs increase
Cost curves shift upward
Prices of the variable inputs decrease
Cost curves shift downward
Better quality of care
Cost curves shift upward
More severe patient case-mix
Cost curves shift upward
Excessive amounts of the fixed inputs
Cost curves shift upward
(c) 2012 Cengage Learning. All Rights Reserved. May not be
copied, scanned, or duplicated, in whole or in part, except for
use as permitted in a license distributed with a certain product
or service or otherwise on a password-protected website for
classroom use.
Factors Affecting the Position of the Short-Run Cost Curves
STVC = f(output level, input prices, quality of care, patient
case-mix, quantity of the fixed inputs)
These factors can explain cost differentials among medical
firms in the same industry
Output - where the medical firm operates along the cost curve
The other factors affect the location of the curve
(c) 2012 Cengage Learning. All Rights Reserved. May not be
copied, scanned, or duplicated, in whole or in part, except for
use as permitted in a license distributed with a certain product
or service or otherwise on a password-protected website for
classroom use.
21. Estimating a Short-Run Cost Function for Hospital Services
Studies by Cowing and Holtmann (1983) revealed:
STVC = f(q1,q2,q3,q4,q5,w1,w2,w3,w4,w5,w6,K,A)
qi(i=1,5) - quantity of one of five different patient services
Emergency room care, medical-surgical care, pediatric care,
maternity care, and other inpatient care - measured in total
patient days
wj(j=1,6) - one of six different variable input prices
Nursing labor, auxiliary labor, professional labor,
administrative labor, general labor, and material and supplies
(c) 2012 Cengage Learning. All Rights Reserved. May not be
copied, scanned, or duplicated, in whole or in part, except for
use as permitted in a license distributed with a certain product
or service or otherwise on a password-protected website for
classroom use.
Estimating a Short-Run Cost Function for Hospital Services
STVC = f(q1,q2,q3,q4,q5,w1,w2,w3,w4,w5,w6,K,A)
K - single measure of the capital stock (measured by the market
value of a hospital)
A - fixed number of admitting physicians in the hospital
(c) 2012 Cengage Learning. All Rights Reserved. May not be
copied, scanned, or duplicated, in whole or in part, except for
use as permitted in a license distributed with a certain product
or service or otherwise on a password-protected website for
classroom use.
Estimating a Short-Run Cost Function for Hospital Services
Economies of scope
22. Result from the joint sharing among related outputs of resources
Exist if the joint cost of producing two outputs is less than the
sum of the costs of producing the two outputs separately
(c) 2012 Cengage Learning. All Rights Reserved. May not be
copied, scanned, or duplicated, in whole or in part, except for
use as permitted in a license distributed with a certain product
or service or otherwise on a password-protected website for
classroom use.
Estimating a Short-Run Cost Function for Hospital Services
Cowing and Holtmann (1983) results:
Short-run economies of scale
Limited evidence for economies of scope with respect to
pediatric care and other services
Support for diseconomies of scope with respect to emergency
services and other services
(c) 2012 Cengage Learning. All Rights Reserved. May not be
copied, scanned, or duplicated, in whole or in part, except for
use as permitted in a license distributed with a certain product
or service or otherwise on a password-protected website for
classroom use.
Estimating a Short-Run Cost Function for Hospital Services
Cowing and Holtmann (1983) results:
Short-run marginal cost of each output
Declined and then became constant over the levels of output
observed in their study
Estimate short-run elasticities of input substitution between all
pairs of variable inputs
23. (c) 2012 Cengage Learning. All Rights Reserved. May not be
copied, scanned, or duplicated, in whole or in part, except for
use as permitted in a license distributed with a certain product
or service or otherwise on a password-protected website for
classroom use.
Estimating a Short-Run Cost Function for Hospital Services
Substantial degree of substitutability between
Nursing and professional workers
Nursing and general workers
Nursing and administrative workers
Professional and administrative labor
(c) 2012 Cengage Learning. All Rights Reserved. May not be
copied, scanned, or duplicated, in whole or in part, except for
use as permitted in a license distributed with a certain product
or service or otherwise on a password-protected website for
classroom use.
The Cost-Minimizing Input Choice
Minimize TC(q0)=wR × RN + wL × LPN
subject to
q0=f(RN, LPN)
q0 – amount of medical services
TC – total cost
Variable inputs
RN – registered nurses
LPN- licensed practical nurses
Input prices
wR – hourly wage for RNs
wL – hourly wage for LPNs
24. (c) 2012 Cengage Learning. All Rights Reserved. May not be
copied, scanned, or duplicated, in whole or in part, except for
use as permitted in a license distributed with a certain product
or service or otherwise on a password-protected website for
classroom use.
The Cost-Minimizing Input Choice
Efficient mix of RNs and LPNs:
MPRN/wR=MPLPN/wL
Marginal product to price ratio is equal for both RNs and LPNs
The last dollar spent on RNs generates the same increment to
output as the last dollar spent on LPNs
No other combination of RNs and LPNs is better
(c) 2012 Cengage Learning. All Rights Reserved. May not be
copied, scanned, or duplicated, in whole or in part, except for
use as permitted in a license distributed with a certain product
or service or otherwise on a password-protected website for
classroom use.
The Cost-Minimizing Input Choice
Optimal combination of doctors, doc and nurses, n:
MPdoc/wdoc=MPn/wn
Studies by Jensen and Morrisey (1986) revealed:
Estimated shadow price of a doctor
Implicit costs of approximately $7,012 per year from granting
admitting privileges to the marginal physician
(c) 2012 Cengage Learning. All Rights Reserved. May not be
25. copied, scanned, or duplicated, in whole or in part, except for
use as permitted in a license distributed with a certain product
or service or otherwise on a password-protected website for
classroom use.
Long-Run Costs of Production
In the long-run
All inputs, including capital, can be changed
Long-run average total cost curve, LATC
Derived from a series of short-run cost curves
Different sizes
Choose the SATC or size that minimizes the average cost
Envelope curve
(c) 2012 Cengage Learning. All Rights Reserved. May not be
copied, scanned, or duplicated, in whole or in part, except for
use as permitted in a license distributed with a certain product
or service or otherwise on a password-protected website for
classroom use.
Figure 7.8 - Short-Run Average Cost Curves & Long-Run
Planning Curve
Quantity of medical services (q)
Cost of medical
services
0
SATC1(k1)
SATC2(k2)
SATC3(k3)
LATC
26. qa
qb
a
b
q1
q2
All inputs are variable in the long run. SATC1, SATC2, and
SATC3 represent the cost curves for small, medium, and large
facilities, respectively. If decision makers choose the efficiently
sized firm for producing output in the long run, a long-run
average total cost, LATC, can be derived from a series of short-
run average total cost curves brought on by an increase in the
stock of capital. The U shape of the LATC reflects economies
and diseconomies of scale.
(c) 2012 Cengage Learning. All Rights Reserved. May not be
copied, scanned, or duplicated, in whole or in part, except for
use as permitted in a license distributed with a certain product
or service or otherwise on a password-protected website for
classroom use.
Long-Run Cost Curves
Long-run average total cost curve, LATC
U-shaped
Initially declines, reaches a minimum, and eventually increases
Long-run economies and diseconomies of scale
(c) 2012 Cengage Learning. All Rights Reserved. May not be
copied, scanned, or duplicated, in whole or in part, except for
use as permitted in a license distributed with a certain product
27. or service or otherwise on a password-protected website for
classroom use.
Long-Run Cost Curves
Long-run economies of scale
Average costs fall as a medical firm gets physically larger due
to specialization of labor and capital
Increasing returns to scale
An increase in all inputs results in a more than proportionate
increase in output
Constant returns to scale
Horizontal LATC curve
(c) 2012 Cengage Learning. All Rights Reserved. May not be
copied, scanned, or duplicated, in whole or in part, except for
use as permitted in a license distributed with a certain product
or service or otherwise on a password-protected website for
classroom use.
Long-Run Cost Curves
Diseconomies of scale
Result when the medical firm becomes too large
Average costs increase as a medical firm gets physically larger
Decreasing returns to scale
An increase in all inputs results in a less than proportionate
increase in output
(c) 2012 Cengage Learning. All Rights Reserved. May not be
copied, scanned, or duplicated, in whole or in part, except for
use as permitted in a license distributed with a certain product
or service or otherwise on a password-protected website for
classroom use.
28. Shifts in Long-Run Average Cost Curve
Increase in prices of medical inputs
LATC shifts upward
Quality
Cost-saving technology – LATC shifts downward
Higher quality of care – LATC shifts upward
Patient case-mix
More severe patient case-mix – LATC shifts upward
(c) 2012 Cengage Learning. All Rights Reserved. May not be
copied, scanned, or duplicated, in whole or in part, except for
use as permitted in a license distributed with a certain product
or service or otherwise on a password-protected website for
classroom use.
Long-Run Cost Minimization and the Indivisibility of Fixed
Inputs
Assumption
All inputs can be costlessly adjusted upward or downward
Capital inputs
Not easily changed
Medical firms may adjust slowly
Not produce in long-run equilibrium
Operate with excess capital relative to a long-run equilibrium
point
(c) 2012 Cengage Learning. All Rights Reserved. May not be
copied, scanned, or duplicated, in whole or in part, except for
use as permitted in a license distributed with a certain product
or service or otherwise on a password-protected website for
classroom use.
29. Figure 7.9 - Long-Run Disequilibrium of the Medical Firm
Dental output (q)
Cost of production
0
SATC1
SATC2
LATC
a
b
q1
q0
A firm may not operate in long-run equilibrium because of the
sizeable costs of adjusting to a sharp change in demand. For
example, assuming that the dental clinic is initially producing in
long-run equilibrium at q0 and output sharply falls to q1, it may
take time for the dental clinic to downsize its capital facility.
As a result, the dental clinic may operate with costs, point b,
that are higher than that predicted by long-run equilibrium,
point a.
(c) 2012 Cengage Learning. All Rights Reserved. May not be
copied, scanned, or duplicated, in whole or in part, except for
use as permitted in a license distributed with a certain product
or service or otherwise on a password-protected website for
classroom use.
Long-Run Cost Minimization and the Indivisibility of Fixed
30. Inputs
Cowing and Holtmann (1983) derived:
Long-run total cost, LTC
LTC = STVC(q, w ,k)+ r × k
LTC = sum of (minimum) short-run total variable costs, STVC
and capital costs
STVC - depends on: quantity of output, q, the wage rate, w, and
the quantity of capital, k
(c) 2012 Cengage Learning. All Rights Reserved. May not be
copied, scanned, or duplicated, in whole or in part, except for
use as permitted in a license distributed with a certain product
or service or otherwise on a password-protected website for
classroom use.
Long-Run Cost Minimization and the Indivisibility of Fixed
Inputs
Necessary condition for long-run cost minimization
ΔSTVC/Δk = -r
Variable cost savings realized from substituting one more unit
of capital
Must equal the rental price of capital in long-run equilibrium
Marginal benefits and costs of capital substitution should be
equal
(c) 2012 Cengage Learning. All Rights Reserved. May not be
copied, scanned, or duplicated, in whole or in part, except for
use as permitted in a license distributed with a certain product
or service or otherwise on a password-protected website for
classroom use.
Long-Run Cost Minimization and the Indivisibility of Fixed
31. Inputs
If estimated ΔSTVC/Δk is nonnegative
Medical firms are over-employing capital
Cost of capital substitution outweighs its benefit in terms of
short-run variable cost savings
(c) 2012 Cengage Learning. All Rights Reserved. May not be
copied, scanned, or duplicated, in whole or in part, except for
use as permitted in a license distributed with a certain product
or service or otherwise on a password-protected website for
classroom use.
Long-Run Cost Minimization and the Indivisibility of Fixed
Inputs
Cowing and Holtmann (1983), results
“Average” hospital in their New York sample
Too much capital and too many physicians
Hospitals could reduce their costs by limiting the amount of
capital and controlling the number of physicians.
(c) 2012 Cengage Learning. All Rights Reserved. May not be
copied, scanned, or duplicated, in whole or in part, except for
use as permitted in a license distributed with a certain product
or service or otherwise on a password-protected website for
classroom use.
Neoclassical Cost Theory and the Production of Medical
Services
Neoclassical cost theory
Assumptions
Perfect certainty
Firms produce as efficiently as possible
32. Perfect information
Short-run or long-run costs of producing a given level of output
can be determined by observing the relevant point on the
appropriate cost curve
(c) 2012 Cengage Learning. All Rights Reserved. May not be
copied, scanned, or duplicated, in whole or in part, except for
use as permitted in a license distributed with a certain product
or service or otherwise on a password-protected website for
classroom use.
Neoclassical Cost Theory and the Production of Medical
Services
Misleading when applied to medical firms because:
Some medical firms
Are not-for-profit entities or are reimbursed on a cost-plus basis
or both
No incentive to minimize costs
May operate above a given cost curve
Medical firms - uncertain demand for their services
May produce with some amount of reserve capacity just in case
an unexpected large increase in demand occurs
(c) 2012 Cengage Learning. All Rights Reserved. May not be
copied, scanned, or duplicated, in whole or in part, except for
use as permitted in a license distributed with a certain product
or service or otherwise on a password-protected website for
classroom use.
(,)
qfnk
=
1221
34. both in-text and with a reference list at the conclusion. If you
use an online source to support your answers, you must provide
a properly formatted link to the source. You should use APA
citation format and make sure your sources are credible. In most
cases, your responses should be no more than 400 words.
1. Suppose you are to specify a short-run production function
for dental services. What inputs might you include in the
production function? Which would be the variable inputs and
which the fixed inputs?
2. In your own words, explain the law of diminishing marginal
productivity. Be sure to mention the reason this law tends to
hold in the short run.
3. Explain the difference between technical efficiency and
economic efficiency.
4. Discuss the relation between the marginal and average
productivity curves and the marginal and average variable cost
curves.
5. What does the elasticity of substitution illustrate? How is it
expressed mathematically? What two factors affect its
magnitude?
6. Explain the difference between the explicit and implicit costs
of production. Cite an example of each.
7. What does economies of scope mean? Provide an example.
8. Explain the reasoning behind the U shape of the long-run
average total cost curve. Why might this cost curve shift
upward?
9. Describe the two limitations associated with the cost theory
provided in this chapter when it is applied to explain the
behavior of medical firms.
10. Suppose that you are interested in comparing the costs of
producing inpatient services at Saving Grace Hospital with
those at ACME Hospital. Further suppose that the two hospitals
annually admit about 24,000 and 32,000 patients, respectively,
at average short-run total costs per admission of roughly
$11,000 and $12,000.
A. Why may these average STC figures not represent the
35. economic cost of providing inpatient services at these two
hospitals? Explain fully.
B. Using cost theory as presented in the text, identify and fully
discuss four other factors that might explain why ACME
Hospital has higher average costs of production than Saving
Grace Hospital.