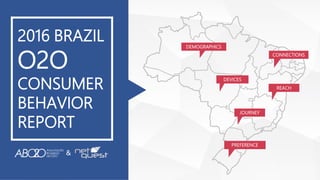
2. BACKGROUND
This is a brand new study that for the first time maps who are the O2O users
in Brazil, how often the O2O applications are being used and how the
Brazilian O2O users behave on smartphone.
The analysis addressed 2,500 mobile Internet users across the country , of
which 300 were being monitored in their digital habits for a period of 30 days.
And another 300 consumers were interviewed to find out which brands ,
applications and services are of their preference in each vertical or segment
of O2O.
The study was conducted in partnership with the ABO2O (Brazil Association of
O2O) and the market research specialist, NetQuest , over the months of
February and March 2016.
4. DEMOGRAPHICS
A
B1
B2
C1
C2
MIDDLE-CLASS DOMINANCE: 54%
SOURCE: NetQuest | Baidu Brasil | Associação Brasileira de O2O
61% 39%
GIRLS RULE
4%
27%
43%
18%
6%
2%
15-19 20-24 25-34 35-44 45-54 55-64
MILLENNIALS LEAD: 74%
PENETRATION @
INITIAL STAGE
O2O Users
27%
Non-O2O
Users
73%
Annual Income A: Above R$ 214K Middle Class B1 and B2: R$ 116 to R$ 214K ; C1: R$37K to 52K C2: R$13K to R$57K D: Until R$ 13K
Based on 677 monitored O2O users
5. DEVICES & CONNECTIONS
SOURCE: NetQuest | Baidu Brasil | Associação Brasileira de O2O
60%40%
758K
Seconds
1,321,341MM
Seconds861K
Seconds
CONNECTION
97%
3%
69K
Seconds
2,119,822MM
Seconds
62%
38%
844K
Seconds
1,346, 415MM
Seconds
DEVICE
DEVICE OS
O2O OCCURS MORE WITH EARLY ADOPTERS, LIKELY USING ON 3/4G
Usage measured on march 2016
86%
14%
IOS
Users
Android
Users
By time
By user
By time
By time
Based on 677 monitored O2O users
8. TICKETS
in %
PREFERENCES
20
15.5
2.7
1.2
Ingresso.com Ingresso
Rápido
Ticket 360 Ingresse.com
in %
in %
37.3
5.7 3.9
Ifood Pedidos Já Hello Food
FOOD
DELIVERY
54.1
40.8
5.1
De R$ 10 reais a R$
50 reais.
De R$ 51 reais a R$
100 reais
De R$ 101 reais
para mais.
45.5
57.6
41.7
6.8
Cost Eficiency User
Experience
Other
Reason
56.8
37.1
6.1
De R$ 10 reais a
R$ 50reais.
De R$ 51 reais a
R$ 100 reais
De R$ 101 reais
para mais
56
38 40
8
Cost Eficiency User
Experience
Other
Reason
OTA
18.8
8.4 8.4 8.4
2.4
0.6 0.6 0.3 0.3
Decolar Hotel Urbano Trivago Submarino
Viagens
Booking.com SkyScanner Kayak Hotels.com Expedia
66.5
50.9
31.7
4.3
Cost Eficiency User
Experience
Other
Reason
55.3
29.2
10.6
5
R$ 100 reais a
R$ 500 reais
R$ 501 reais a
R$ 1000 reais
R$ 1001 reais a
R$ 2000 reais
R$ 2001 reais
above
Player Preference Reason to Use Average Spending
Player Preference Reason to Use Average Spending
Player Preference Reason to Use Average Spending
SOURCE: NetQuest | Baidu Brasil | Associação Brasileira de O2O
LEADER
DEFINED
FIRST
CONCERN
All tickets players: Movie + Entertainment
All OTA players: Hotel, Flight & Meta Search
Based on 325 interviewed O2O users
9. TRANSPORT
in %
in %
in %
GROUP
BUYING
MOTO
DELIVERY
Player Preference Reason to Use Average Spending
Player Preference Reason to Use Average Spending
Player Preference Reason to Use Average Spending
20
15.8
8.7
1.8 0.6
99 Taxis Uber Easy Taxi Vá de Taxi Wappa
28.7
23.3
Peixe Urbano Groupon
3.9
3
2.4
2.1 2.1
Mobly Boy Easy Deliver Loggi Rapiddo 99 Motos
47.1
64.3
40.8
7
Cost Eficiency User
Experience
Other
Reason
37.8
62.2
35.6
8.9
Cost Eficiency User
Experience
Other
Reason
72
24.2
3.8
R$ 10 a R$ 50
reais.
R$ 51 a R$ 100
reais
R$ 101 reais
above
30.5
42.5
12.6 9.2
5.2
R$ 10 -50
reais.
R$ 51-100
reais
R$ 101 -200
reais
R$ 201-300
reais
R$ 301 reais
para mais
62.2
22.2
8.9 6.7
R$ 10 a R$ 50
reais.
R$ 51 a R$
100 reais
R$ 101 a R$
200 reais
R$ 201 a R$
300 reais
76.4
36.8 33.9
5.7
Cost Eficiency User
Experience
Other
Reason
SOURCE: NetQuest | Baidu Brasil | Associação Brasileira de O2O
FIRST
CONCERN
FIRST
CONCERN
FIRST
CONCERN
PREFERENCES
Based on 325 interviewed O2O users
10. BEAUTY
in %
in %
in %
WEDDING
HOME
IMPROVEMENT
Player Preference Reason to Use Average Spending
Player Preference Reason to Use Average Spending
Player Preference Reason to Use Average Spending
9
4.5
2.1
Casamentos.com.br ICasei Emotion.me
7.2
5.4
2.1
Vaniday Trinks Singu
6.9
1.8
3.6
1.5
Get Ninjas Iguana Fix Parafuzo Blumpa
39.1 41.3
50
15.2
Cost Eficiency User
Experience
Other
Reason
40.8
46.9
53.1
10.2
Cost Eficiency User
Experience
Other
Reason
36.7 32.7
18.4
6.1 6.1
R$ 10-50
reais
R$ 51-100
reais
R$ 101- 200
reais
R$ 201 -300
reais
R$ 301 reais
above
23.9
41.3
21.7
10.9
2.2
R$ 10-50
reais
R$ 51-100
reais
R$ 101- 200
reais
R$ 201 -300
reais
R$ 301 reais
above
44.2
48.1
44.2
23.1
Cost Eficiency User
Experience
Other
Reason
SOURCE: NetQuest | Baidu Brasil | Associação Brasileira de O2O
LEADER
BEING
DEFINED
ALL FACTORS
ALL FACTORS
ALL FACTORS
PREFERENCES
Based on 325 interviewed O2O users
11. FOOD
DISCOUNT
in %
in %
in %
TRUCK
LOGISTIC
HEALTH
Player Preference Reason to Use Average Spending
Player Preference Reason to Use Average Spending
Player Preference Reason to Use Average Spending
4.5
3
1.8
1.5
0.6
TruckPad Zumm FreteBras Quero Frente Sontra
5.7 5.4
3.9
Restorando Grubster ChefsClub
6.9
6.3
1.8
1.2
Help Saúde Easy Doctor Boa Consulta Medicinia
56
38 40
8
Cost Eficiency User
Experience
Other
Reason
37
57.4 57.4
9.3
Cost Eficiency User
Experience
Other
Reason
46
30
16
6
2
R$ 10-50
reais
R$ 51 -100
reais
R$ 101-200
reais
R$ 201- 300
reais
R$ 301 reais
aboce
N/A
31.6
39.5 39.5
23.7
Cost Eficiency User
Experience
Other
Reason
SOURCE: NetQuest | Baidu Brasil | Associação Brasileira de O2O
N/A
FIRST
CONCERN
FIRST
CONCERN
PREFERENCES
Based on 325 interviewed O2O users
ALL FACTORS
12. SOURCE: NetQuest | Baidu Brasil | Associação Brasileira de O2O
31
19.7
42.7
47.2
40.9
4.7
17.5
7.2
10.7 10.6
20.6 18.9 19.9
OTA TAXI FOOD GROUP BUYING TICKETS TRUCK TABLE
RESERVATION
MOTO HOME
IMPROVEMENT
WEDDING BEUATY MARKET HEALTH
in %
INTERESTED
IN
O2O APP
NOT YET
INSTALLED
SOLID INTEREST
PREFERENCES
Based on 325 interviewed O2O users
14. 12 AM 1 AM 2 AM 3 AM 4 AM 5 AM 6 AM 7 AM 8 AM 9 AM 10 AM 11 AM 12 PM 1 PM 2 PM 3 PM 4 PM 5 PM 6 PM 7 PM 8 PM 9 PM 10 PM 11 PM
TRANSPORT
FOOD
DELIVERY
TICKETS
SOURCE: NetQuest | Baidu Brasil | Associação Brasileira de O2O
USER JOURNEY BY TIME
WHEN FREE TIME AVAILABLE
DINNER–DRIVEN, NO SOLID HABIT YET DURING LUNCH TIME
PRETTY BALANCED AFTER 7AM
Based on 300 monitored O2O users for 30 days
15. 12 AM 1 AM 2 AM 3 AM 4 AM 5 AM 6 AM 7 AM 8 AM 9 AM 10 AM 11 AM 12 PM 1 PM 2 PM 3 PM 4 PM 5 PM 6 PM 7 PM 8 PM 9 PM 10 PM 11 PM
OTA
GROUP
BUYING
PLANS BEFORE BIZ HOURS, LUNCH TIME & BED TIME
BUYS DURING LUNCH TIME & AFTER DINNER
SOURCE: NetQuest | Baidu Brasil | Associação Brasileira de O2O
USER JOURNEY BY TIMEBased on 300 monitored O2O users for 30 days
16. USER JOURNEY BY SEQUENCE
BEFORE AFTEROTA
Most apps accessed descending order Most apps accessed descending order
LOOKS FOR SOLUTION ON THE WEB LOOKING FOR OTHER ALTERNATIVES OR
ONLINE CHECK-IN
LOOKS FOR DESTINATION/HOTEL INFOOPINION ALIGNMENT
PARTNERSHIPBRANDINGSEO
PARTNERSHIP INFO INTEGRATION
REASON
OPPORTUNITY
REASON
OPPORTUNITY
OPINION ALIGNMENT
Based on 300 monitored O2O users for 30 days
17. BEFORE AFTERTRANSPORT
Most apps accessed descending order Most apps accessed descending order
SERVICE COMPARISON TASKS @ DESTINATION
TASKS @ DESTINATION
PURPOSE
AGENDA INTEGRATIONBRANDINGPARTNERSHIP
BRANDING AGENDA INTEGRATION
SERVICE COMPARISON
REASON
OPPORTUNITY
REASON
OPPORTUNITY
USER JOURNEY BY SEQUENCE
Based on 300 monitored O2O users for 30 days
18. DRIVING
DIRECTIONS
SERVICE
COMPARISON
USER JOURNEY BY SEQUENCE
BEFORE AFTER
GROUP
BUYING
Most apps accessed descending order Most apps accessed descending order
MUSIC LOVER?
INTEGRATIONPARTNERSHIP
BRANDING
REASON
OPPORTUNITY
REASON
OPPORTUNITY
Based on 300 monitored O2O users for 30 days
SHOWOFF
PARTNERSHIP
19. USER JOURNEY BY SEQUENCE
TICKETS
Most apps accessed descending order
BEFORE
AFTER
Most apps accessed descending order
EN ROUTE TO
SEE A MOVIE TRAILER WATCHING?
TRAILER
WATCHING?
TRAILER
WATCHING?
PARTNERSHIP PARTNERSHIP
PARTNERSHIP PARTNERSHIP
REASON
OPPORTUNITY
REASON
OPPORTUNITY
Based on 300 monitored O2O users for 30 days
20. BEFORE AFTER
Most apps accessed descending order Most apps accessed descending order
FOOD
DELIVERY
SERVICE
COMPARISON
LOOKS FOR SOLUTION ON THE WEB & APP STORE
YOUNG & SHOWOFF
PARTNERSHIPBRANDING
BRANDING
SHOWOFF
USER JOURNEY BY SEQUENCE
REASON
OPPORTUNITY
REASON
OPPORTUNITY
Based on 300 monitored O2O users for 30 days
SHARING
21. BEFORE AFTERHOME IMPROVEMENT
Most apps accessed descending orderMost apps accessed descending order
USER JOURNEY BY SEQUENCE
SERVICE
COMPARISON
COMMUNICATION
INTEGRATIONBRANDING
REASON
OPPORTUNITY
Based on 300 monitored O2O users for 30 days
23. O2O PERSONA
NOME Alice
AGE 25, single
PROFESSION Office clerk, 3 years so far
DIGITAL LIFE Using Samsung J5, on a pre-paid 2GB data plan
PERSONALITY Music lover, active in social & dreaming of
having her own business one day
O2O HABIT
• She checks at her leisure time to see interesting promotions @ Group Buying
players
• Whenever visiting client outside, she always uses app of Transport., of which she
knows clearly the options.
• She buys movie ticket on the cell phone inside of Taxi on her way to the cinema.
• Friday evening, she intends to cut some slack and order a pizza via iFood, later
post a photo to amuse her friends
• She is curious and would like to test other services by app, if available.
24. INSIGHTSFinal considerations about key study
O2O service penetration is still pretty low and at its initial stage. But interest is concrete.
Middle-class, young, female, mid-end smartphone users are O2O early adopters.
Group-Buying, Movie Ticket, Taxi, Food Delivery & OTA are the most popular categories.
In Food Delivery we have dominant leader, other categories still fragmented.
In Group-Buying & Food, price is the key factor. In other categories challenges are various.
Most O2O service have unique peak consumption hours, use it wisely to drive purchase decision.
Cross-selling is the future, build up more partnership to sell more or deliver better experiences
Attached 3 spreadsheet:s for deep analysis: 1. User Journey 2. General Panel 3. Users Preference Survey