SlideShare una empresa de Scribd logo
1 de 15
Descargar para leer sin conexión
0 0 M o n t h 2 0 1 8 | V O L 0 0 0 | N A T U R E | 1
Letter doi:10.1038/nature25756
A single population of red globular clusters around
the massive compact galaxy NGC 1277
Michael A. Beasley1,2
, Ignacio Trujillo1,2
, Ryan Leaman3
& Mireia Montes4
Massive galaxies are thought to form in two phases: an initial
collapse of gas and giant burst of central star formation, followed
by the later accretion of material that builds up their stellar and
dark-matter haloes1–4
. The systems of globular clusters within such
galaxies are believed to form in a similar manner. The initial central
burst forms metal-rich (spectrally red) clusters, whereas more metal-
poor (spectrally blue) clusters are brought in by the later accretion
of less-massive satellites5–10
. This formation process is thought to
result in the multimodal optical colour distributions that are seen
in the globular cluster systems of massive galaxies8,11,12
. Here we
report optical observations of the massive relic-galaxy candidate
NGC 1277—a nearby, un-evolved example of a high-redshift ‘red
nugget’ galaxy13–17
. We find that the optical colour distribution of
the cluster system of NGC 1277 is unimodal and entirely red. This
finding is in strong contrast to other galaxies of similar and larger
stellar mass, the cluster systems of which always exhibit (and are
generally dominated by) blue clusters11
. We argue that the colour
distribution of the cluster system of NGC 1277 indicates that the
galaxy has undergone little (if any) mass accretion after its initial
collapse, and use simulations of possible merger histories to show
that the stellar mass due to accretion is probably at most ten per
cent of the total stellar mass of the galaxy. These results confirm
that NGC 1277 is a genuine relic galaxy and demonstrate that blue
clusters constitute an accreted population in present-day massive
galaxies.
We obtained imaging of NGC 1277 from the Advanced Camera
for Surveys (in the g475W and z850LP filters) onboard the Hubble Space
Telescope (HST/ACS) to characterize the globular cluster system of
this galaxy (Extended Data Fig. 1). NGC 1277 has been identified as
a massive (about 1.2 ×​ 1011
M, where M is the mass of the Sun)15
relic galaxy on the basis of its high stellar-mass density, compactness,
­kinematics and old and metal-rich stellar populations14–17
. We pos-
tulate that if NGC 1277 is a true relic—that is, a nearby, un-evolved
example of the ‘red nuggets’ seen at high redshift—then it should
have accreted little or no stellar halo and should have few or no blue
clusters.
The spatial distributions of cluster candidates from the HST/ACS
imaging (Fig. 1) indicate that NGC 1277 and its companion galaxy
in projection, NGC 1278, both have relatively rich cluster systems.
Separating the clusters in the ACS field by their de-reddened colours by
cutting at (g475W −​ z850LP)0 =​ 1.15 (the approximate separation between
the red and blue peaks for a galaxy of this mass in the ACS Virgo Cluster
Survey (VCS)11
), we find that NGC 1277 has a rich red cluster popula-
tion but few blue clusters. This is in strong contrast to NGC 1278, which
has a similar stellar mass to NGC 1277 (about 2.4 ×​ 1011
M) but both
red and blue clusters.
This visual impression is supported by looking at the colour distri-
bution of the globular clusters in NGC 1277 compared with those in
galaxies of similar stellar mass from the survey (Fig. 2). No obvious blue
peak is seen in the colour distribution of clusters in NGC 1277, which
appears red with a tail to bluer colours. By contrast, the composite
colour distribution of the similar-stellar-mass galaxies in the survey has
both blue and red peaks. We ran Gaussian mixture modelling (GMM)
tests (Methods) on these colour distributions, with a null hypothesis
that the input colour distributions are unimodal. For NGC 1277, GMM
cannot reject the null hypothesis for the globular clusters (P =​ 0.371,
χ2
test). However, under the assumption that two populations of clus-
ters are present, GMM associates 99 clusters with a red population
with a mean colour of (g475W −​ z850LP)0 =​ 1.31 ±​ 0.10 (errors are 1σ
unless otherwise stated) and 21 clusters with a metal-poor population
with a mean colour of (g475W −​ z850LP)0 =​ 0.86 ±​ 0.24. For the survey
colour distribution, GMM rejects a unimodal distribution at high
confidence (P <​ 0.001, χ2
test), finding a roughly even split between
blue (101 clusters) and red (110 clusters) clusters with colour peaks at
(g475W −​ z850LP)0 =​ 0.97 ±​ 0.04 and 1.36 ±​ 0.04, respectively.
The results of the survey show that the cluster systems of present-day
massive galaxies can have diverse colour distributions, but always have
substantial numbers of blue clusters11
. For galaxies with stellar masses
comparable to that of NGC 1277, the typical fraction of blue globular
clusters is fblue =​ 0.50 ±​ 0.10 (ref. 11) or larger.
For NGC 1277, we find = . − .
+ .
− .
+ .
f 0 17 (systematic)blue 0 17
0 12
0 05
0 06
(random)
(16th–84th percentiles; Fig. 3, Methods). This is an upper limit because
the null hypothesis of unimodality is not rejected. NGC 1277 is clearly
an outlier in that it has a significantly lower blue fraction than the sur-
vey galaxies with similar stellar masses (Fig. 3).
For massive galaxies in the survey, the blue cluster fractions are
lower limits because the survey covered only the inner 1–2 effective
radii (Re) of these galaxies—a region where red clusters dominate over
blue clusters owing to the more concentrated spatial distributions of
the red clusters18
. In the case of NGC 1277, which is very compact
(Re =​ 1.2 kpc) and located in the more distant Perseus cluster, we have
probed the entire radial range (about 10Re) of the cluster system and
are not biased against detecting blue clusters. Therefore, NGC 1277
truly lacks blue clusters when compared with normal galaxies (Fig. 3).
We rule out the possibility that a colour–magnitude relation in the
blue globular clusters is driving the red-dominated peak of the clusters
in NGC 1277. This relation is not seen in our data (Methods, Extended
Data Fig. 6). In addition, our results are unaffected by possible non-
linear colour–metallicity relations for the clusters19–21
. About 70% of
the clusters in NGC 1277 have (g475W −​ z850LP)0 >​ 1.1, which is the
approximate colour at which the empirical (g475W −​ z850LP)0–­metallicity
relations for clusters in the Milky Way, M49 and M87 are linear11
.
NGC 1277 is roughly five times more compact than the majority of
galaxies of the same stellar mass at z =​ 0 (ref. 15). As we have shown,
NGC 1277 also lacks an obvious population of blue clusters, which are
generally associated with a halo population in galaxies. The lack of
a halo is consistent with the surface brightness profile of NGC 1277,
which declines sharply beyond about 10 kpc from the centre of the
­galaxy owing to the presence of fewer stars (by a factor of about five)
than in other galaxies of the same mass15
. Assuming that NGC 1277
1
Instituto de Astrofísica de Canarias, Calle Vía Láctea, La Laguna, Spain. 2
University of La Laguna, Avenida Astrofísico Francisco. Sánchez, La Laguna, Spain. 3
Max-Planck Institut für Astronomie,
Königstuhl 17, D-69117, Heidelberg, Germany. 4
Department of Astronomy, Yale University, 06511 New Haven, Connecticut, USA.
© 2018 Macmillan Publishers Limited, part of Springer Nature. All rights reserved.
2 | N A T U R E | V O L 0 0 0 | 0 0 m o n t h 2 0 1 8
LetterRESEARCH
obeys the same size–stellar-mass relation as that of quiescent galaxies
of the same stellar mass at z =​ 2, our findings suggest either that it has
been stripped of its outer envelope and clusters and reduced in size,
or that it failed to grow substantially in size and in the number of blue
clusters since z =​ 2. We have explored both scenarios and favour the
latter, that NGC 1277 is a genuine relic galaxy.
The tidal radius of NGC 1277—at which stars and clusters become
unbound from the galaxy—can be estimated analytically22
. In the
extreme case that NGC 1277 is currently at pericentre within the
Perseus cluster and that its clusters are on prograde orbits with respect
to its orbit within Perseus, we calculate a lower limit for the tidal radius
of 11 kpc. This lower limit corresponds to roughly 2Re–3Re in galaxies
with similar stellar masses to that of NGC 1277 and is a radius at
which at least 50% the clusters in the population should be blue11
. This
result suggests that stripping has not affected the physical size or the
­cluster system of NGC 1277. Furthermore, the central stellar density
of NGC 1277 is a factor of 2–3 higher than that of the inner 1 kpc of
galaxies of similar stellar mass15
. Tidal stripping alone cannot increase
the central stellar density22
, which implies that NGC 1277 was born
both dense and compact. This raises the question of why NGC 1277
should have suffered severe tidal stripping while larger galaxies of
­similar mass in the same environment—such as NGC 1278—have not.
Finally, there is no evidence for tidal tails or streams in the outer region
of NGC 127715
, or for stripping in the stellar orbits, rotation curve or
mass distribution of NGC 127717
.
By contrast, NGC 1277 strongly resembles the low-redshift equiva-
lent of higher-redshift compact systems. It lies on the size–stellar-mass
relation of z =​ 2 galaxies15,17
and has a high central stellar density that
is consistent with massive galaxies at these redshifts23
. Schwarzschild
dynamical modelling24
shows that NGC 1277 is dominated by high-­
angular-momentum orbits, which implies that it formed in a largely
dissipative process. Previous results17,24
suggest that NGC 1277 is essen-
tially a massive disk with no classical, pressure-supported component.
49.94 49.96 49.98 50.00
Blue 10 kpc
49.94 49.96 49.98 50.00
Right ascension (º)
41.55
41.56
41.57
41.58
41.59
41.60
41.61
Declination(º)
Red
NGC 1278
NGC 1277
PGC 012430
2MASX J031952
PGC 012436
0
100
200
300
400
500
600
Numberofglobularclustersperarcmin2
Figure 1 | Spatial distribution of clusters in the HST/ACS field. North
is up, east is to the right. Individual clusters are shown as red points. The
locations of the named galaxies are indicated (grey dashes ellipsoids)
by isophotes corresponding to 23 mag arcsec−2
in g475W. NGC 1277
is left of centre in the plots, with the neighbouring galaxy NGC 1278
located around 50 arcsec (17 kpc) to the southeast in projection. The
red (left) and blue (right) clusters have been separated by taking a cut
at (g475W −​ z850LP)0 =​ 1.15, typical of the peak separation between the
red and blue clusters in galaxies of this stellar mass11
. The colour scale
shows Gaussian kernel density maps of the globular clusters, constructed
with a kernel with a width of 10 arcsec. Galaxies in the field can clearly
be identified by the relative prevalence of clusters. NGC 1278 has both
red and blue cluster populations, whereas NGC 1277 has a substantial
population only of red clusters.
0.0 0.5 1.0 1.5 2.0 2.5
(g475W − z850LP)0
0
10
20
30
Numberofglobularclusters
GMM
ACS VCS
NGC 1277
Figure 2 | The colour distribution of clusters in NGC 1277 compared
with that of the composite cluster system. The colour distribution for
NGC 1277 (orange histogram) is constructed over the full radial extent of
its cluster system (11 kpc) and has been corrected for the contamination
from NGC 1278 clusters; in projection, NGC 1278 is 17 kpc from
NGC 1277. The composite cluster system (ACS VCS; green histogram)
is constructed from four galaxies11
with stellar masses similar to that
of NGC 1277 (roughly 1.2 ×​ 1011
M). The dashed curves indicate the
Gaussian components of the cluster systems obtained from GMM28
; the
solid curves show the sum of these components. The composite cluster
system is clearly bimodal, whereas NGC 1277 lacks an obvious blue peak.
108 109 1010 1011 1012
Stellar mass (M )
0
0.2
0.4
0.6
0.8
1
Fractionofblueglobularclusters
ACS VCS
ACS VCS, binned
NGC 1277
Figure 3 | The fraction of blue clusters in galaxies of a given stellar
mass. Data for the survey galaxies (ACS VCS; open blue circles) come
from ref. 11. NGC 1277 (filled orange circle) has a very small fraction of
blue clusters when compared with other galaxies of similar stellar mass.
For the binned survey data (filled blue circles), the 16th–84th percentiles
of the distributions are shown as error bars; the blue fractions for the
brightest survey galaxies are lower limits (indicated by the arrowheads)
because only the central parts of the galaxy cluster systems were observed.
The systematic uncertainty on the blue fraction for NGC 1277 is shown
as the faint, dashed error bar (16th–84th percentiles); the random
uncertainties from Monte Carlo simulations are smaller and shown as the
solid error bar (16th–84th percentiles). The blue fraction for the clusters in
NGC 1277 is an upper limit (indicated by the arrowhead) because the null
hypothesis of unimodality cannot be rejected on the basis of observations.
© 2018 Macmillan Publishers Limited, part of Springer Nature. All rights reserved.
0 0 M o n t h 2 0 1 8 | V O L 0 0 0 | N A T U R E | 3
Letter RESEARCH
These kinematic properties are remarkably similar to those of the
lensed ‘dead disk’ at z ≈​ 2.1 (ref. 25), which has similar stellar mass to
NGC 1277 and is similarly compact ( = . − .
+ .
R 1 73 kpce 0 27
0 34
). In addition,
the old, metal-rich stellar population of NGC 1277 is similar to that of
other nearby relic-galaxy candidates17
, to that expected for passively
evolving z =​ 2 red nuggets and to that predicted for the redshift evolu-
tion of massive, compact systems in cosmological simulations26,27
.
Finally, the fact that NGC 1277 is in a massive galaxy cluster is not
unexpected, observationally or theoretically (Methods).
Our findings for the cluster system of NGC 1277 provide further
constraints on the evolutionary histories of relic galaxies. In accre-
tion models for the formation of the blue cluster population in mas-
sive galaxies, the location of the blue peak and the relative fraction of
blue clusters provides insight into the total mass and the properties of
accreted satellites of any given galaxy6,8,9
. We ran a series of analytic
merger models based on our observations (Fig. 4, Methods, Extended
Data Figs 7, 8) to constrain the accreted mass fraction of NGC 1277.
From this modelling we find that the observed blue cluster fraction of
NGC 1277 is characteristic of galaxies that have accreted about 10% or
less of their stellar mass, with the rest of the stars having formed in situ.
By contrast, mass-matched ACS VCS galaxies have accretion fractions
of 50%–90%. We therefore find that the blue fraction of globular clus-
ters approximately traces the total fraction of accreted mass in galaxies,
and that NGC 1277 has accreted very little mass (if any) over its lifetime
compared with other galaxies of similar stellar mass.
We conclude that NGC 1277 provides a benchmark for the detailed
study of the properties of massive galaxies that have not evolved
since z =​ 2. High-resolution imaging of the cluster systems of more
relic galaxies will enable the reconstruction of their mass-accretion
histories.
Online Content Methods, along with any additional Extended Data display items and
Source Data, are available in the online version of the paper; references unique to
these sections appear only in the online paper.
received 5 July 2017; accepted 3 January 2018.
Published online 12 March 2018.
1.	 Khochfar, S. & Silk, J. A simple model for the size evolution of elliptical galaxies.
Astrophys. J. 648, L21–L24 (2006).
2.	 Oser, L., Naab, T., Ostriker, J. P. & Johansson, P. H. The cosmological size and
velocity dispersion evolution of massive early-type galaxies. Astrophys. J. 744,
63 (2012).
3.	 Ceverino, D., Dekel, A., Tweed, D. & Primack, J. Early formation of massive,
compact, spheroidal galaxies with classical profiles by violent disc instability or
mergers. Mon. Not. R. Astron. Soc. 447, 3291–3310 (2015).
4.	 van Dokkum, P. G. et al. The growth of massive galaxies since z=​2. Astrophys. J.
709, 1018–1041 (2010).
5.	 Searle, L. & Zinn, R. Compositions of halo clusters and the formation of the
galactic halo. Astrophys. J. 225, 357–379 (1978).
6.	 Côté, P., Marzke, R. O. & West, M. J. The formation of giant elliptical galaxies
and their globular cluster systems. Astrophys. J. 501, 554–570 (1998).
7.	 Beasley, M. A., Baugh, C. M., Forbes, D. A., Sharples, R. M. & Frenk, C. S. On the
formation of globular cluster systems in a hierarchical Universe. Mon. Not. R.
Astron. Soc. 333, 383–399 (2002).
8.	 Tonini, C. The metallicity bimodality of globular cluster systems: a test of
galaxy assembly and of the evolution of the galaxy mass-metallicity relation.
Astrophys. J. 762, 39 (2013).
9.	 Leaman, R., VandenBerg, D. A. & Mendel, J. T. The bifurcated age–metallicity
relation of Milky Way globular clusters and its implications for the accretion
history of the galaxy. Mon. Not. R. Astron. Soc. 436, 122–135 (2013).
10.	 Kruijssen, J. M. D. Globular clusters as the relics of regular star formation in
normal high-redshift galaxies. Mon. Not. R. Astron. Soc. 454, 1658–1686
(2015).
11.	 Peng, E. W. et al. The ACS Virgo Cluster Survey. IX. The color distributions of
globular cluster systems in early-type galaxies. Astrophys. J. 639, 95–119
(2006).
12.	 Brodie, J. P. & Strader, J. Extragalactic globular clusters and galaxy formation.
Annu. Rev. Astron. Astrophys. 44, 193–267 (2006).
13.	 Damjanov, I. et al. Red nuggets at z=​1.5. Compact passive galaxies and the
formation of the Kormendy relation. Astrophys. J. 695, 101–115 (2009).
14.	 van den Bosch, R. C. E. et al. An over-massive black hole in the compact
lenticular galaxy NGC 1277. Nature 491, 729–731 (2012).
15.	 Trujillo, I., Ferré-Mateu, A., Balcells, M., Vazdekis, A. & Sánchez-Blázquez, P.
NGC 1277: a massive compact relic galaxy in the nearby Universe. Astrophys.
J. 780, L20 (2014).
16.	 Martín-Navarro, I. et al. The initial mass function of a massive relic galaxy.
Mon. Not. R. Astron. Soc. 451, 1081–1089 (2015).
17.	 Yıldırım, A. et al. The structural and dynamical properties of compact elliptical
galaxies. Mon. Not. R. Astron. Soc. 468, 4216–4245 (2017).
18.	 Hargis, J. R. & Rhode, K. L. Globular cluster systems and their host galaxies:
comparison of spatial distributions and colors. Astrophys. J. 796, 62 (2014).
19.	 Blakeslee, J. P. et al. Optical and infrared photometry of globular clusters in
NGC 1399: evidence for color–metallicity nonlinearity. Astrophys. J. 746, 88
(2012).
20.	 Yoon, S.-J. et al. Nonlinear color-metallicity relations of globular clusters. III. On
the discrepancy in metallicity between globular cluster systems and their
parent elliptical galaxies. Astrophys. J. 743, 150 (2011).
21.	 Chies-Santos, A. L. et al. An optical/NIR survey of globular clusters in early-type
galaxies. III. On the colour bimodality of globular cluster systems. Astron.
Astrophys. 539, A54 (2012).
22.	 Read, J. I., Wilkinson, M. I., Evans, N. W., Gilmore, G. & Kleyna, J. T. The tidal
stripping of satellites. Mon. Not. R. Astron. Soc. 366, 429–437 (2006).
23.	 Szomoru, D., Franx, M. & van Dokkum, P. G. Sizes and surface brightness
profiles of quiescent galaxies at z=​2. Astrophys. J. 749, 121 (2012).
24.	 Yıldırım, A. et al. MRK 1216 and NGC 1277 – an orbit-based dynamical
analysis of compact, high-velocity dispersion galaxies. Mon. Not. R. Astron. Soc.
452, 1792–1816 (2015).
25.	 Toft, S. et al. A massive, dead disk galaxy in the early Universe. Nature 546,
510–513 (2017).
26.	 Wellons, S. et al. The diverse evolutionary paths of simulated high-z massive,
compact galaxies to z=​0. Mon. Not. R. Astron. Soc. 456, 1030–1048 (2016).
27.	 Furlong, M. et al. Size evolution of normal and compact galaxies in the EAGLE
simulation. Mon. Not. R. Astron. Soc. 465, 722–738 (2017).
28.	 Muratov, A. L. & Gnedin, O. Y. Modeling the metallicity distribution of globular
clusters. Astrophys. J. 718, 1266–1288 (2010).
102
Specificfrequency
101
100
10–1
10–3 10–2 10–1 100
NGC 1277
AVS VCS analogues
Number ratio, Ninsitu/Nacc
101 102 103
1
0.8
0.6
Averageaccretionfraction
0.4
0.2
0
Figure 4 | Predictions from the simulated merger histories of
NGC 1277. The total specific frequency—the number of clusters per
unit galaxy luminosity—is shown against the number ratio of clusters
formed in situ (Ninsitu) and those accreted (Nacc) in the simulated merger
histories. The colours represent the average accretion fraction for each
merger history. The constraints for NGC 1277 (black circle, with error
bars indicating the 16th–84th percentiles, the arrow indicates that
our measurements are an upper limit for the accreted fraction) that
we determined from the observations are often satisfied in histories
with low accretion fractions (about 10%). Merger histories with higher
accretion fractions rarely lead to the colour ratio that we observed
without overproducing the total number of clusters. By contrast, similar-
mass galaxies in the ACS VCS (grey box) are well reproduced by merger
histories with accretion fractions of around 50%.
Acknowledgements We thank C. dalla Vecchia, J. Sanchez Almeida, C. Brook,
S. Wellons, M. Fouesneau, A. Vazdekis, B. Dullo, J. Read and G. van de Ven for
discussions, and J. Roman and A. Serrano Borlaf for assistance with image
alignment. M.A.B. and I.T. acknowledge support from grant AYA2016-77237-
C3-1-P from the Spanish Ministry of Economy and Competitiveness (MINECO).
R.L. acknowledges funding from a Natural Sciences and Engineering Research
Council of Canada PDF award. This research has made use of the NASA/
IPAC Extragalactic Database (NED), which is operated by the Jet Propulsion
Laboratory, California Institute of Technology, under contract with NASA, and
is based on observations made with the NASA/ESA Hubble Space Telescope,
© 2018 Macmillan Publishers Limited, part of Springer Nature. All rights reserved.
4 | N A T U R E | V O L 0 0 0 | 0 0 m o n t h 2 0 1 8
LetterRESEARCH
which is operated by the Association of Universities for Research in Astronomy
under NASA contract NAS 5-26555. These observations are associated with
programme GO-14215. Support for this work was provided by NASA through
grant HST-GO-4215 from the Space Telescope Science Institute, operated
by AURA under NASA contract NAS 5-26555 This research has made use of
NASA’s Astrophysics Data System and extensive use of Python and Scipy.
Author Contributions M.A.B. led the data processing and analysis, contributed
to the interpretation and HST proposal preparation and produced Figs 1–3 and
Extended Data Figs 2–6. I.T. contributed to the analysis and the interpretation,
produced Extended Data Fig. 1 and lead the HST proposal preparation.
R.L. generated and analysed the analytic merger models, produced Fig. 4 and
Extended Data Figs 7, 8, and contributed to the analysis, interpretation and
HST proposal preparation. M.M. contributed to the analysis, interpretation and
HST proposal preparation. All authors contributed to the overall design of this
project.
Author Information Reprints and permissions information is available at
www.nature.com/reprints. The authors declare no competing financial
interests. Readers are welcome to comment on the online version of the paper.
Publisher’s note: Springer Nature remains neutral with regard to jurisdictional
claims in published maps and institutional affiliations. Correspondence and
requests for materials should be addressed to M.A.B. (beasley@iac.es).
Reviewer Information Nature thanks R. Abraham, K. Glazebrook and L. Spitler
for their contribution to the peer review of this work.
© 2018 Macmillan Publishers Limited, part of Springer Nature. All rights reserved.
Letter RESEARCH
Methods
HST/ACS photometry. We obtained HST/ACS imaging of NGC 1277 in F475W
(g475W) and F850LP (z850LP) (two orbits; GO programme ID, 14215; Extended
Data Fig. 1). The total exposure time was 2,280 s (F475W) and 2,432 s (F850LP).
We adopt a standard cosmological model with H0 =​ 70 km s−1
 Mpc−1
, Ωm =​ 0.3
and ΩΛ =​ 0.7. The redshift assumed here for NGC 1277, z =​ 0.0169, corre-
sponds to a galaxy distance of 73.3 Mpc ((m −​ M)0 =​ 34.33) and a spatial scale
of 344 pc arcsec−1
.
The HST data were pipeline-reduced, including correction for charge-transfer
efficiency. We calculated zero-points for the AB magnitude system using the file
header information. Aperture and point spread function (PSF) photometry was
performed on the ACS imaging using Source Extractor29
with the add-on PSFEx30
.
Our photometry was corrected for foreground extinction using line-of-sight red-
dening estimates31
. Source Extractor was run in dual-image mode using un-sharp
masks as detection images with photometry performed on the original images.
We selected matched sources in the g475W and z850LP filters. Aperture magnitudes
were measured using a range of aperture radii from 3 to 50 pixels. We applied aper-
ture corrections to the three-pixel aperture magnitudes by correcting to ten-pixel
(0.5 arcsec) apertures based on bright, isolated stars, and then correcting to infinity
using the corrections tabulated in ref. 32. For artificial point-source tests, we used
PSFEx to construct PSFs based on bright, isolated stars across the ACS field.
Completeness tests. Completeness tests were performed by injecting ­artificial
point sources into the images (using the PSFEx PSFs) and ­determining
the recovery fraction as a function of magnitude with Source Extractor. In
regions approximately 20 arcsec from bright galaxies, we are 100% complete
to g475W =​ 27.3 mag and z850LP =​ 26.7 mag, with typical colour uncertainties of
δ(g475W −​ z850LP)0 =​ 0.08 mag. We take this as a conservative photometric ­limiting
magnitude. However, the completeness varies as a function of position and there-
fore we also calculated photometric completeness by repeating our tests as a func-
tion of position and magnitude across the field. In the very central regions (less
than 1.5 arcsec; 0.5 kpc) of NGC 1277 and the neighbouring NGC 1278, we recover
few clusters owing to the high surface brightness of the galaxies. Photometric errors
were characterized by measuring the difference between the input and output
magnitudes of 50,000 artificial point sources placed randomly across the images.
To separate point sources (globular cluster candidates) from extended sources,
we obtained the Source Extractor output flux_radius as a function of magni-
tude for our artificial point sources. All real sources identified within the region
defined by the artificial sources were regarded as cluster candidates. In total, to
g475W =​ 27.3 mag, we detect 2,286 objects in the magnitude range consistent with
being clusters. Colour–magnitude diagrams for all of the cluster candidates, and
for cluster candidates around NGC 1278, NGC 1277 and an example background
field are shown in Extended Data Fig. 2.
Characterizing the colour distributions of the cluster systems. The spatial
density distribution of candidate clusters (Fig. 1) was constructed directly from
the photometry, after masking a small region (radius of 3 arcsec) centred on
an uncatalogued dwarf located about 16 arcsec to the west of NGC 1277 (right
ascension, 03 h 19 min 50.1 s; declination, +​41° 34′​ 22.10″​). A kernel-density-­
estimate map was constructed using the Python SciPy routine gaussian_kde with
the Gaussian kernel determined using ‘Scott’s rule’33
. As expected, the globular
clusters aggregate around known galaxies (Fig. 1). However, taking a colour cut
at (g475W −​ z850LP)0 =​ 1.15—the approximate separation between the red and blue
peaks for a galaxy the mass of NGC 1277 in ref. 11—NGC 1277 seems to ‘drop
out’ of the blue-cluster-density map. This is in contrast with NGC 1278, which has
both red and blue clusters.
To create the colour distribution of NGC 1277 (Fig. 2), we had to take into
account interloping clusters from the neighbouring NGC 1278 and contributions
from intracluster clusters. We constructed a ‘master background’ by selecting five
regions located at a distance from NGC 1278 equal to the separation between
NGC 1277 and NGC 1278, and sufficiently distant from NGC 1277 so as to not
overlap with its cluster system (which has an extent of about 11 kpc; Extended
Data Fig. 3). The colour distribution of NGC 1277 clusters was built by selecting
all ­cluster candidates within 11 kpc (about 10Re) and subtracting the master back-
ground normalized to the area covered by the cluster system of NGC 1277. This
process also removes intracluster clusters from the cluster system of NGC 1277. The
colour distribution of this master background is shown in Extended Data Fig. 4.
The composite cluster system in Fig. 2 was constructed by selecting galaxies from
ref. 11 that bracket the stellar mass of NGC 1277, giving a mean stellar mass of
about 1.1 ×​ 1011
M with a dispersion of 0.4 ×​ 1011
M. To compare with NGC 1277,
we took a magnitude cut in the survey data at g475W =​ 23.98 ((m −​ M)0 =​ 31.01),
which corresponds to our photometric depth.
To explore the subpopulations in the colour distributions, we ran a GMM
code28
on the binned colour distributions. For the visibly bimodal colour
­distribution of the survey composite, in the heteroscedastic (different variances
between ­populations) case we obtain means of (g475W −​ z850LP)0 =​ 0.97 ±​ 0.04 and
1.36 ±​ 0.04 with Gaussian full-widths at half-maximum (FWHMs) of 0.12 ±​ 0.02
and 0.15 ±​ 0.02, respectively. 101 clusters are associated with the blue peak and 110
clusters with the red peak. A unimodal distribution is rejected at high confidence
(P <​ 0.001, χ2
test). Similar results were obtained in the homoscedastic case.
For NGC 1277, a unimodal distribution cannot be rejected because the null
hypothesis has P =​ 0.371 confidence (χ2
test). Notwithstanding the possibility of
unimodality, in the homoscedastic case for two populations we obtain means of
(g475W −​ z850LP)0 =​ 0.86 ±​ 0.24 and 1.31 ±​ 0.10 each with a FWHM of 0.21 ±​ 0.08. 21
clusters are associated with the blue peak and 99 clusters with the red peak (Fig. 2).
We define a blue fraction fblue =​ Nblue/(Nblue +​ Nred).
We consider two sources of uncertainty for fblue. The uncertainty returned from
GMM on the number of blue and red clusters we regard as our systematic
­uncertainty. In addition, a random uncertainty on fblue comes from our background
subtraction. To quantify the true value of fblue and this uncertainty, we performed
1,000 Monte Carlo simulations in which we selected clusters randomly from our
background regions (until the observed background level was reached), and varied
the radial apertures of the background and NGC 1277 selection regions by ±​3 kpc
(±​9 arcsec). From this we built new colour distributions and ran GMM on
these colour distributions to obtain fblue (Extended Data Fig. 5). For the
homoscedastic case, we obtain = . ± .− .
+ .
f 0 18 (systematic) 0 04 (random)blue 0 17
0 12
(16th–84th percentiles); for the heteroscedastic case, we obtain
= . − .
+ .
− .
+ .
f 0 17 (systematic) (random)blue 0 17
0 12
0 05
0 06
(16th–84th percentiles). We con-
servatively take this latter value as the true blue fraction and its associated uncer-
tainties. From the Monte Carlo simulations, we find / = . − .
+ .
N N 0 21blue red 0 20
0 25
(16th–84th percentiles). We consider these as upper limits because the unimodal
hypothesis cannot be rejected.
As a sanity check, we compared the colour distributions of NGC 1277
with those of NGC 1278 (Extended Data Fig. 4). We remove contributions
from intracluster clusters to the colour distribution of NGC 1278 by selecting
­clusters in a region away from bright galaxies (centred on a right ascension of
3 h 19 min 57.0 s and declination of +​41° 35′​ 30.0″​) over an area normalized to
that of our cluster-selection region. NGC 1278 shows a prominent blue peak of
clusters and a less prominent red peak. GMM (heteroscedastic case) locates peaks
at (g475W −​ z850LP)0 =​ 0.95 ±​ 0.24 and 1.40 ±​ 0.10. These solutions are in excellent
agreement with expectations11
.
Surface-density profiles of the clusters. The surface-density profile of clusters
(Extended Data Fig. 3) was constructed by counting globular clusters in semi-­
circular annuli and dividing by the area of each semi-annulus. We only counted
clusters in the northern half of the galaxy—bisected by the major axis of the
­galaxy—to minimize contamination from the cluster system of NGC 1278. The
inner two radial bins have been corrected on the basis of our completeness tests.
The clusters closely follow the galaxy light15
. This is a characteristic property of
red clusters in massive galaxies34
. By contrast, blue clusters generally have spatial
distributions that are more extended than the galaxy stars18,34
. To define the radial
extent of the system, and to locate the background level, we fitted the data with a
modified Sérsic function35
:
=





−











−










+
/
N R N b
R
R
( ) exp 1 bkgn
n
GC e
e
1
with Ne the surface density of clusters at radius Re, n the Sérsic index and bkg the
background value; bn is related to n as bn =​ 1.9992n −​ 0.3271.
A Sérsic fit (with Ne =​ 7.8 ±​ 0.7 kpc−2
, Re =​ 2.6 ±​ 0.2 kpc, n =​ 0.9 ±​ 0.3,
bkg =​ 0.27 ±​ 0.01 kpc−2
) to the surface-density profile of the clusters (Extended
Data Fig. 3), along with visual inspection, indicates that we reach the background
level about 11 kpc from the centre of NGC 1277. We consider this the full radial
extent of the NGC 1277 cluster system.
Globular-cluster luminosity functions. We constructed cluster luminosity func-
tions for the clusters in NGC 1277 to obtain an independent distance estimate to the
galaxy using the turn-over of the luminosity function of the clusters as a ­standard
candle36
, and to calculate the total size of the cluster system. Again, we selected only
from the northern half of the galaxy to minimize interlopers from NGC 1278. We
binned the g475W and z850LP magnitudes of the clusters as a function of magnitude
(0.5-mag bins) and ran a version of a maximum likelihood code37
that fits for
the mean (μ), FWHM (σ) and normalization of the distribution. The code takes
into full account the background, incompleteness and photometric errors. In g475W
(z850LP), we obtain μ =​ 26.95 ±​ 0.15 mag (25.80 ±​ 0.20 mag) and σ =​ 1.25 ±​ 0.15
(1.35 ±​ 0.20). Assuming ‘universal’ absolute magnitudes for the turn-over of the
luminosity function of Mg475W =​ −​7.2 mag (Mz850LP =​ −​8.4 mag)38
, we obtain
distance moduli of (m −​ M)0 =​ 34.15 ±​ 0.15 ((m −​ M)0 =​ 34.20 ±​ 0.20). These
values are in excellent agreement with our adopted distance to NGC 1277.
© 2018 Macmillan Publishers Limited, part of Springer Nature. All rights reserved.
LetterRESEARCH
Total cluster population of NGC 1277. We counted the total number of
­clusters brighter than the turn-over of the luminosity function of the clusters
(26.95 ±​ 0.15 mag in g475W) that lie within 11 kpc of the galaxy centre within the
northern half of NGC 1277. In so doing, we detect 92 ±​ 18 clusters to our photo­
metric limit, where the uncertainties come from the uncertainty of ±​0.2 mag in
the peak position of the luminosity function. From this number we subtracted
the expected contribution from NGC 1278 clusters (27 ±​ 8 clusters). Correcting
for radial incompleteness, this number becomes 93.9 ±​ 23.0. We then doubled
the total number of clusters to account for the undetected faint half of the lumi-
nosity function, and doubled it again because we constructed the surface-density
profile in the northern half of the galaxy. We arrive at a total cluster population
of Ncluster =​ 376 ±​ 94. For MV  =​ −​20.87 (NASA Extragalactic Database, https://
ned.ipac.caltech.edu/), this cluster population yields a specific frequency of
SN =​ 1.7 ±​ 0.4, consistent with galaxies in the stellar mass range of NGC 1277,
which typically have SN ≈​ 2.0 (ref. 39).
The blue tilt. The ‘blue tilt’ manifests as a colour–magnitude relation in the
blue clusters whereby the brightest blue clusters become redder with ­increasing
luminosity40–42
. This can make the colour distributions for the brightest ­clusters
look unimodal. We investigated this issue by making colour distributions
from the median bin values of our Monte Carlo simulations for the NGC 1277
­clusters binned by magnitude (Extended Data Fig. 6). The mean colours of all
three bins are very similar and predominantly red, with 〈​g475W −​ z850LP〉​ =​ 1.22
(22.0 <​ z850LP <​  24.0), 〈​g475W −​ z850LP〉​ =​  1.19 (24.0  <​ z850LP <​  25.0) and
〈​g475W −​ z850LP〉​ =​ 1.23 (25.0 <​ z850LP <​ 26.5). This behaviour is not expected if a
blue tilt were driving the observed colour distributions. The majority of the clusters
with (g475W −​ z850LP)0 ≤​ 1.1 are consistent with the background residuals. However,
a few of the brightest clusters (eight) are above the background. These ‘blue’ clusters
constitute a small fraction of the overall cluster population.
The environments of relic galaxies. NGC 1277 lies 3.8 arcmin (roughly 80 kpc)
in projection to the north of the central massive galaxy NGC 1275 in the Perseus
cluster of galaxies. However, it is not unexpected that such a relic galaxy should be
found in such a dense environment.
Observational studies that have looked specifically at the preferred environ-
ments of massive compact galaxies in the nearby Universe find that the fraction
of present-day compact, quiescent galaxies with stellar masses of more than about
3 ×​ 1010
M that lie in low-density environments is approximately 4.4%43
. The cor-
responding fraction in nearby galaxy clusters is about 22%44
. Similar dependencies
on environmental density have been obtained from different samples45,46
. Of the
16 best-studied nearby, massive, compact galaxies (including NGC 1277), 7 are in
clusters, 4 in groups and 5 in isolated systems17
.
On the theoretical side, dark-matter-only simulations have been used47
to
explore the clustering properties of massive, compact galaxies, and reveal that the
fraction of massive, compact galaxies is about five times larger in the most massive
structures than in low-mass dark-matter haloes. Similarly, semi-analytic models
have been used45
to explore the environments of compact, massive galaxies, and
reveal that these galaxies represent about 0.04% of the total galaxy ­population, but
about 0.18% of the galaxy population in clusters. In addition, compact ­galaxies
preferentially lie in the centres of clusters (the inner 0.2 virial radii, which corre-
sponds to 400 kpc in Perseus), whereas non-compact galaxies of the same mass
have mean cluster-centric radii of around 0.4 virial radii45
. The evolution of
­massive compact systems at z =​ 2 has previously been explored26
in cosmological,
hydro­dynamical simulations: of a sample of 35 galaxies, roughly 30% remained
­sufficiently undisturbed to be defined as relics at z =​ 0. Of these relics, about 20%
survive as satellites in galaxy clusters.
In summary, although massive, compact, ‘relic’ galaxies are rare in the nearby
Universe (with space densities of 10−5
 Mpc−3
)48,49
, they are expected to be prefer-
entially found in the most massive structures, such as the Perseus cluster of galaxies.
Accretion models for cluster formation. To obtain a quantitative understanding
of the link between the colour distributions of clusters and the accretion history
of a galaxy, we constructed a library of analytic merger histories for NGC 1277.
We ran 1.5 ×​ 106
model realizations of NGC 1277 in which we reconstruct its total
present-day stellar mass (M*
) by assuming that it had accreted some fraction of its
stellar mass 0 ≤​ facc ≤​ 1. To test rare, or non-cosmological merger histories, for each
realization we draw satellite galaxies from a sub-halo dark-matter mass function
with a randomly selected slope −​1 ≤​ α ≤​ 0. These satellites are assigned stellar mass
stochastically via empirical abundance-matching relations50
and their stellar mass
is added to the in situ stellar mass of NGC 1277 (Minsitu =​ (1 −​ facc)M*,obs) until the
observed total present-day stellar mass of NGC 1277 (M*,obs) is reached for that
merger-history realization. This necessitates a dynamic sub-halo mass-function
cut-off, because the maximum accreted sub-halo at any point cannot be more than
the total accreted mass for that trial and must be less than the in situ mass. This
ensures a working definition of the primary being most massive and, importantly,
preserves an accretion fraction of facc and total mass of M*,obs at the end of each trial.
The stellar mass of each sub-halo sets its metallicity9,51
(and the metallicity of the
clusters that are accreted with it), and the dark-matter mass of the satellite provides
the specific frequency of clusters for that satellite39,52
(with stochastic sampling
of the scatter in all of the relations). The same relations are used to construct the
­cluster population of the in situ component of NGC 1277 in every realization.
Finally, the cluster metallicities are converted to g475W −​ z850LP colours11
.
This exercise is qualitatively similar to that used previously8
with the added
benefit that we allow for a flexible slope of the sub-halo mass function, rather
than constraining it on the basis of average accretion histories in cold dark matter
simulations. This addition allows us to explore how the cluster colour distribu-
tions and galaxy stellar mass could arise in potentially rare scenarios with either
very low or high numbers of mergers or consecutive extreme-mass-ratio mergers.
Although simple, these models recover the ensemble properties of the observed
cluster colour and number distributions for galaxies of the mass of NGC 1277.
Extended Data Fig. 7 shows the accreted fraction of each realization of NGC 1277
(with each dot representing one possible merger history that reproduces the total
mass of NGC 1277) versus the ratio of the number of in situ to accreted (red to
blue) ­clusters for NGC 1277 in that realization. We have conservatively used the
­minimum Ninsitu/Nacc value allowed within the error bars (Ninsitu/Nacc =​ 2.17)
rather than Ninsitu/Nacc =​ Nred/Nblue =​ 99/21 =​ 4.76. The observed colour ratio of
the ­clusters in NGC 1277 is characteristic of galaxies that have undergone merger
histories resulting in the host accreting 12% of the present-day stellar mass. In
comparison, galaxies of comparable mass to NGC 1277 in the ACS VCS ­sample
have observed colour distributions (Nred/Nblue ≤​ 1) typical of having accreted
50%–90% of their stellar mass. A very small percentage (about 0.02%) of these
high-facc models can produce cluster colour ratios similar to that for NGC 1277.
However, Fig. 4 and Extended Data Fig. 8 show that these high-facc assembly
histories tend to over-predict the total number of clusters per unit mass (SN ≥​ 2)
and to result in systems with dark-matter masses of 1014
M or more, which is ruled
out for NGC 1277 by dynamical modelling17,24
. Extended Data Fig. 8 illustrates
that the typical merger histories in our models that successfully reproduce the SN
and colour distribution of NGC 1277 tend to have accreted only facc =​ 12% ±​ 8% of
their stellar mass, to have had a merger event with a mass ratio of at most 1:10 and
to reside in under-massive dark-matter haloes (M*
/MDM ≈​ 0.06) when compared
with galaxies of the same stellar mass as NGC 1277. These models support the
idea that NGC 1277 has not accreted substantial amounts of dark-matter-rich sub-
haloes, leaving it deficient both in dark-matter mass and in blue, accreted clusters.
Sample size. No statistical methods were used to predetermine sample size.
Code availability. The photometry software Source Extractor and PSFEx are
publicly available at https://www.astromatic.net/software/sextractor and https://
www.astromatic.net/software/psfex. The GMM code is publicly available at
http://www-personal.umich.edu/~​ognedin/gmm/. A version of the globular
cluster luminosity function fitting code is available on request. The code used
for the ­modelling of the accretion histories of NGC 1277 will be made available
in the future.
Data availability. The HST data used was obtained under GO programmes 14215
and 10546 and are publicly available at https://archive.stsci.edu/proposal_search.
php?id=​14215&mission=​hst and https://archive.stsci.edu/proposal_search.
php?id=​10546&mission=​hst. Data products such as the point-source photometry
and results of the Monte Carlo simulations are available from the corresponding
author on request.
29.	 Bertin, E. & Arnout, S. SExtractor: software for source extraction. Astron.
Astrophys. Suppl. Ser. 117, 393–404 (1996).
30.	 Bertin, E. Automated morphometry with SExtractor and PSFEx. ASP Conf. Ser.
442, 435–438 (2011).
31.	 Schlafly, E. F. & Finkbeiner, D. P. Measuring reddening with Sloan Digital Sky
Survey stellar spectra and recalibrating SFD. Astrophys. J. 737, 103 (2011).
32.	 Bohlin, R. C. Perfecting the photometric calibration of the ACS CCD cameras.
Astron. J. 152, 60 (2016).
33.	 Scott, D. W. Multivariate Density Estimation: Theory, Practice, and Visualization
7–11 (John Wiley & Sons, 1992).
34.	 Pota, V. et al. The SLUGGS survey: kinematics for over 2500 globular clusters
in 12 early-type galaxies. Mon. Not. R. Astron. Soc. 428, 389–420 (2013).
35.	 Sérsic, J. L. The influence of the atmospheric and instrumental dispersion on
the brightness distribution in a galaxy. Bol. Asoc. Argentina Astron. 6, 41–43
(1963).
36.	 Ferrarese, L. et al. A database of Cepheid distance moduli and tip of the red
giant branch, globular cluster luminosity function, planetary nebula luminosity
function, and surface brightness fluctuation data useful for distance
determinations. Astrophys. J. Suppl. Ser. 128, 431–459 (2000).
37.	 Secker, J. & Harris, W. E. A maximum likelihood analysis of globular cluster
luminosity distributions in the Virgo ellipticals. Astron. J. 105, 1358–1368 (1993).
38.	 Jordán, A. et al. The ACS Virgo Cluster Survey. XII. The luminosity function of
globular clusters in early-type galaxies. Astrophys. J. Suppl. Ser. 171, 101–145
(2007).
© 2018 Macmillan Publishers Limited, part of Springer Nature. All rights reserved.
Letter RESEARCH
39.	 Peng, E. W. et al. The ACS Virgo Cluster Survey. XV. The formation efficiencies
of globular clusters in early-type galaxies: the effects of mass and
environment. Astrophys. J. 681, 197–224 (2008).
40.	 Harris, W. E. et al. Globular cluster systems in brightest cluster galaxies.
bimodal metallicity distributions and the nature of the high-luminosity
clusters. Astrophys. J. 636, 90–114 (2006).
41.	 Strader, J., Brodie, J. P., Spitler, L. & Beasley, M. A. Globular clusters in Virgo
ellipticals: unexpected results for giants and dwarfs from advanced camera for
surveys imaging. Astron. J. 132, 2333–2345 (2006).
42.	 Mieske, S. et al. The ACS Fornax Cluster Survey. IX. The color–magnitude
relation of globular cluster systems. Astrophys. J. 710, 1672–1682 (2010).
43.	 Poggianti, B. M. et al. Superdense galaxies and the mass-size relation at low
redshift. Astrophys. J. 762, 77 (2013).
44.	 Valentinuzzi, T. et al. Superdense massive galaxies in wings local clusters.
Astrophys. J. 712, 226–237 (2010).
45.	 Peralta de Arriba, L., Quilis, V., Trujillo, I., Cebrián, M. & Balcells, M. Massive relic
galaxies prefer dense environments. Mon. Not. R. Astron. Soc. 461, 156–163
(2016).
46.	 Damjanov, I., Zahid, H. J., Geller, M. J. & Hwang, H. S. The environment of
massive quiescent compact galaxies at 0.1<​z<​0.4 in the COSMOS field.
Astrophys. J. 815, 104 (2015).
47.	 Stringer, M., Trujillo, I., Dalla Vecchia, C. & Martinez-Valpuesta, I. A cosmological
context for compact massive galaxies. Mon. Not. R. Astron. Soc. 449,
2396–2404 (2015).
48.	 Trujillo, I. et al. Superdense Massive Galaxies in the Nearby Universe. Astrophys.
J. 692, L118–L122 (2009).
49.	 Taylor, E. N. et al. On the dearth of compact, massive, red sequence galaxies in
the local Universe. Astrophys. J. 720, 723–741 (2010).
50.	 Leauthaud, A. et al. New constraints on the evolution of the stellar- to-dark
matter connection: a combined analysis of galaxy-galaxy lensing, clustering,
and stellar mass functions from z=​0.2 to z=​1. Astrophys. J. 744, 159 (2012).
51.	 Kirby, E. N. et al. The Universal stellar mass-stellar metallicity relation for dwarf
galaxies. Astrophys. J. 779, 102 (2013).
52.	 Georgiev, I. Y., Puzia, T. H., Goudfrooij, P. & Hilker, M. Globular cluster systems in
nearby dwarf galaxies – III. Formation efficiencies of old globular clusters.
Mon. Not. R. Astron. Soc. 406, 1967–1984 (2010).
© 2018 Macmillan Publishers Limited, part of Springer Nature. All rights reserved.
LetterRESEARCH
Extended Data Figure 1 | Colour-composite HST image of the
massive relic galaxy NGC 1277. The image was constructed from
g475W +​ r625W +​ z850LP bands. The g475W and z850LP imaging was
obtained with the HST programme GO-14215 and the r625W imaging
with the programme GO-10546. NGC 1277 is the best example found
so far in the nearby Universe with characteristics equivalent to those
of the first massive galaxies to form more than 11 Gyr ago. The image
is oriented with north pointing up and east to the left. The field of
view is 42.2 arcsec ×​ 30.6 arcsec, corresponding to a physical scale of
14.5 kpc ×​ 10.5 kpc at our adopted distance of 73.3 Mpc to the galaxy. The
images have been scaled with logarithmic intensity to highlight the various
structures in the galaxy. The vast majority of point sources surrounding
NGC 1277 are clusters associated with the galaxy. Two example clusters
have been marked with ticks.
© 2018 Macmillan Publishers Limited, part of Springer Nature. All rights reserved.
Letter RESEARCH
Extended Data Figure 2 | Colour–magnitude diagrams of cluster
candidates. From left to right, the plots show all point sources in the
field, NGC 1278 clusters, raw (not background-corrected) NGC 1277
clusters and an example background field. Also shown are the photometric
uncertainties (1σ; blue crosses) based on our artificial point-source test,
and the 100% completeness limit (red dashed lines; see Methods).
© 2018 Macmillan Publishers Limited, part of Springer Nature. All rights reserved.
LetterRESEARCH
Extended Data Figure 3 | Surface-density profile of NGC 1277 clusters.
The figure shows the raw (blue circles) and completeness-corrected
(orange stars) counts. Uncertainties are 16th–84th percentiles. Within
the range 3–10 kpc, the clusters closely follow the light distribution of the
galaxy. This is typical of red clusters. The background is determined from
the Sérsic function fits (which include a background term; green line) to
the cluster data and defines the radial extent of the cluster system, which
ends at 11 kpc (about 10Re). The stellar-mass density profile15
(red line)
has arbitrary normalization. GCs, globular clusters.
© 2018 Macmillan Publishers Limited, part of Springer Nature. All rights reserved.
Letter RESEARCH
Extended Data Figure 4 | Colour distribution of clusters in NGC 1277
compared with that for the companion galaxy in projection NGC 1278.
The figure shows that NGC 1278 (blue) has a strong peak of blue clusters
that is not seen in NGC 1277 (orange). The expected background
contamination of NGC 1278 clusters and of intracluster clusters to the
cluster system of NGC 1277, with which we have corrected the colour
distribution of NGC 1277, is also shown (green). The predominantly blue
colours of the contaminating clusters is expected because they correspond
to the outskirts of NGC 1278 (see Fig. 1). Solid curves are two-Gaussian
solutions from the GMM code28
; dashed curves are individual Gaussian
components from GMM. A single Gaussian fit to the NGC 1277 clusters
with GMM gives 〈​g475W −​ z850LP〉​ =​ 1.22 ±​ 0.03, with a FWHM of
0.28 ±​ 0.02.
© 2018 Macmillan Publishers Limited, part of Springer Nature. All rights reserved.
LetterRESEARCH
Extended Data Figure 5 | Distribution of the blue cluster fraction from Monte Carlo simulations. The vertical dashed lines indicate the medians of
the distributions and the vertical dotted lines show the 16th and 84th percentiles.
© 2018 Macmillan Publishers Limited, part of Springer Nature. All rights reserved.
Letter RESEARCH
Extended Data Figure 6 | Colour distributions of NGC 1277 and NGC 1278 in three magnitude bins. The bin values for the NGC 1277 clusters
represent the medians of the bin values from Monte Carlo simulations. Uncertainties are the 16th–84th percentiles of the distributions.
© 2018 Macmillan Publishers Limited, part of Springer Nature. All rights reserved.
LetterRESEARCH
Extended Data Figure 7 | Accretion models for the build-up of the
NGC 1277 cluster system. Each point is a single merger history for
NGC 1277, characterized by the total fraction of accreted stellar mass
versus the number ratio of in situ to accreted clusters for that realization.
The observed ratio for NGC 1277 is indicated by the cyan dashed line
(Nblue/Nred =​ 0.21) and is characteristic of galaxies with merger histories
leading to facc ≈​ 10% (orange). The cyan arrow indicates that the
in situ fraction is a lower limit. Galaxies with comparable stellar mass to
NGC 1277 in the ACS VCS tend to have equal numbers of blue and red
clusters, which is more common for accretion histories of facc ≈​ 50%–90%
(green). The extremely rare (about 0.02%) high-mass-accretion
realizations, which produce the observed blue/red fraction in NGC 1277,
are shown in magenta. Contours represent 10%, 25%, 50%, 75%, 90% and
99% of the maximum of the two-dimensional distribution.
© 2018 Macmillan Publishers Limited, part of Springer Nature. All rights reserved.
Letter RESEARCH
Extended Data Figure 8 | Predictions of galaxy properties from
accretion models. From left to right, the black lines show the accretion
fraction, the number of mergers, the maximum mass ratio of the merger
and the final ratio of stellar to dark-matter mass for all of the merger
realizations. The magenta distributions (top) show the high-facc merger
histories that satisfy the constraint on the colour ratio of the clusters
(which happens rarely; see, for example, Extended Data Fig. 7). The cyan
distributions (bottom) show the low-facc merger histories that satisfy the
observed colour ratio of the clusters and the SN constraints. The high-
accretion-fraction models (magenta) also predict a dark-matter-halo mass
for NGC 1277 that is larger than the observational constraints17
(indicated
by the arrow in the bottom right panel). The vertical dashed lines represent
the median of the distributions and the vertical dotted lines show the 16th
and 84th percentiles.
© 2018 Macmillan Publishers Limited, part of Springer Nature. All rights reserved.

Más contenido relacionado

La actualidad más candente

Toward a new_distance_to_the_active_galaxy_ngc4258
Toward a new_distance_to_the_active_galaxy_ngc4258Toward a new_distance_to_the_active_galaxy_ngc4258
Toward a new_distance_to_the_active_galaxy_ngc4258
Sérgio Sacani
 
Detection of solar_like_oscillations_in_relies_of_the_milk_way_asteroseismolo...
Detection of solar_like_oscillations_in_relies_of_the_milk_way_asteroseismolo...Detection of solar_like_oscillations_in_relies_of_the_milk_way_asteroseismolo...
Detection of solar_like_oscillations_in_relies_of_the_milk_way_asteroseismolo...
Sérgio Sacani
 
The central star_of_the_planetary_nebula_ngc_6537
The central star_of_the_planetary_nebula_ngc_6537The central star_of_the_planetary_nebula_ngc_6537
The central star_of_the_planetary_nebula_ngc_6537
Sérgio Sacani
 
T he effect_of_orbital_configuration)_on_the_possible_climates_and_habitabili...
T he effect_of_orbital_configuration)_on_the_possible_climates_and_habitabili...T he effect_of_orbital_configuration)_on_the_possible_climates_and_habitabili...
T he effect_of_orbital_configuration)_on_the_possible_climates_and_habitabili...
Sérgio Sacani
 
Evidence for a_distant_giant_planet_in_the_solar_system
Evidence for a_distant_giant_planet_in_the_solar_systemEvidence for a_distant_giant_planet_in_the_solar_system
Evidence for a_distant_giant_planet_in_the_solar_system
Sérgio Sacani
 
A close pair_binary_in_a_distant_triple_supermassive_black_hole_system
A close pair_binary_in_a_distant_triple_supermassive_black_hole_systemA close pair_binary_in_a_distant_triple_supermassive_black_hole_system
A close pair_binary_in_a_distant_triple_supermassive_black_hole_system
Sérgio Sacani
 
A dynamical signature_of_multiple_stellar_populations_in_47_tucanae
A dynamical signature_of_multiple_stellar_populations_in_47_tucanaeA dynamical signature_of_multiple_stellar_populations_in_47_tucanae
A dynamical signature_of_multiple_stellar_populations_in_47_tucanae
Sérgio Sacani
 
Black hole growth in the early universe is self regulated and largely hidde...
 Black hole growth in the early universe is  self regulated and largely hidde... Black hole growth in the early universe is  self regulated and largely hidde...
Black hole growth in the early universe is self regulated and largely hidde...
Sérgio Sacani
 
The stelar mass_growth_of_brightest_cluster_galaxies_in_the_irac_shallow_clus...
The stelar mass_growth_of_brightest_cluster_galaxies_in_the_irac_shallow_clus...The stelar mass_growth_of_brightest_cluster_galaxies_in_the_irac_shallow_clus...
The stelar mass_growth_of_brightest_cluster_galaxies_in_the_irac_shallow_clus...
Sérgio Sacani
 

La actualidad más candente (20)

Toward a new_distance_to_the_active_galaxy_ngc4258
Toward a new_distance_to_the_active_galaxy_ngc4258Toward a new_distance_to_the_active_galaxy_ngc4258
Toward a new_distance_to_the_active_galaxy_ngc4258
 
No signature of_ejecta_interaction_with_a_stellar_companion_in_three_type_ia_...
No signature of_ejecta_interaction_with_a_stellar_companion_in_three_type_ia_...No signature of_ejecta_interaction_with_a_stellar_companion_in_three_type_ia_...
No signature of_ejecta_interaction_with_a_stellar_companion_in_three_type_ia_...
 
The Cosmic V-Web
The Cosmic V-WebThe Cosmic V-Web
The Cosmic V-Web
 
A 2 4_determination_of_the_local_value_of_the_hubble_constant
A 2 4_determination_of_the_local_value_of_the_hubble_constantA 2 4_determination_of_the_local_value_of_the_hubble_constant
A 2 4_determination_of_the_local_value_of_the_hubble_constant
 
Remnants of the_sagittarius_dwarf_spheroidal_galaxy_around_the_young_globular...
Remnants of the_sagittarius_dwarf_spheroidal_galaxy_around_the_young_globular...Remnants of the_sagittarius_dwarf_spheroidal_galaxy_around_the_young_globular...
Remnants of the_sagittarius_dwarf_spheroidal_galaxy_around_the_young_globular...
 
Kepler 1647b the_largest_and_longest_period_kepler_transiting_circumbinary_pl...
Kepler 1647b the_largest_and_longest_period_kepler_transiting_circumbinary_pl...Kepler 1647b the_largest_and_longest_period_kepler_transiting_circumbinary_pl...
Kepler 1647b the_largest_and_longest_period_kepler_transiting_circumbinary_pl...
 
2041 8205 743-2_l37
2041 8205 743-2_l372041 8205 743-2_l37
2041 8205 743-2_l37
 
The canarias einstein_ring_a_newly_discovered_optical_einstein_ring
The canarias einstein_ring_a_newly_discovered_optical_einstein_ringThe canarias einstein_ring_a_newly_discovered_optical_einstein_ring
The canarias einstein_ring_a_newly_discovered_optical_einstein_ring
 
Detection of solar_like_oscillations_in_relies_of_the_milk_way_asteroseismolo...
Detection of solar_like_oscillations_in_relies_of_the_milk_way_asteroseismolo...Detection of solar_like_oscillations_in_relies_of_the_milk_way_asteroseismolo...
Detection of solar_like_oscillations_in_relies_of_the_milk_way_asteroseismolo...
 
The central star_of_the_planetary_nebula_ngc_6537
The central star_of_the_planetary_nebula_ngc_6537The central star_of_the_planetary_nebula_ngc_6537
The central star_of_the_planetary_nebula_ngc_6537
 
T he effect_of_orbital_configuration)_on_the_possible_climates_and_habitabili...
T he effect_of_orbital_configuration)_on_the_possible_climates_and_habitabili...T he effect_of_orbital_configuration)_on_the_possible_climates_and_habitabili...
T he effect_of_orbital_configuration)_on_the_possible_climates_and_habitabili...
 
Evidence for a_distant_giant_planet_in_the_solar_system
Evidence for a_distant_giant_planet_in_the_solar_systemEvidence for a_distant_giant_planet_in_the_solar_system
Evidence for a_distant_giant_planet_in_the_solar_system
 
Hst imaging of_fading_agn_candidates_i_host_galaxy_properties_and_origin_of_t...
Hst imaging of_fading_agn_candidates_i_host_galaxy_properties_and_origin_of_t...Hst imaging of_fading_agn_candidates_i_host_galaxy_properties_and_origin_of_t...
Hst imaging of_fading_agn_candidates_i_host_galaxy_properties_and_origin_of_t...
 
A close pair_binary_in_a_distant_triple_supermassive_black_hole_system
A close pair_binary_in_a_distant_triple_supermassive_black_hole_systemA close pair_binary_in_a_distant_triple_supermassive_black_hole_system
A close pair_binary_in_a_distant_triple_supermassive_black_hole_system
 
Final_Paper
Final_PaperFinal_Paper
Final_Paper
 
A dynamical signature_of_multiple_stellar_populations_in_47_tucanae
A dynamical signature_of_multiple_stellar_populations_in_47_tucanaeA dynamical signature_of_multiple_stellar_populations_in_47_tucanae
A dynamical signature_of_multiple_stellar_populations_in_47_tucanae
 
Asassn 15ih a_highly_super_luminous_supernova
Asassn 15ih a_highly_super_luminous_supernovaAsassn 15ih a_highly_super_luminous_supernova
Asassn 15ih a_highly_super_luminous_supernova
 
Black hole growth in the early universe is self regulated and largely hidde...
 Black hole growth in the early universe is  self regulated and largely hidde... Black hole growth in the early universe is  self regulated and largely hidde...
Black hole growth in the early universe is self regulated and largely hidde...
 
Using the milk_way_satellites_to_study_interactions_between_cold_dark_matter_...
Using the milk_way_satellites_to_study_interactions_between_cold_dark_matter_...Using the milk_way_satellites_to_study_interactions_between_cold_dark_matter_...
Using the milk_way_satellites_to_study_interactions_between_cold_dark_matter_...
 
The stelar mass_growth_of_brightest_cluster_galaxies_in_the_irac_shallow_clus...
The stelar mass_growth_of_brightest_cluster_galaxies_in_the_irac_shallow_clus...The stelar mass_growth_of_brightest_cluster_galaxies_in_the_irac_shallow_clus...
The stelar mass_growth_of_brightest_cluster_galaxies_in_the_irac_shallow_clus...
 

Similar a A single population of red globular clusters around the massive compact galaxy NGC 1277

DISSERTATIONJOAKIM676951
DISSERTATIONJOAKIM676951DISSERTATIONJOAKIM676951
DISSERTATIONJOAKIM676951
Joakim Carlsen
 
Supermassive black holes do not correlate with galaxy disks or pseudobulges
Supermassive black holes do not correlate with galaxy disks or pseudobulgesSupermassive black holes do not correlate with galaxy disks or pseudobulges
Supermassive black holes do not correlate with galaxy disks or pseudobulges
Sérgio Sacani
 
Magnetic support of_the_optical_emission_line_filaments_in_ngc_1275
Magnetic support of_the_optical_emission_line_filaments_in_ngc_1275Magnetic support of_the_optical_emission_line_filaments_in_ngc_1275
Magnetic support of_the_optical_emission_line_filaments_in_ngc_1275
Sérgio Sacani
 
An actively accreting massive black hole in the dwarf starburst galaxy henize...
An actively accreting massive black hole in the dwarf starburst galaxy henize...An actively accreting massive black hole in the dwarf starburst galaxy henize...
An actively accreting massive black hole in the dwarf starburst galaxy henize...
Sérgio Sacani
 
On some structural_features_of_the_metagalaxy
On some structural_features_of_the_metagalaxyOn some structural_features_of_the_metagalaxy
On some structural_features_of_the_metagalaxy
Sérgio Sacani
 
Galaxy dynamics and the mass density of the universe
Galaxy dynamics and the mass density of the universeGalaxy dynamics and the mass density of the universe
Galaxy dynamics and the mass density of the universe
Sérgio Sacani
 
Restricted entry of_globular_cluster_stars_to_the_asymptotic_giant_branch
Restricted entry of_globular_cluster_stars_to_the_asymptotic_giant_branchRestricted entry of_globular_cluster_stars_to_the_asymptotic_giant_branch
Restricted entry of_globular_cluster_stars_to_the_asymptotic_giant_branch
Sérgio Sacani
 
Three newly discovered_globular_clusters_in_ngc6822
Three newly discovered_globular_clusters_in_ngc6822Three newly discovered_globular_clusters_in_ngc6822
Three newly discovered_globular_clusters_in_ngc6822
Sérgio Sacani
 
The massive relic galaxy NGC 1277 is dark matter deficient From dynamical mod...
The massive relic galaxy NGC 1277 is dark matter deficient From dynamical mod...The massive relic galaxy NGC 1277 is dark matter deficient From dynamical mod...
The massive relic galaxy NGC 1277 is dark matter deficient From dynamical mod...
Sérgio Sacani
 
Mapping the three_dimensional_density_of_the_galactic_bulge_with_vvv_red_clum...
Mapping the three_dimensional_density_of_the_galactic_bulge_with_vvv_red_clum...Mapping the three_dimensional_density_of_the_galactic_bulge_with_vvv_red_clum...
Mapping the three_dimensional_density_of_the_galactic_bulge_with_vvv_red_clum...
Sérgio Sacani
 
Star formation at the smallest scales; A JWST study of the clump populations ...
Star formation at the smallest scales; A JWST study of the clump populations ...Star formation at the smallest scales; A JWST study of the clump populations ...
Star formation at the smallest scales; A JWST study of the clump populations ...
Sérgio Sacani
 
A density cusp of quiescent X-ray binaries in the central parsec of the Galaxy
A density cusp of quiescent X-ray binaries in the central parsec of the GalaxyA density cusp of quiescent X-ray binaries in the central parsec of the Galaxy
A density cusp of quiescent X-ray binaries in the central parsec of the Galaxy
Sérgio Sacani
 
A 300 parsec-long jet-inflated bubble around a powerful microquasar in the ga...
A 300 parsec-long jet-inflated bubble around a powerful microquasar in the ga...A 300 parsec-long jet-inflated bubble around a powerful microquasar in the ga...
A 300 parsec-long jet-inflated bubble around a powerful microquasar in the ga...
Sérgio Sacani
 

Similar a A single population of red globular clusters around the massive compact galaxy NGC 1277 (20)

DISSERTATIONJOAKIM676951
DISSERTATIONJOAKIM676951DISSERTATIONJOAKIM676951
DISSERTATIONJOAKIM676951
 
Supermassive black holes do not correlate with galaxy disks or pseudobulges
Supermassive black holes do not correlate with galaxy disks or pseudobulgesSupermassive black holes do not correlate with galaxy disks or pseudobulges
Supermassive black holes do not correlate with galaxy disks or pseudobulges
 
Magnetic support of_the_optical_emission_line_filaments_in_ngc_1275
Magnetic support of_the_optical_emission_line_filaments_in_ngc_1275Magnetic support of_the_optical_emission_line_filaments_in_ngc_1275
Magnetic support of_the_optical_emission_line_filaments_in_ngc_1275
 
Evidence ofr mature_bulges_and_an_inside_out_quenching_phase_3_billion_years_...
Evidence ofr mature_bulges_and_an_inside_out_quenching_phase_3_billion_years_...Evidence ofr mature_bulges_and_an_inside_out_quenching_phase_3_billion_years_...
Evidence ofr mature_bulges_and_an_inside_out_quenching_phase_3_billion_years_...
 
An actively accreting massive black hole in the dwarf starburst galaxy henize...
An actively accreting massive black hole in the dwarf starburst galaxy henize...An actively accreting massive black hole in the dwarf starburst galaxy henize...
An actively accreting massive black hole in the dwarf starburst galaxy henize...
 
On some structural_features_of_the_metagalaxy
On some structural_features_of_the_metagalaxyOn some structural_features_of_the_metagalaxy
On some structural_features_of_the_metagalaxy
 
Galaxy dynamics and the mass density of the universe
Galaxy dynamics and the mass density of the universeGalaxy dynamics and the mass density of the universe
Galaxy dynamics and the mass density of the universe
 
Restricted entry of_globular_cluster_stars_to_the_asymptotic_giant_branch
Restricted entry of_globular_cluster_stars_to_the_asymptotic_giant_branchRestricted entry of_globular_cluster_stars_to_the_asymptotic_giant_branch
Restricted entry of_globular_cluster_stars_to_the_asymptotic_giant_branch
 
Three newly discovered_globular_clusters_in_ngc6822
Three newly discovered_globular_clusters_in_ngc6822Three newly discovered_globular_clusters_in_ngc6822
Three newly discovered_globular_clusters_in_ngc6822
 
The massive relic galaxy NGC 1277 is dark matter deficient From dynamical mod...
The massive relic galaxy NGC 1277 is dark matter deficient From dynamical mod...The massive relic galaxy NGC 1277 is dark matter deficient From dynamical mod...
The massive relic galaxy NGC 1277 is dark matter deficient From dynamical mod...
 
Mapping the three_dimensional_density_of_the_galactic_bulge_with_vvv_red_clum...
Mapping the three_dimensional_density_of_the_galactic_bulge_with_vvv_red_clum...Mapping the three_dimensional_density_of_the_galactic_bulge_with_vvv_red_clum...
Mapping the three_dimensional_density_of_the_galactic_bulge_with_vvv_red_clum...
 
Star formation at the smallest scales; A JWST study of the clump populations ...
Star formation at the smallest scales; A JWST study of the clump populations ...Star formation at the smallest scales; A JWST study of the clump populations ...
Star formation at the smallest scales; A JWST study of the clump populations ...
 
Peekaboo: the extremely metal poor dwarf galaxy HIPASS J1131–31
Peekaboo: the extremely metal poor dwarf galaxy HIPASS J1131–31Peekaboo: the extremely metal poor dwarf galaxy HIPASS J1131–31
Peekaboo: the extremely metal poor dwarf galaxy HIPASS J1131–31
 
Multi wavelenth Observations and Surveys of Galaxy Clusters
Multi wavelenth Observations and Surveys of Galaxy ClustersMulti wavelenth Observations and Surveys of Galaxy Clusters
Multi wavelenth Observations and Surveys of Galaxy Clusters
 
A density cusp of quiescent X-ray binaries in the central parsec of the Galaxy
A density cusp of quiescent X-ray binaries in the central parsec of the GalaxyA density cusp of quiescent X-ray binaries in the central parsec of the Galaxy
A density cusp of quiescent X-ray binaries in the central parsec of the Galaxy
 
A 300 parsec-long jet-inflated bubble around a powerful microquasar in the ga...
A 300 parsec-long jet-inflated bubble around a powerful microquasar in the ga...A 300 parsec-long jet-inflated bubble around a powerful microquasar in the ga...
A 300 parsec-long jet-inflated bubble around a powerful microquasar in the ga...
 
A very luminous_magnetar_powered_supernova_associated_with_an_ultra_long_gamm...
A very luminous_magnetar_powered_supernova_associated_with_an_ultra_long_gamm...A very luminous_magnetar_powered_supernova_associated_with_an_ultra_long_gamm...
A very luminous_magnetar_powered_supernova_associated_with_an_ultra_long_gamm...
 
Multiple images of_a_highly_magnified_supernova_formed_by_an_early_type_clust...
Multiple images of_a_highly_magnified_supernova_formed_by_an_early_type_clust...Multiple images of_a_highly_magnified_supernova_formed_by_an_early_type_clust...
Multiple images of_a_highly_magnified_supernova_formed_by_an_early_type_clust...
 
The behaviour of_dark_matter_associated_with_4_bright_cluster_galaxies_in_the...
The behaviour of_dark_matter_associated_with_4_bright_cluster_galaxies_in_the...The behaviour of_dark_matter_associated_with_4_bright_cluster_galaxies_in_the...
The behaviour of_dark_matter_associated_with_4_bright_cluster_galaxies_in_the...
 
WHAT CAN WE DEDUCE FROM STUDIES OF NEARBY GALAXY POPULATIONS?
WHAT CAN WE DEDUCE FROM STUDIES OF NEARBY GALAXY POPULATIONS?WHAT CAN WE DEDUCE FROM STUDIES OF NEARBY GALAXY POPULATIONS?
WHAT CAN WE DEDUCE FROM STUDIES OF NEARBY GALAXY POPULATIONS?
 

Más de Sérgio Sacani

Biogenic Sulfur Gases as Biosignatures on Temperate Sub-Neptune Waterworlds
Biogenic Sulfur Gases as Biosignatures on Temperate Sub-Neptune WaterworldsBiogenic Sulfur Gases as Biosignatures on Temperate Sub-Neptune Waterworlds
Biogenic Sulfur Gases as Biosignatures on Temperate Sub-Neptune Waterworlds
Sérgio Sacani
 
Asymmetry in the atmosphere of the ultra-hot Jupiter WASP-76 b
Asymmetry in the atmosphere of the ultra-hot Jupiter WASP-76 bAsymmetry in the atmosphere of the ultra-hot Jupiter WASP-76 b
Asymmetry in the atmosphere of the ultra-hot Jupiter WASP-76 b
Sérgio Sacani
 
Formation of low mass protostars and their circumstellar disks
Formation of low mass protostars and their circumstellar disksFormation of low mass protostars and their circumstellar disks
Formation of low mass protostars and their circumstellar disks
Sérgio Sacani
 
Discovery of an Accretion Streamer and a Slow Wide-angle Outflow around FUOri...
Discovery of an Accretion Streamer and a Slow Wide-angle Outflow around FUOri...Discovery of an Accretion Streamer and a Slow Wide-angle Outflow around FUOri...
Discovery of an Accretion Streamer and a Slow Wide-angle Outflow around FUOri...
Sérgio Sacani
 
Disentangling the origin of chemical differences using GHOST
Disentangling the origin of chemical differences using GHOSTDisentangling the origin of chemical differences using GHOST
Disentangling the origin of chemical differences using GHOST
Sérgio Sacani
 
Hubble Asteroid Hunter III. Physical properties of newly found asteroids
Hubble Asteroid Hunter III. Physical properties of newly found asteroidsHubble Asteroid Hunter III. Physical properties of newly found asteroids
Hubble Asteroid Hunter III. Physical properties of newly found asteroids
Sérgio Sacani
 
Observation of Gravitational Waves from the Coalescence of a 2.5–4.5 M⊙ Compa...
Observation of Gravitational Waves from the Coalescence of a 2.5–4.5 M⊙ Compa...Observation of Gravitational Waves from the Coalescence of a 2.5–4.5 M⊙ Compa...
Observation of Gravitational Waves from the Coalescence of a 2.5–4.5 M⊙ Compa...
Sérgio Sacani
 
The SAMI Galaxy Sur v ey: galaxy spin is more strongly correlated with stella...
The SAMI Galaxy Sur v ey: galaxy spin is more strongly correlated with stella...The SAMI Galaxy Sur v ey: galaxy spin is more strongly correlated with stella...
The SAMI Galaxy Sur v ey: galaxy spin is more strongly correlated with stella...
Sérgio Sacani
 
Is Betelgeuse Really Rotating? Synthetic ALMA Observations of Large-scale Con...
Is Betelgeuse Really Rotating? Synthetic ALMA Observations of Large-scale Con...Is Betelgeuse Really Rotating? Synthetic ALMA Observations of Large-scale Con...
Is Betelgeuse Really Rotating? Synthetic ALMA Observations of Large-scale Con...
Sérgio Sacani
 
First Direct Imaging of a Kelvin–Helmholtz Instability by PSP/WISPR
First Direct Imaging of a Kelvin–Helmholtz Instability by PSP/WISPRFirst Direct Imaging of a Kelvin–Helmholtz Instability by PSP/WISPR
First Direct Imaging of a Kelvin–Helmholtz Instability by PSP/WISPR
Sérgio Sacani
 
Hydrogen Column Density Variability in a Sample of Local Compton-Thin AGN
Hydrogen Column Density Variability in a Sample of Local Compton-Thin AGNHydrogen Column Density Variability in a Sample of Local Compton-Thin AGN
Hydrogen Column Density Variability in a Sample of Local Compton-Thin AGN
Sérgio Sacani
 

Más de Sérgio Sacani (20)

Biogenic Sulfur Gases as Biosignatures on Temperate Sub-Neptune Waterworlds
Biogenic Sulfur Gases as Biosignatures on Temperate Sub-Neptune WaterworldsBiogenic Sulfur Gases as Biosignatures on Temperate Sub-Neptune Waterworlds
Biogenic Sulfur Gases as Biosignatures on Temperate Sub-Neptune Waterworlds
 
Asymmetry in the atmosphere of the ultra-hot Jupiter WASP-76 b
Asymmetry in the atmosphere of the ultra-hot Jupiter WASP-76 bAsymmetry in the atmosphere of the ultra-hot Jupiter WASP-76 b
Asymmetry in the atmosphere of the ultra-hot Jupiter WASP-76 b
 
Formation of low mass protostars and their circumstellar disks
Formation of low mass protostars and their circumstellar disksFormation of low mass protostars and their circumstellar disks
Formation of low mass protostars and their circumstellar disks
 
Nightside clouds and disequilibrium chemistry on the hot Jupiter WASP-43b
Nightside clouds and disequilibrium chemistry on the hot Jupiter WASP-43bNightside clouds and disequilibrium chemistry on the hot Jupiter WASP-43b
Nightside clouds and disequilibrium chemistry on the hot Jupiter WASP-43b
 
Discovery of an Accretion Streamer and a Slow Wide-angle Outflow around FUOri...
Discovery of an Accretion Streamer and a Slow Wide-angle Outflow around FUOri...Discovery of an Accretion Streamer and a Slow Wide-angle Outflow around FUOri...
Discovery of an Accretion Streamer and a Slow Wide-angle Outflow around FUOri...
 
Disentangling the origin of chemical differences using GHOST
Disentangling the origin of chemical differences using GHOSTDisentangling the origin of chemical differences using GHOST
Disentangling the origin of chemical differences using GHOST
 
All-domain Anomaly Resolution Office U.S. Department of Defense (U) Case: “Eg...
All-domain Anomaly Resolution Office U.S. Department of Defense (U) Case: “Eg...All-domain Anomaly Resolution Office U.S. Department of Defense (U) Case: “Eg...
All-domain Anomaly Resolution Office U.S. Department of Defense (U) Case: “Eg...
 
PossibleEoarcheanRecordsoftheGeomagneticFieldPreservedintheIsuaSupracrustalBe...
PossibleEoarcheanRecordsoftheGeomagneticFieldPreservedintheIsuaSupracrustalBe...PossibleEoarcheanRecordsoftheGeomagneticFieldPreservedintheIsuaSupracrustalBe...
PossibleEoarcheanRecordsoftheGeomagneticFieldPreservedintheIsuaSupracrustalBe...
 
Isotopic evidence of long-lived volcanism on Io
Isotopic evidence of long-lived volcanism on IoIsotopic evidence of long-lived volcanism on Io
Isotopic evidence of long-lived volcanism on Io
 
Hubble Asteroid Hunter III. Physical properties of newly found asteroids
Hubble Asteroid Hunter III. Physical properties of newly found asteroidsHubble Asteroid Hunter III. Physical properties of newly found asteroids
Hubble Asteroid Hunter III. Physical properties of newly found asteroids
 
Observational constraints on mergers creating magnetism in massive stars
Observational constraints on mergers creating magnetism in massive starsObservational constraints on mergers creating magnetism in massive stars
Observational constraints on mergers creating magnetism in massive stars
 
Observation of Gravitational Waves from the Coalescence of a 2.5–4.5 M⊙ Compa...
Observation of Gravitational Waves from the Coalescence of a 2.5–4.5 M⊙ Compa...Observation of Gravitational Waves from the Coalescence of a 2.5–4.5 M⊙ Compa...
Observation of Gravitational Waves from the Coalescence of a 2.5–4.5 M⊙ Compa...
 
The SAMI Galaxy Sur v ey: galaxy spin is more strongly correlated with stella...
The SAMI Galaxy Sur v ey: galaxy spin is more strongly correlated with stella...The SAMI Galaxy Sur v ey: galaxy spin is more strongly correlated with stella...
The SAMI Galaxy Sur v ey: galaxy spin is more strongly correlated with stella...
 
Is Betelgeuse Really Rotating? Synthetic ALMA Observations of Large-scale Con...
Is Betelgeuse Really Rotating? Synthetic ALMA Observations of Large-scale Con...Is Betelgeuse Really Rotating? Synthetic ALMA Observations of Large-scale Con...
Is Betelgeuse Really Rotating? Synthetic ALMA Observations of Large-scale Con...
 
First Direct Imaging of a Kelvin–Helmholtz Instability by PSP/WISPR
First Direct Imaging of a Kelvin–Helmholtz Instability by PSP/WISPRFirst Direct Imaging of a Kelvin–Helmholtz Instability by PSP/WISPR
First Direct Imaging of a Kelvin–Helmholtz Instability by PSP/WISPR
 
The Sun’s differential rotation is controlled by high- latitude baroclinicall...
The Sun’s differential rotation is controlled by high- latitude baroclinicall...The Sun’s differential rotation is controlled by high- latitude baroclinicall...
The Sun’s differential rotation is controlled by high- latitude baroclinicall...
 
Hydrogen Column Density Variability in a Sample of Local Compton-Thin AGN
Hydrogen Column Density Variability in a Sample of Local Compton-Thin AGNHydrogen Column Density Variability in a Sample of Local Compton-Thin AGN
Hydrogen Column Density Variability in a Sample of Local Compton-Thin AGN
 
Huygens - Exploring Titan A Mysterious World
Huygens - Exploring Titan A Mysterious WorldHuygens - Exploring Titan A Mysterious World
Huygens - Exploring Titan A Mysterious World
 
The Radcliffe Wave Of Milk Way is oscillating
The Radcliffe Wave Of Milk Way  is oscillatingThe Radcliffe Wave Of Milk Way  is oscillating
The Radcliffe Wave Of Milk Way is oscillating
 
Thermonuclear explosions on neutron stars reveal the speed of their jets
Thermonuclear explosions on neutron stars reveal the speed of their jetsThermonuclear explosions on neutron stars reveal the speed of their jets
Thermonuclear explosions on neutron stars reveal the speed of their jets
 

Último

dkNET Webinar "Texera: A Scalable Cloud Computing Platform for Sharing Data a...
dkNET Webinar "Texera: A Scalable Cloud Computing Platform for Sharing Data a...dkNET Webinar "Texera: A Scalable Cloud Computing Platform for Sharing Data a...
dkNET Webinar "Texera: A Scalable Cloud Computing Platform for Sharing Data a...
dkNET
 
Pests of mustard_Identification_Management_Dr.UPR.pdf
Pests of mustard_Identification_Management_Dr.UPR.pdfPests of mustard_Identification_Management_Dr.UPR.pdf
Pests of mustard_Identification_Management_Dr.UPR.pdf
PirithiRaju
 
Bacterial Identification and Classifications
Bacterial Identification and ClassificationsBacterial Identification and Classifications
Bacterial Identification and Classifications
Areesha Ahmad
 
Chemical Tests; flame test, positive and negative ions test Edexcel Internati...
Chemical Tests; flame test, positive and negative ions test Edexcel Internati...Chemical Tests; flame test, positive and negative ions test Edexcel Internati...
Chemical Tests; flame test, positive and negative ions test Edexcel Internati...
ssuser79fe74
 
Introduction,importance and scope of horticulture.pptx
Introduction,importance and scope of horticulture.pptxIntroduction,importance and scope of horticulture.pptx
Introduction,importance and scope of horticulture.pptx
Bhagirath Gogikar
 
Pests of cotton_Borer_Pests_Binomics_Dr.UPR.pdf
Pests of cotton_Borer_Pests_Binomics_Dr.UPR.pdfPests of cotton_Borer_Pests_Binomics_Dr.UPR.pdf
Pests of cotton_Borer_Pests_Binomics_Dr.UPR.pdf
PirithiRaju
 

Último (20)

Connaught Place, Delhi Call girls :8448380779 Model Escorts | 100% verified
Connaught Place, Delhi Call girls :8448380779 Model Escorts | 100% verifiedConnaught Place, Delhi Call girls :8448380779 Model Escorts | 100% verified
Connaught Place, Delhi Call girls :8448380779 Model Escorts | 100% verified
 
Proteomics: types, protein profiling steps etc.
Proteomics: types, protein profiling steps etc.Proteomics: types, protein profiling steps etc.
Proteomics: types, protein profiling steps etc.
 
dkNET Webinar "Texera: A Scalable Cloud Computing Platform for Sharing Data a...
dkNET Webinar "Texera: A Scalable Cloud Computing Platform for Sharing Data a...dkNET Webinar "Texera: A Scalable Cloud Computing Platform for Sharing Data a...
dkNET Webinar "Texera: A Scalable Cloud Computing Platform for Sharing Data a...
 
Pests of mustard_Identification_Management_Dr.UPR.pdf
Pests of mustard_Identification_Management_Dr.UPR.pdfPests of mustard_Identification_Management_Dr.UPR.pdf
Pests of mustard_Identification_Management_Dr.UPR.pdf
 
Vip profile Call Girls In Lonavala 9748763073 For Genuine Sex Service At Just...
Vip profile Call Girls In Lonavala 9748763073 For Genuine Sex Service At Just...Vip profile Call Girls In Lonavala 9748763073 For Genuine Sex Service At Just...
Vip profile Call Girls In Lonavala 9748763073 For Genuine Sex Service At Just...
 
Locating and isolating a gene, FISH, GISH, Chromosome walking and jumping, te...
Locating and isolating a gene, FISH, GISH, Chromosome walking and jumping, te...Locating and isolating a gene, FISH, GISH, Chromosome walking and jumping, te...
Locating and isolating a gene, FISH, GISH, Chromosome walking and jumping, te...
 
Call Girls Alandi Call Me 7737669865 Budget Friendly No Advance Booking
Call Girls Alandi Call Me 7737669865 Budget Friendly No Advance BookingCall Girls Alandi Call Me 7737669865 Budget Friendly No Advance Booking
Call Girls Alandi Call Me 7737669865 Budget Friendly No Advance Booking
 
Dopamine neurotransmitter determination using graphite sheet- graphene nano-s...
Dopamine neurotransmitter determination using graphite sheet- graphene nano-s...Dopamine neurotransmitter determination using graphite sheet- graphene nano-s...
Dopamine neurotransmitter determination using graphite sheet- graphene nano-s...
 
Clean In Place(CIP).pptx .
Clean In Place(CIP).pptx                 .Clean In Place(CIP).pptx                 .
Clean In Place(CIP).pptx .
 
Bacterial Identification and Classifications
Bacterial Identification and ClassificationsBacterial Identification and Classifications
Bacterial Identification and Classifications
 
Kochi ❤CALL GIRL 84099*07087 ❤CALL GIRLS IN Kochi ESCORT SERVICE❤CALL GIRL
Kochi ❤CALL GIRL 84099*07087 ❤CALL GIRLS IN Kochi ESCORT SERVICE❤CALL GIRLKochi ❤CALL GIRL 84099*07087 ❤CALL GIRLS IN Kochi ESCORT SERVICE❤CALL GIRL
Kochi ❤CALL GIRL 84099*07087 ❤CALL GIRLS IN Kochi ESCORT SERVICE❤CALL GIRL
 
CELL -Structural and Functional unit of life.pdf
CELL -Structural and Functional unit of life.pdfCELL -Structural and Functional unit of life.pdf
CELL -Structural and Functional unit of life.pdf
 
Chemical Tests; flame test, positive and negative ions test Edexcel Internati...
Chemical Tests; flame test, positive and negative ions test Edexcel Internati...Chemical Tests; flame test, positive and negative ions test Edexcel Internati...
Chemical Tests; flame test, positive and negative ions test Edexcel Internati...
 
Introduction,importance and scope of horticulture.pptx
Introduction,importance and scope of horticulture.pptxIntroduction,importance and scope of horticulture.pptx
Introduction,importance and scope of horticulture.pptx
 
Site Acceptance Test .
Site Acceptance Test                    .Site Acceptance Test                    .
Site Acceptance Test .
 
STS-UNIT 4 CLIMATE CHANGE POWERPOINT PRESENTATION
STS-UNIT 4 CLIMATE CHANGE POWERPOINT PRESENTATIONSTS-UNIT 4 CLIMATE CHANGE POWERPOINT PRESENTATION
STS-UNIT 4 CLIMATE CHANGE POWERPOINT PRESENTATION
 
GBSN - Microbiology (Unit 2)
GBSN - Microbiology (Unit 2)GBSN - Microbiology (Unit 2)
GBSN - Microbiology (Unit 2)
 
Factory Acceptance Test( FAT).pptx .
Factory Acceptance Test( FAT).pptx       .Factory Acceptance Test( FAT).pptx       .
Factory Acceptance Test( FAT).pptx .
 
COMPUTING ANTI-DERIVATIVES (Integration by SUBSTITUTION)
COMPUTING ANTI-DERIVATIVES(Integration by SUBSTITUTION)COMPUTING ANTI-DERIVATIVES(Integration by SUBSTITUTION)
COMPUTING ANTI-DERIVATIVES (Integration by SUBSTITUTION)
 
Pests of cotton_Borer_Pests_Binomics_Dr.UPR.pdf
Pests of cotton_Borer_Pests_Binomics_Dr.UPR.pdfPests of cotton_Borer_Pests_Binomics_Dr.UPR.pdf
Pests of cotton_Borer_Pests_Binomics_Dr.UPR.pdf
 

A single population of red globular clusters around the massive compact galaxy NGC 1277

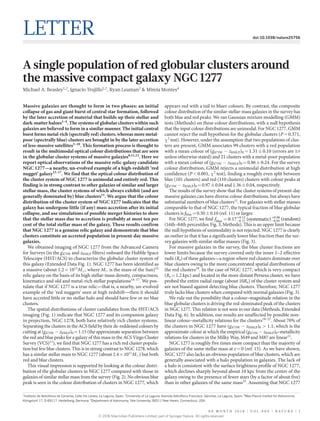
  • 1. 0 0 M o n t h 2 0 1 8 | V O L 0 0 0 | N A T U R E | 1 Letter doi:10.1038/nature25756 A single population of red globular clusters around the massive compact galaxy NGC 1277 Michael A. Beasley1,2 , Ignacio Trujillo1,2 , Ryan Leaman3 & Mireia Montes4 Massive galaxies are thought to form in two phases: an initial collapse of gas and giant burst of central star formation, followed by the later accretion of material that builds up their stellar and dark-matter haloes1–4 . The systems of globular clusters within such galaxies are believed to form in a similar manner. The initial central burst forms metal-rich (spectrally red) clusters, whereas more metal- poor (spectrally blue) clusters are brought in by the later accretion of less-massive satellites5–10 . This formation process is thought to result in the multimodal optical colour distributions that are seen in the globular cluster systems of massive galaxies8,11,12 . Here we report optical observations of the massive relic-galaxy candidate NGC 1277—a nearby, un-evolved example of a high-redshift ‘red nugget’ galaxy13–17 . We find that the optical colour distribution of the cluster system of NGC 1277 is unimodal and entirely red. This finding is in strong contrast to other galaxies of similar and larger stellar mass, the cluster systems of which always exhibit (and are generally dominated by) blue clusters11 . We argue that the colour distribution of the cluster system of NGC 1277 indicates that the galaxy has undergone little (if any) mass accretion after its initial collapse, and use simulations of possible merger histories to show that the stellar mass due to accretion is probably at most ten per cent of the total stellar mass of the galaxy. These results confirm that NGC 1277 is a genuine relic galaxy and demonstrate that blue clusters constitute an accreted population in present-day massive galaxies. We obtained imaging of NGC 1277 from the Advanced Camera for Surveys (in the g475W and z850LP filters) onboard the Hubble Space Telescope (HST/ACS) to characterize the globular cluster system of this galaxy (Extended Data Fig. 1). NGC 1277 has been identified as a massive (about 1.2 ×​ 1011 M, where M is the mass of the Sun)15 relic galaxy on the basis of its high stellar-mass density, compactness, ­kinematics and old and metal-rich stellar populations14–17 . We pos- tulate that if NGC 1277 is a true relic—that is, a nearby, un-evolved example of the ‘red nuggets’ seen at high redshift—then it should have accreted little or no stellar halo and should have few or no blue clusters. The spatial distributions of cluster candidates from the HST/ACS imaging (Fig. 1) indicate that NGC 1277 and its companion galaxy in projection, NGC 1278, both have relatively rich cluster systems. Separating the clusters in the ACS field by their de-reddened colours by cutting at (g475W −​ z850LP)0 =​ 1.15 (the approximate separation between the red and blue peaks for a galaxy of this mass in the ACS Virgo Cluster Survey (VCS)11 ), we find that NGC 1277 has a rich red cluster popula- tion but few blue clusters. This is in strong contrast to NGC 1278, which has a similar stellar mass to NGC 1277 (about 2.4 ×​ 1011 M) but both red and blue clusters. This visual impression is supported by looking at the colour distri- bution of the globular clusters in NGC 1277 compared with those in galaxies of similar stellar mass from the survey (Fig. 2). No obvious blue peak is seen in the colour distribution of clusters in NGC 1277, which appears red with a tail to bluer colours. By contrast, the composite colour distribution of the similar-stellar-mass galaxies in the survey has both blue and red peaks. We ran Gaussian mixture modelling (GMM) tests (Methods) on these colour distributions, with a null hypothesis that the input colour distributions are unimodal. For NGC 1277, GMM cannot reject the null hypothesis for the globular clusters (P =​ 0.371, χ2 test). However, under the assumption that two populations of clus- ters are present, GMM associates 99 clusters with a red population with a mean colour of (g475W −​ z850LP)0 =​ 1.31 ±​ 0.10 (errors are 1σ unless otherwise stated) and 21 clusters with a metal-poor population with a mean colour of (g475W −​ z850LP)0 =​ 0.86 ±​ 0.24. For the survey colour distribution, GMM rejects a unimodal distribution at high confidence (P <​ 0.001, χ2 test), finding a roughly even split between blue (101 clusters) and red (110 clusters) clusters with colour peaks at (g475W −​ z850LP)0 =​ 0.97 ±​ 0.04 and 1.36 ±​ 0.04, respectively. The results of the survey show that the cluster systems of present-day massive galaxies can have diverse colour distributions, but always have substantial numbers of blue clusters11 . For galaxies with stellar masses comparable to that of NGC 1277, the typical fraction of blue globular clusters is fblue =​ 0.50 ±​ 0.10 (ref. 11) or larger. For NGC 1277, we find = . − . + . − . + . f 0 17 (systematic)blue 0 17 0 12 0 05 0 06 (random) (16th–84th percentiles; Fig. 3, Methods). This is an upper limit because the null hypothesis of unimodality is not rejected. NGC 1277 is clearly an outlier in that it has a significantly lower blue fraction than the sur- vey galaxies with similar stellar masses (Fig. 3). For massive galaxies in the survey, the blue cluster fractions are lower limits because the survey covered only the inner 1–2 effective radii (Re) of these galaxies—a region where red clusters dominate over blue clusters owing to the more concentrated spatial distributions of the red clusters18 . In the case of NGC 1277, which is very compact (Re =​ 1.2 kpc) and located in the more distant Perseus cluster, we have probed the entire radial range (about 10Re) of the cluster system and are not biased against detecting blue clusters. Therefore, NGC 1277 truly lacks blue clusters when compared with normal galaxies (Fig. 3). We rule out the possibility that a colour–magnitude relation in the blue globular clusters is driving the red-dominated peak of the clusters in NGC 1277. This relation is not seen in our data (Methods, Extended Data Fig. 6). In addition, our results are unaffected by possible non- linear colour–metallicity relations for the clusters19–21 . About 70% of the clusters in NGC 1277 have (g475W −​ z850LP)0 >​ 1.1, which is the approximate colour at which the empirical (g475W −​ z850LP)0–­metallicity relations for clusters in the Milky Way, M49 and M87 are linear11 . NGC 1277 is roughly five times more compact than the majority of galaxies of the same stellar mass at z =​ 0 (ref. 15). As we have shown, NGC 1277 also lacks an obvious population of blue clusters, which are generally associated with a halo population in galaxies. The lack of a halo is consistent with the surface brightness profile of NGC 1277, which declines sharply beyond about 10 kpc from the centre of the ­galaxy owing to the presence of fewer stars (by a factor of about five) than in other galaxies of the same mass15 . Assuming that NGC 1277 1 Instituto de Astrofísica de Canarias, Calle Vía Láctea, La Laguna, Spain. 2 University of La Laguna, Avenida Astrofísico Francisco. Sánchez, La Laguna, Spain. 3 Max-Planck Institut für Astronomie, Königstuhl 17, D-69117, Heidelberg, Germany. 4 Department of Astronomy, Yale University, 06511 New Haven, Connecticut, USA. © 2018 Macmillan Publishers Limited, part of Springer Nature. All rights reserved.
  • 2. 2 | N A T U R E | V O L 0 0 0 | 0 0 m o n t h 2 0 1 8 LetterRESEARCH obeys the same size–stellar-mass relation as that of quiescent galaxies of the same stellar mass at z =​ 2, our findings suggest either that it has been stripped of its outer envelope and clusters and reduced in size, or that it failed to grow substantially in size and in the number of blue clusters since z =​ 2. We have explored both scenarios and favour the latter, that NGC 1277 is a genuine relic galaxy. The tidal radius of NGC 1277—at which stars and clusters become unbound from the galaxy—can be estimated analytically22 . In the extreme case that NGC 1277 is currently at pericentre within the Perseus cluster and that its clusters are on prograde orbits with respect to its orbit within Perseus, we calculate a lower limit for the tidal radius of 11 kpc. This lower limit corresponds to roughly 2Re–3Re in galaxies with similar stellar masses to that of NGC 1277 and is a radius at which at least 50% the clusters in the population should be blue11 . This result suggests that stripping has not affected the physical size or the ­cluster system of NGC 1277. Furthermore, the central stellar density of NGC 1277 is a factor of 2–3 higher than that of the inner 1 kpc of galaxies of similar stellar mass15 . Tidal stripping alone cannot increase the central stellar density22 , which implies that NGC 1277 was born both dense and compact. This raises the question of why NGC 1277 should have suffered severe tidal stripping while larger galaxies of ­similar mass in the same environment—such as NGC 1278—have not. Finally, there is no evidence for tidal tails or streams in the outer region of NGC 127715 , or for stripping in the stellar orbits, rotation curve or mass distribution of NGC 127717 . By contrast, NGC 1277 strongly resembles the low-redshift equiva- lent of higher-redshift compact systems. It lies on the size–stellar-mass relation of z =​ 2 galaxies15,17 and has a high central stellar density that is consistent with massive galaxies at these redshifts23 . Schwarzschild dynamical modelling24 shows that NGC 1277 is dominated by high-­ angular-momentum orbits, which implies that it formed in a largely dissipative process. Previous results17,24 suggest that NGC 1277 is essen- tially a massive disk with no classical, pressure-supported component. 49.94 49.96 49.98 50.00 Blue 10 kpc 49.94 49.96 49.98 50.00 Right ascension (º) 41.55 41.56 41.57 41.58 41.59 41.60 41.61 Declination(º) Red NGC 1278 NGC 1277 PGC 012430 2MASX J031952 PGC 012436 0 100 200 300 400 500 600 Numberofglobularclustersperarcmin2 Figure 1 | Spatial distribution of clusters in the HST/ACS field. North is up, east is to the right. Individual clusters are shown as red points. The locations of the named galaxies are indicated (grey dashes ellipsoids) by isophotes corresponding to 23 mag arcsec−2 in g475W. NGC 1277 is left of centre in the plots, with the neighbouring galaxy NGC 1278 located around 50 arcsec (17 kpc) to the southeast in projection. The red (left) and blue (right) clusters have been separated by taking a cut at (g475W −​ z850LP)0 =​ 1.15, typical of the peak separation between the red and blue clusters in galaxies of this stellar mass11 . The colour scale shows Gaussian kernel density maps of the globular clusters, constructed with a kernel with a width of 10 arcsec. Galaxies in the field can clearly be identified by the relative prevalence of clusters. NGC 1278 has both red and blue cluster populations, whereas NGC 1277 has a substantial population only of red clusters. 0.0 0.5 1.0 1.5 2.0 2.5 (g475W − z850LP)0 0 10 20 30 Numberofglobularclusters GMM ACS VCS NGC 1277 Figure 2 | The colour distribution of clusters in NGC 1277 compared with that of the composite cluster system. The colour distribution for NGC 1277 (orange histogram) is constructed over the full radial extent of its cluster system (11 kpc) and has been corrected for the contamination from NGC 1278 clusters; in projection, NGC 1278 is 17 kpc from NGC 1277. The composite cluster system (ACS VCS; green histogram) is constructed from four galaxies11 with stellar masses similar to that of NGC 1277 (roughly 1.2 ×​ 1011 M). The dashed curves indicate the Gaussian components of the cluster systems obtained from GMM28 ; the solid curves show the sum of these components. The composite cluster system is clearly bimodal, whereas NGC 1277 lacks an obvious blue peak. 108 109 1010 1011 1012 Stellar mass (M ) 0 0.2 0.4 0.6 0.8 1 Fractionofblueglobularclusters ACS VCS ACS VCS, binned NGC 1277 Figure 3 | The fraction of blue clusters in galaxies of a given stellar mass. Data for the survey galaxies (ACS VCS; open blue circles) come from ref. 11. NGC 1277 (filled orange circle) has a very small fraction of blue clusters when compared with other galaxies of similar stellar mass. For the binned survey data (filled blue circles), the 16th–84th percentiles of the distributions are shown as error bars; the blue fractions for the brightest survey galaxies are lower limits (indicated by the arrowheads) because only the central parts of the galaxy cluster systems were observed. The systematic uncertainty on the blue fraction for NGC 1277 is shown as the faint, dashed error bar (16th–84th percentiles); the random uncertainties from Monte Carlo simulations are smaller and shown as the solid error bar (16th–84th percentiles). The blue fraction for the clusters in NGC 1277 is an upper limit (indicated by the arrowhead) because the null hypothesis of unimodality cannot be rejected on the basis of observations. © 2018 Macmillan Publishers Limited, part of Springer Nature. All rights reserved.
  • 3. 0 0 M o n t h 2 0 1 8 | V O L 0 0 0 | N A T U R E | 3 Letter RESEARCH These kinematic properties are remarkably similar to those of the lensed ‘dead disk’ at z ≈​ 2.1 (ref. 25), which has similar stellar mass to NGC 1277 and is similarly compact ( = . − . + . R 1 73 kpce 0 27 0 34 ). In addition, the old, metal-rich stellar population of NGC 1277 is similar to that of other nearby relic-galaxy candidates17 , to that expected for passively evolving z =​ 2 red nuggets and to that predicted for the redshift evolu- tion of massive, compact systems in cosmological simulations26,27 . Finally, the fact that NGC 1277 is in a massive galaxy cluster is not unexpected, observationally or theoretically (Methods). Our findings for the cluster system of NGC 1277 provide further constraints on the evolutionary histories of relic galaxies. In accre- tion models for the formation of the blue cluster population in mas- sive galaxies, the location of the blue peak and the relative fraction of blue clusters provides insight into the total mass and the properties of accreted satellites of any given galaxy6,8,9 . We ran a series of analytic merger models based on our observations (Fig. 4, Methods, Extended Data Figs 7, 8) to constrain the accreted mass fraction of NGC 1277. From this modelling we find that the observed blue cluster fraction of NGC 1277 is characteristic of galaxies that have accreted about 10% or less of their stellar mass, with the rest of the stars having formed in situ. By contrast, mass-matched ACS VCS galaxies have accretion fractions of 50%–90%. We therefore find that the blue fraction of globular clus- ters approximately traces the total fraction of accreted mass in galaxies, and that NGC 1277 has accreted very little mass (if any) over its lifetime compared with other galaxies of similar stellar mass. We conclude that NGC 1277 provides a benchmark for the detailed study of the properties of massive galaxies that have not evolved since z =​ 2. High-resolution imaging of the cluster systems of more relic galaxies will enable the reconstruction of their mass-accretion histories. Online Content Methods, along with any additional Extended Data display items and Source Data, are available in the online version of the paper; references unique to these sections appear only in the online paper. received 5 July 2017; accepted 3 January 2018. Published online 12 March 2018. 1. Khochfar, S. & Silk, J. A simple model for the size evolution of elliptical galaxies. Astrophys. J. 648, L21–L24 (2006). 2. Oser, L., Naab, T., Ostriker, J. P. & Johansson, P. H. The cosmological size and velocity dispersion evolution of massive early-type galaxies. Astrophys. J. 744, 63 (2012). 3. Ceverino, D., Dekel, A., Tweed, D. & Primack, J. Early formation of massive, compact, spheroidal galaxies with classical profiles by violent disc instability or mergers. Mon. Not. R. Astron. Soc. 447, 3291–3310 (2015). 4. van Dokkum, P. G. et al. The growth of massive galaxies since z=​2. Astrophys. J. 709, 1018–1041 (2010). 5. Searle, L. & Zinn, R. Compositions of halo clusters and the formation of the galactic halo. Astrophys. J. 225, 357–379 (1978). 6. Côté, P., Marzke, R. O. & West, M. J. The formation of giant elliptical galaxies and their globular cluster systems. Astrophys. J. 501, 554–570 (1998). 7. Beasley, M. A., Baugh, C. M., Forbes, D. A., Sharples, R. M. & Frenk, C. S. On the formation of globular cluster systems in a hierarchical Universe. Mon. Not. R. Astron. Soc. 333, 383–399 (2002). 8. Tonini, C. The metallicity bimodality of globular cluster systems: a test of galaxy assembly and of the evolution of the galaxy mass-metallicity relation. Astrophys. J. 762, 39 (2013). 9. Leaman, R., VandenBerg, D. A. & Mendel, J. T. The bifurcated age–metallicity relation of Milky Way globular clusters and its implications for the accretion history of the galaxy. Mon. Not. R. Astron. Soc. 436, 122–135 (2013). 10. Kruijssen, J. M. D. Globular clusters as the relics of regular star formation in normal high-redshift galaxies. Mon. Not. R. Astron. Soc. 454, 1658–1686 (2015). 11. Peng, E. W. et al. The ACS Virgo Cluster Survey. IX. The color distributions of globular cluster systems in early-type galaxies. Astrophys. J. 639, 95–119 (2006). 12. Brodie, J. P. & Strader, J. Extragalactic globular clusters and galaxy formation. Annu. Rev. Astron. Astrophys. 44, 193–267 (2006). 13. Damjanov, I. et al. Red nuggets at z=​1.5. Compact passive galaxies and the formation of the Kormendy relation. Astrophys. J. 695, 101–115 (2009). 14. van den Bosch, R. C. E. et al. An over-massive black hole in the compact lenticular galaxy NGC 1277. Nature 491, 729–731 (2012). 15. Trujillo, I., Ferré-Mateu, A., Balcells, M., Vazdekis, A. & Sánchez-Blázquez, P. NGC 1277: a massive compact relic galaxy in the nearby Universe. Astrophys. J. 780, L20 (2014). 16. Martín-Navarro, I. et al. The initial mass function of a massive relic galaxy. Mon. Not. R. Astron. Soc. 451, 1081–1089 (2015). 17. Yıldırım, A. et al. The structural and dynamical properties of compact elliptical galaxies. Mon. Not. R. Astron. Soc. 468, 4216–4245 (2017). 18. Hargis, J. R. & Rhode, K. L. Globular cluster systems and their host galaxies: comparison of spatial distributions and colors. Astrophys. J. 796, 62 (2014). 19. Blakeslee, J. P. et al. Optical and infrared photometry of globular clusters in NGC 1399: evidence for color–metallicity nonlinearity. Astrophys. J. 746, 88 (2012). 20. Yoon, S.-J. et al. Nonlinear color-metallicity relations of globular clusters. III. On the discrepancy in metallicity between globular cluster systems and their parent elliptical galaxies. Astrophys. J. 743, 150 (2011). 21. Chies-Santos, A. L. et al. An optical/NIR survey of globular clusters in early-type galaxies. III. On the colour bimodality of globular cluster systems. Astron. Astrophys. 539, A54 (2012). 22. Read, J. I., Wilkinson, M. I., Evans, N. W., Gilmore, G. & Kleyna, J. T. The tidal stripping of satellites. Mon. Not. R. Astron. Soc. 366, 429–437 (2006). 23. Szomoru, D., Franx, M. & van Dokkum, P. G. Sizes and surface brightness profiles of quiescent galaxies at z=​2. Astrophys. J. 749, 121 (2012). 24. Yıldırım, A. et al. MRK 1216 and NGC 1277 – an orbit-based dynamical analysis of compact, high-velocity dispersion galaxies. Mon. Not. R. Astron. Soc. 452, 1792–1816 (2015). 25. Toft, S. et al. A massive, dead disk galaxy in the early Universe. Nature 546, 510–513 (2017). 26. Wellons, S. et al. The diverse evolutionary paths of simulated high-z massive, compact galaxies to z=​0. Mon. Not. R. Astron. Soc. 456, 1030–1048 (2016). 27. Furlong, M. et al. Size evolution of normal and compact galaxies in the EAGLE simulation. Mon. Not. R. Astron. Soc. 465, 722–738 (2017). 28. Muratov, A. L. & Gnedin, O. Y. Modeling the metallicity distribution of globular clusters. Astrophys. J. 718, 1266–1288 (2010). 102 Specificfrequency 101 100 10–1 10–3 10–2 10–1 100 NGC 1277 AVS VCS analogues Number ratio, Ninsitu/Nacc 101 102 103 1 0.8 0.6 Averageaccretionfraction 0.4 0.2 0 Figure 4 | Predictions from the simulated merger histories of NGC 1277. The total specific frequency—the number of clusters per unit galaxy luminosity—is shown against the number ratio of clusters formed in situ (Ninsitu) and those accreted (Nacc) in the simulated merger histories. The colours represent the average accretion fraction for each merger history. The constraints for NGC 1277 (black circle, with error bars indicating the 16th–84th percentiles, the arrow indicates that our measurements are an upper limit for the accreted fraction) that we determined from the observations are often satisfied in histories with low accretion fractions (about 10%). Merger histories with higher accretion fractions rarely lead to the colour ratio that we observed without overproducing the total number of clusters. By contrast, similar- mass galaxies in the ACS VCS (grey box) are well reproduced by merger histories with accretion fractions of around 50%. Acknowledgements We thank C. dalla Vecchia, J. Sanchez Almeida, C. Brook, S. Wellons, M. Fouesneau, A. Vazdekis, B. Dullo, J. Read and G. van de Ven for discussions, and J. Roman and A. Serrano Borlaf for assistance with image alignment. M.A.B. and I.T. acknowledge support from grant AYA2016-77237- C3-1-P from the Spanish Ministry of Economy and Competitiveness (MINECO). R.L. acknowledges funding from a Natural Sciences and Engineering Research Council of Canada PDF award. This research has made use of the NASA/ IPAC Extragalactic Database (NED), which is operated by the Jet Propulsion Laboratory, California Institute of Technology, under contract with NASA, and is based on observations made with the NASA/ESA Hubble Space Telescope, © 2018 Macmillan Publishers Limited, part of Springer Nature. All rights reserved.
  • 4. 4 | N A T U R E | V O L 0 0 0 | 0 0 m o n t h 2 0 1 8 LetterRESEARCH which is operated by the Association of Universities for Research in Astronomy under NASA contract NAS 5-26555. These observations are associated with programme GO-14215. Support for this work was provided by NASA through grant HST-GO-4215 from the Space Telescope Science Institute, operated by AURA under NASA contract NAS 5-26555 This research has made use of NASA’s Astrophysics Data System and extensive use of Python and Scipy. Author Contributions M.A.B. led the data processing and analysis, contributed to the interpretation and HST proposal preparation and produced Figs 1–3 and Extended Data Figs 2–6. I.T. contributed to the analysis and the interpretation, produced Extended Data Fig. 1 and lead the HST proposal preparation. R.L. generated and analysed the analytic merger models, produced Fig. 4 and Extended Data Figs 7, 8, and contributed to the analysis, interpretation and HST proposal preparation. M.M. contributed to the analysis, interpretation and HST proposal preparation. All authors contributed to the overall design of this project. Author Information Reprints and permissions information is available at www.nature.com/reprints. The authors declare no competing financial interests. Readers are welcome to comment on the online version of the paper. Publisher’s note: Springer Nature remains neutral with regard to jurisdictional claims in published maps and institutional affiliations. Correspondence and requests for materials should be addressed to M.A.B. (beasley@iac.es). Reviewer Information Nature thanks R. Abraham, K. Glazebrook and L. Spitler for their contribution to the peer review of this work. © 2018 Macmillan Publishers Limited, part of Springer Nature. All rights reserved.
  • 5. Letter RESEARCH Methods HST/ACS photometry. We obtained HST/ACS imaging of NGC 1277 in F475W (g475W) and F850LP (z850LP) (two orbits; GO programme ID, 14215; Extended Data Fig. 1). The total exposure time was 2,280 s (F475W) and 2,432 s (F850LP). We adopt a standard cosmological model with H0 =​ 70 km s−1  Mpc−1 , Ωm =​ 0.3 and ΩΛ =​ 0.7. The redshift assumed here for NGC 1277, z =​ 0.0169, corre- sponds to a galaxy distance of 73.3 Mpc ((m −​ M)0 =​ 34.33) and a spatial scale of 344 pc arcsec−1 . The HST data were pipeline-reduced, including correction for charge-transfer efficiency. We calculated zero-points for the AB magnitude system using the file header information. Aperture and point spread function (PSF) photometry was performed on the ACS imaging using Source Extractor29 with the add-on PSFEx30 . Our photometry was corrected for foreground extinction using line-of-sight red- dening estimates31 . Source Extractor was run in dual-image mode using un-sharp masks as detection images with photometry performed on the original images. We selected matched sources in the g475W and z850LP filters. Aperture magnitudes were measured using a range of aperture radii from 3 to 50 pixels. We applied aper- ture corrections to the three-pixel aperture magnitudes by correcting to ten-pixel (0.5 arcsec) apertures based on bright, isolated stars, and then correcting to infinity using the corrections tabulated in ref. 32. For artificial point-source tests, we used PSFEx to construct PSFs based on bright, isolated stars across the ACS field. Completeness tests. Completeness tests were performed by injecting ­artificial point sources into the images (using the PSFEx PSFs) and ­determining the recovery fraction as a function of magnitude with Source Extractor. In regions approximately 20 arcsec from bright galaxies, we are 100% complete to g475W =​ 27.3 mag and z850LP =​ 26.7 mag, with typical colour uncertainties of δ(g475W −​ z850LP)0 =​ 0.08 mag. We take this as a conservative photometric ­limiting magnitude. However, the completeness varies as a function of position and there- fore we also calculated photometric completeness by repeating our tests as a func- tion of position and magnitude across the field. In the very central regions (less than 1.5 arcsec; 0.5 kpc) of NGC 1277 and the neighbouring NGC 1278, we recover few clusters owing to the high surface brightness of the galaxies. Photometric errors were characterized by measuring the difference between the input and output magnitudes of 50,000 artificial point sources placed randomly across the images. To separate point sources (globular cluster candidates) from extended sources, we obtained the Source Extractor output flux_radius as a function of magni- tude for our artificial point sources. All real sources identified within the region defined by the artificial sources were regarded as cluster candidates. In total, to g475W =​ 27.3 mag, we detect 2,286 objects in the magnitude range consistent with being clusters. Colour–magnitude diagrams for all of the cluster candidates, and for cluster candidates around NGC 1278, NGC 1277 and an example background field are shown in Extended Data Fig. 2. Characterizing the colour distributions of the cluster systems. The spatial density distribution of candidate clusters (Fig. 1) was constructed directly from the photometry, after masking a small region (radius of 3 arcsec) centred on an uncatalogued dwarf located about 16 arcsec to the west of NGC 1277 (right ascension, 03 h 19 min 50.1 s; declination, +​41° 34′​ 22.10″​). A kernel-density-­ estimate map was constructed using the Python SciPy routine gaussian_kde with the Gaussian kernel determined using ‘Scott’s rule’33 . As expected, the globular clusters aggregate around known galaxies (Fig. 1). However, taking a colour cut at (g475W −​ z850LP)0 =​ 1.15—the approximate separation between the red and blue peaks for a galaxy the mass of NGC 1277 in ref. 11—NGC 1277 seems to ‘drop out’ of the blue-cluster-density map. This is in contrast with NGC 1278, which has both red and blue clusters. To create the colour distribution of NGC 1277 (Fig. 2), we had to take into account interloping clusters from the neighbouring NGC 1278 and contributions from intracluster clusters. We constructed a ‘master background’ by selecting five regions located at a distance from NGC 1278 equal to the separation between NGC 1277 and NGC 1278, and sufficiently distant from NGC 1277 so as to not overlap with its cluster system (which has an extent of about 11 kpc; Extended Data Fig. 3). The colour distribution of NGC 1277 clusters was built by selecting all ­cluster candidates within 11 kpc (about 10Re) and subtracting the master back- ground normalized to the area covered by the cluster system of NGC 1277. This process also removes intracluster clusters from the cluster system of NGC 1277. The colour distribution of this master background is shown in Extended Data Fig. 4. The composite cluster system in Fig. 2 was constructed by selecting galaxies from ref. 11 that bracket the stellar mass of NGC 1277, giving a mean stellar mass of about 1.1 ×​ 1011 M with a dispersion of 0.4 ×​ 1011 M. To compare with NGC 1277, we took a magnitude cut in the survey data at g475W =​ 23.98 ((m −​ M)0 =​ 31.01), which corresponds to our photometric depth. To explore the subpopulations in the colour distributions, we ran a GMM code28 on the binned colour distributions. For the visibly bimodal colour ­distribution of the survey composite, in the heteroscedastic (different variances between ­populations) case we obtain means of (g475W −​ z850LP)0 =​ 0.97 ±​ 0.04 and 1.36 ±​ 0.04 with Gaussian full-widths at half-maximum (FWHMs) of 0.12 ±​ 0.02 and 0.15 ±​ 0.02, respectively. 101 clusters are associated with the blue peak and 110 clusters with the red peak. A unimodal distribution is rejected at high confidence (P <​ 0.001, χ2 test). Similar results were obtained in the homoscedastic case. For NGC 1277, a unimodal distribution cannot be rejected because the null hypothesis has P =​ 0.371 confidence (χ2 test). Notwithstanding the possibility of unimodality, in the homoscedastic case for two populations we obtain means of (g475W −​ z850LP)0 =​ 0.86 ±​ 0.24 and 1.31 ±​ 0.10 each with a FWHM of 0.21 ±​ 0.08. 21 clusters are associated with the blue peak and 99 clusters with the red peak (Fig. 2). We define a blue fraction fblue =​ Nblue/(Nblue +​ Nred). We consider two sources of uncertainty for fblue. The uncertainty returned from GMM on the number of blue and red clusters we regard as our systematic ­uncertainty. In addition, a random uncertainty on fblue comes from our background subtraction. To quantify the true value of fblue and this uncertainty, we performed 1,000 Monte Carlo simulations in which we selected clusters randomly from our background regions (until the observed background level was reached), and varied the radial apertures of the background and NGC 1277 selection regions by ±​3 kpc (±​9 arcsec). From this we built new colour distributions and ran GMM on these colour distributions to obtain fblue (Extended Data Fig. 5). For the homoscedastic case, we obtain = . ± .− . + . f 0 18 (systematic) 0 04 (random)blue 0 17 0 12 (16th–84th percentiles); for the heteroscedastic case, we obtain = . − . + . − . + . f 0 17 (systematic) (random)blue 0 17 0 12 0 05 0 06 (16th–84th percentiles). We con- servatively take this latter value as the true blue fraction and its associated uncer- tainties. From the Monte Carlo simulations, we find / = . − . + . N N 0 21blue red 0 20 0 25 (16th–84th percentiles). We consider these as upper limits because the unimodal hypothesis cannot be rejected. As a sanity check, we compared the colour distributions of NGC 1277 with those of NGC 1278 (Extended Data Fig. 4). We remove contributions from intracluster clusters to the colour distribution of NGC 1278 by selecting ­clusters in a region away from bright galaxies (centred on a right ascension of 3 h 19 min 57.0 s and declination of +​41° 35′​ 30.0″​) over an area normalized to that of our cluster-selection region. NGC 1278 shows a prominent blue peak of clusters and a less prominent red peak. GMM (heteroscedastic case) locates peaks at (g475W −​ z850LP)0 =​ 0.95 ±​ 0.24 and 1.40 ±​ 0.10. These solutions are in excellent agreement with expectations11 . Surface-density profiles of the clusters. The surface-density profile of clusters (Extended Data Fig. 3) was constructed by counting globular clusters in semi-­ circular annuli and dividing by the area of each semi-annulus. We only counted clusters in the northern half of the galaxy—bisected by the major axis of the ­galaxy—to minimize contamination from the cluster system of NGC 1278. The inner two radial bins have been corrected on the basis of our completeness tests. The clusters closely follow the galaxy light15 . This is a characteristic property of red clusters in massive galaxies34 . By contrast, blue clusters generally have spatial distributions that are more extended than the galaxy stars18,34 . To define the radial extent of the system, and to locate the background level, we fitted the data with a modified Sérsic function35 : =      −            −           + / N R N b R R ( ) exp 1 bkgn n GC e e 1 with Ne the surface density of clusters at radius Re, n the Sérsic index and bkg the background value; bn is related to n as bn =​ 1.9992n −​ 0.3271. A Sérsic fit (with Ne =​ 7.8 ±​ 0.7 kpc−2 , Re =​ 2.6 ±​ 0.2 kpc, n =​ 0.9 ±​ 0.3, bkg =​ 0.27 ±​ 0.01 kpc−2 ) to the surface-density profile of the clusters (Extended Data Fig. 3), along with visual inspection, indicates that we reach the background level about 11 kpc from the centre of NGC 1277. We consider this the full radial extent of the NGC 1277 cluster system. Globular-cluster luminosity functions. We constructed cluster luminosity func- tions for the clusters in NGC 1277 to obtain an independent distance estimate to the galaxy using the turn-over of the luminosity function of the clusters as a ­standard candle36 , and to calculate the total size of the cluster system. Again, we selected only from the northern half of the galaxy to minimize interlopers from NGC 1278. We binned the g475W and z850LP magnitudes of the clusters as a function of magnitude (0.5-mag bins) and ran a version of a maximum likelihood code37 that fits for the mean (μ), FWHM (σ) and normalization of the distribution. The code takes into full account the background, incompleteness and photometric errors. In g475W (z850LP), we obtain μ =​ 26.95 ±​ 0.15 mag (25.80 ±​ 0.20 mag) and σ =​ 1.25 ±​ 0.15 (1.35 ±​ 0.20). Assuming ‘universal’ absolute magnitudes for the turn-over of the luminosity function of Mg475W =​ −​7.2 mag (Mz850LP =​ −​8.4 mag)38 , we obtain distance moduli of (m −​ M)0 =​ 34.15 ±​ 0.15 ((m −​ M)0 =​ 34.20 ±​ 0.20). These values are in excellent agreement with our adopted distance to NGC 1277. © 2018 Macmillan Publishers Limited, part of Springer Nature. All rights reserved.
  • 6. LetterRESEARCH Total cluster population of NGC 1277. We counted the total number of ­clusters brighter than the turn-over of the luminosity function of the clusters (26.95 ±​ 0.15 mag in g475W) that lie within 11 kpc of the galaxy centre within the northern half of NGC 1277. In so doing, we detect 92 ±​ 18 clusters to our photo­ metric limit, where the uncertainties come from the uncertainty of ±​0.2 mag in the peak position of the luminosity function. From this number we subtracted the expected contribution from NGC 1278 clusters (27 ±​ 8 clusters). Correcting for radial incompleteness, this number becomes 93.9 ±​ 23.0. We then doubled the total number of clusters to account for the undetected faint half of the lumi- nosity function, and doubled it again because we constructed the surface-density profile in the northern half of the galaxy. We arrive at a total cluster population of Ncluster =​ 376 ±​ 94. For MV  =​ −​20.87 (NASA Extragalactic Database, https:// ned.ipac.caltech.edu/), this cluster population yields a specific frequency of SN =​ 1.7 ±​ 0.4, consistent with galaxies in the stellar mass range of NGC 1277, which typically have SN ≈​ 2.0 (ref. 39). The blue tilt. The ‘blue tilt’ manifests as a colour–magnitude relation in the blue clusters whereby the brightest blue clusters become redder with ­increasing luminosity40–42 . This can make the colour distributions for the brightest ­clusters look unimodal. We investigated this issue by making colour distributions from the median bin values of our Monte Carlo simulations for the NGC 1277 ­clusters binned by magnitude (Extended Data Fig. 6). The mean colours of all three bins are very similar and predominantly red, with 〈​g475W −​ z850LP〉​ =​ 1.22 (22.0 <​ z850LP <​  24.0), 〈​g475W −​ z850LP〉​ =​  1.19 (24.0  <​ z850LP <​  25.0) and 〈​g475W −​ z850LP〉​ =​ 1.23 (25.0 <​ z850LP <​ 26.5). This behaviour is not expected if a blue tilt were driving the observed colour distributions. The majority of the clusters with (g475W −​ z850LP)0 ≤​ 1.1 are consistent with the background residuals. However, a few of the brightest clusters (eight) are above the background. These ‘blue’ clusters constitute a small fraction of the overall cluster population. The environments of relic galaxies. NGC 1277 lies 3.8 arcmin (roughly 80 kpc) in projection to the north of the central massive galaxy NGC 1275 in the Perseus cluster of galaxies. However, it is not unexpected that such a relic galaxy should be found in such a dense environment. Observational studies that have looked specifically at the preferred environ- ments of massive compact galaxies in the nearby Universe find that the fraction of present-day compact, quiescent galaxies with stellar masses of more than about 3 ×​ 1010 M that lie in low-density environments is approximately 4.4%43 . The cor- responding fraction in nearby galaxy clusters is about 22%44 . Similar dependencies on environmental density have been obtained from different samples45,46 . Of the 16 best-studied nearby, massive, compact galaxies (including NGC 1277), 7 are in clusters, 4 in groups and 5 in isolated systems17 . On the theoretical side, dark-matter-only simulations have been used47 to explore the clustering properties of massive, compact galaxies, and reveal that the fraction of massive, compact galaxies is about five times larger in the most massive structures than in low-mass dark-matter haloes. Similarly, semi-analytic models have been used45 to explore the environments of compact, massive galaxies, and reveal that these galaxies represent about 0.04% of the total galaxy ­population, but about 0.18% of the galaxy population in clusters. In addition, compact ­galaxies preferentially lie in the centres of clusters (the inner 0.2 virial radii, which corre- sponds to 400 kpc in Perseus), whereas non-compact galaxies of the same mass have mean cluster-centric radii of around 0.4 virial radii45 . The evolution of ­massive compact systems at z =​ 2 has previously been explored26 in cosmological, hydro­dynamical simulations: of a sample of 35 galaxies, roughly 30% remained ­sufficiently undisturbed to be defined as relics at z =​ 0. Of these relics, about 20% survive as satellites in galaxy clusters. In summary, although massive, compact, ‘relic’ galaxies are rare in the nearby Universe (with space densities of 10−5  Mpc−3 )48,49 , they are expected to be prefer- entially found in the most massive structures, such as the Perseus cluster of galaxies. Accretion models for cluster formation. To obtain a quantitative understanding of the link between the colour distributions of clusters and the accretion history of a galaxy, we constructed a library of analytic merger histories for NGC 1277. We ran 1.5 ×​ 106 model realizations of NGC 1277 in which we reconstruct its total present-day stellar mass (M* ) by assuming that it had accreted some fraction of its stellar mass 0 ≤​ facc ≤​ 1. To test rare, or non-cosmological merger histories, for each realization we draw satellite galaxies from a sub-halo dark-matter mass function with a randomly selected slope −​1 ≤​ α ≤​ 0. These satellites are assigned stellar mass stochastically via empirical abundance-matching relations50 and their stellar mass is added to the in situ stellar mass of NGC 1277 (Minsitu =​ (1 −​ facc)M*,obs) until the observed total present-day stellar mass of NGC 1277 (M*,obs) is reached for that merger-history realization. This necessitates a dynamic sub-halo mass-function cut-off, because the maximum accreted sub-halo at any point cannot be more than the total accreted mass for that trial and must be less than the in situ mass. This ensures a working definition of the primary being most massive and, importantly, preserves an accretion fraction of facc and total mass of M*,obs at the end of each trial. The stellar mass of each sub-halo sets its metallicity9,51 (and the metallicity of the clusters that are accreted with it), and the dark-matter mass of the satellite provides the specific frequency of clusters for that satellite39,52 (with stochastic sampling of the scatter in all of the relations). The same relations are used to construct the ­cluster population of the in situ component of NGC 1277 in every realization. Finally, the cluster metallicities are converted to g475W −​ z850LP colours11 . This exercise is qualitatively similar to that used previously8 with the added benefit that we allow for a flexible slope of the sub-halo mass function, rather than constraining it on the basis of average accretion histories in cold dark matter simulations. This addition allows us to explore how the cluster colour distribu- tions and galaxy stellar mass could arise in potentially rare scenarios with either very low or high numbers of mergers or consecutive extreme-mass-ratio mergers. Although simple, these models recover the ensemble properties of the observed cluster colour and number distributions for galaxies of the mass of NGC 1277. Extended Data Fig. 7 shows the accreted fraction of each realization of NGC 1277 (with each dot representing one possible merger history that reproduces the total mass of NGC 1277) versus the ratio of the number of in situ to accreted (red to blue) ­clusters for NGC 1277 in that realization. We have conservatively used the ­minimum Ninsitu/Nacc value allowed within the error bars (Ninsitu/Nacc =​ 2.17) rather than Ninsitu/Nacc =​ Nred/Nblue =​ 99/21 =​ 4.76. The observed colour ratio of the ­clusters in NGC 1277 is characteristic of galaxies that have undergone merger histories resulting in the host accreting 12% of the present-day stellar mass. In comparison, galaxies of comparable mass to NGC 1277 in the ACS VCS ­sample have observed colour distributions (Nred/Nblue ≤​ 1) typical of having accreted 50%–90% of their stellar mass. A very small percentage (about 0.02%) of these high-facc models can produce cluster colour ratios similar to that for NGC 1277. However, Fig. 4 and Extended Data Fig. 8 show that these high-facc assembly histories tend to over-predict the total number of clusters per unit mass (SN ≥​ 2) and to result in systems with dark-matter masses of 1014 M or more, which is ruled out for NGC 1277 by dynamical modelling17,24 . Extended Data Fig. 8 illustrates that the typical merger histories in our models that successfully reproduce the SN and colour distribution of NGC 1277 tend to have accreted only facc =​ 12% ±​ 8% of their stellar mass, to have had a merger event with a mass ratio of at most 1:10 and to reside in under-massive dark-matter haloes (M* /MDM ≈​ 0.06) when compared with galaxies of the same stellar mass as NGC 1277. These models support the idea that NGC 1277 has not accreted substantial amounts of dark-matter-rich sub- haloes, leaving it deficient both in dark-matter mass and in blue, accreted clusters. Sample size. No statistical methods were used to predetermine sample size. Code availability. The photometry software Source Extractor and PSFEx are publicly available at https://www.astromatic.net/software/sextractor and https:// www.astromatic.net/software/psfex. The GMM code is publicly available at http://www-personal.umich.edu/~​ognedin/gmm/. A version of the globular cluster luminosity function fitting code is available on request. The code used for the ­modelling of the accretion histories of NGC 1277 will be made available in the future. Data availability. The HST data used was obtained under GO programmes 14215 and 10546 and are publicly available at https://archive.stsci.edu/proposal_search. php?id=​14215&mission=​hst and https://archive.stsci.edu/proposal_search. php?id=​10546&mission=​hst. Data products such as the point-source photometry and results of the Monte Carlo simulations are available from the corresponding author on request. 29. Bertin, E. & Arnout, S. SExtractor: software for source extraction. Astron. Astrophys. Suppl. Ser. 117, 393–404 (1996). 30. Bertin, E. Automated morphometry with SExtractor and PSFEx. ASP Conf. Ser. 442, 435–438 (2011). 31. Schlafly, E. F. & Finkbeiner, D. P. Measuring reddening with Sloan Digital Sky Survey stellar spectra and recalibrating SFD. Astrophys. J. 737, 103 (2011). 32. Bohlin, R. C. Perfecting the photometric calibration of the ACS CCD cameras. Astron. J. 152, 60 (2016). 33. Scott, D. W. Multivariate Density Estimation: Theory, Practice, and Visualization 7–11 (John Wiley & Sons, 1992). 34. Pota, V. et al. The SLUGGS survey: kinematics for over 2500 globular clusters in 12 early-type galaxies. Mon. Not. R. Astron. Soc. 428, 389–420 (2013). 35. Sérsic, J. L. The influence of the atmospheric and instrumental dispersion on the brightness distribution in a galaxy. Bol. Asoc. Argentina Astron. 6, 41–43 (1963). 36. Ferrarese, L. et al. A database of Cepheid distance moduli and tip of the red giant branch, globular cluster luminosity function, planetary nebula luminosity function, and surface brightness fluctuation data useful for distance determinations. Astrophys. J. Suppl. Ser. 128, 431–459 (2000). 37. Secker, J. & Harris, W. E. A maximum likelihood analysis of globular cluster luminosity distributions in the Virgo ellipticals. Astron. J. 105, 1358–1368 (1993). 38. Jordán, A. et al. The ACS Virgo Cluster Survey. XII. The luminosity function of globular clusters in early-type galaxies. Astrophys. J. Suppl. Ser. 171, 101–145 (2007). © 2018 Macmillan Publishers Limited, part of Springer Nature. All rights reserved.
  • 7. Letter RESEARCH 39. Peng, E. W. et al. The ACS Virgo Cluster Survey. XV. The formation efficiencies of globular clusters in early-type galaxies: the effects of mass and environment. Astrophys. J. 681, 197–224 (2008). 40. Harris, W. E. et al. Globular cluster systems in brightest cluster galaxies. bimodal metallicity distributions and the nature of the high-luminosity clusters. Astrophys. J. 636, 90–114 (2006). 41. Strader, J., Brodie, J. P., Spitler, L. & Beasley, M. A. Globular clusters in Virgo ellipticals: unexpected results for giants and dwarfs from advanced camera for surveys imaging. Astron. J. 132, 2333–2345 (2006). 42. Mieske, S. et al. The ACS Fornax Cluster Survey. IX. The color–magnitude relation of globular cluster systems. Astrophys. J. 710, 1672–1682 (2010). 43. Poggianti, B. M. et al. Superdense galaxies and the mass-size relation at low redshift. Astrophys. J. 762, 77 (2013). 44. Valentinuzzi, T. et al. Superdense massive galaxies in wings local clusters. Astrophys. J. 712, 226–237 (2010). 45. Peralta de Arriba, L., Quilis, V., Trujillo, I., Cebrián, M. & Balcells, M. Massive relic galaxies prefer dense environments. Mon. Not. R. Astron. Soc. 461, 156–163 (2016). 46. Damjanov, I., Zahid, H. J., Geller, M. J. & Hwang, H. S. The environment of massive quiescent compact galaxies at 0.1<​z<​0.4 in the COSMOS field. Astrophys. J. 815, 104 (2015). 47. Stringer, M., Trujillo, I., Dalla Vecchia, C. & Martinez-Valpuesta, I. A cosmological context for compact massive galaxies. Mon. Not. R. Astron. Soc. 449, 2396–2404 (2015). 48. Trujillo, I. et al. Superdense Massive Galaxies in the Nearby Universe. Astrophys. J. 692, L118–L122 (2009). 49. Taylor, E. N. et al. On the dearth of compact, massive, red sequence galaxies in the local Universe. Astrophys. J. 720, 723–741 (2010). 50. Leauthaud, A. et al. New constraints on the evolution of the stellar- to-dark matter connection: a combined analysis of galaxy-galaxy lensing, clustering, and stellar mass functions from z=​0.2 to z=​1. Astrophys. J. 744, 159 (2012). 51. Kirby, E. N. et al. The Universal stellar mass-stellar metallicity relation for dwarf galaxies. Astrophys. J. 779, 102 (2013). 52. Georgiev, I. Y., Puzia, T. H., Goudfrooij, P. & Hilker, M. Globular cluster systems in nearby dwarf galaxies – III. Formation efficiencies of old globular clusters. Mon. Not. R. Astron. Soc. 406, 1967–1984 (2010). © 2018 Macmillan Publishers Limited, part of Springer Nature. All rights reserved.
  • 8. LetterRESEARCH Extended Data Figure 1 | Colour-composite HST image of the massive relic galaxy NGC 1277. The image was constructed from g475W +​ r625W +​ z850LP bands. The g475W and z850LP imaging was obtained with the HST programme GO-14215 and the r625W imaging with the programme GO-10546. NGC 1277 is the best example found so far in the nearby Universe with characteristics equivalent to those of the first massive galaxies to form more than 11 Gyr ago. The image is oriented with north pointing up and east to the left. The field of view is 42.2 arcsec ×​ 30.6 arcsec, corresponding to a physical scale of 14.5 kpc ×​ 10.5 kpc at our adopted distance of 73.3 Mpc to the galaxy. The images have been scaled with logarithmic intensity to highlight the various structures in the galaxy. The vast majority of point sources surrounding NGC 1277 are clusters associated with the galaxy. Two example clusters have been marked with ticks. © 2018 Macmillan Publishers Limited, part of Springer Nature. All rights reserved.
  • 9. Letter RESEARCH Extended Data Figure 2 | Colour–magnitude diagrams of cluster candidates. From left to right, the plots show all point sources in the field, NGC 1278 clusters, raw (not background-corrected) NGC 1277 clusters and an example background field. Also shown are the photometric uncertainties (1σ; blue crosses) based on our artificial point-source test, and the 100% completeness limit (red dashed lines; see Methods). © 2018 Macmillan Publishers Limited, part of Springer Nature. All rights reserved.
  • 10. LetterRESEARCH Extended Data Figure 3 | Surface-density profile of NGC 1277 clusters. The figure shows the raw (blue circles) and completeness-corrected (orange stars) counts. Uncertainties are 16th–84th percentiles. Within the range 3–10 kpc, the clusters closely follow the light distribution of the galaxy. This is typical of red clusters. The background is determined from the Sérsic function fits (which include a background term; green line) to the cluster data and defines the radial extent of the cluster system, which ends at 11 kpc (about 10Re). The stellar-mass density profile15 (red line) has arbitrary normalization. GCs, globular clusters. © 2018 Macmillan Publishers Limited, part of Springer Nature. All rights reserved.
  • 11. Letter RESEARCH Extended Data Figure 4 | Colour distribution of clusters in NGC 1277 compared with that for the companion galaxy in projection NGC 1278. The figure shows that NGC 1278 (blue) has a strong peak of blue clusters that is not seen in NGC 1277 (orange). The expected background contamination of NGC 1278 clusters and of intracluster clusters to the cluster system of NGC 1277, with which we have corrected the colour distribution of NGC 1277, is also shown (green). The predominantly blue colours of the contaminating clusters is expected because they correspond to the outskirts of NGC 1278 (see Fig. 1). Solid curves are two-Gaussian solutions from the GMM code28 ; dashed curves are individual Gaussian components from GMM. A single Gaussian fit to the NGC 1277 clusters with GMM gives 〈​g475W −​ z850LP〉​ =​ 1.22 ±​ 0.03, with a FWHM of 0.28 ±​ 0.02. © 2018 Macmillan Publishers Limited, part of Springer Nature. All rights reserved.
  • 12. LetterRESEARCH Extended Data Figure 5 | Distribution of the blue cluster fraction from Monte Carlo simulations. The vertical dashed lines indicate the medians of the distributions and the vertical dotted lines show the 16th and 84th percentiles. © 2018 Macmillan Publishers Limited, part of Springer Nature. All rights reserved.
  • 13. Letter RESEARCH Extended Data Figure 6 | Colour distributions of NGC 1277 and NGC 1278 in three magnitude bins. The bin values for the NGC 1277 clusters represent the medians of the bin values from Monte Carlo simulations. Uncertainties are the 16th–84th percentiles of the distributions. © 2018 Macmillan Publishers Limited, part of Springer Nature. All rights reserved.
  • 14. LetterRESEARCH Extended Data Figure 7 | Accretion models for the build-up of the NGC 1277 cluster system. Each point is a single merger history for NGC 1277, characterized by the total fraction of accreted stellar mass versus the number ratio of in situ to accreted clusters for that realization. The observed ratio for NGC 1277 is indicated by the cyan dashed line (Nblue/Nred =​ 0.21) and is characteristic of galaxies with merger histories leading to facc ≈​ 10% (orange). The cyan arrow indicates that the in situ fraction is a lower limit. Galaxies with comparable stellar mass to NGC 1277 in the ACS VCS tend to have equal numbers of blue and red clusters, which is more common for accretion histories of facc ≈​ 50%–90% (green). The extremely rare (about 0.02%) high-mass-accretion realizations, which produce the observed blue/red fraction in NGC 1277, are shown in magenta. Contours represent 10%, 25%, 50%, 75%, 90% and 99% of the maximum of the two-dimensional distribution. © 2018 Macmillan Publishers Limited, part of Springer Nature. All rights reserved.
  • 15. Letter RESEARCH Extended Data Figure 8 | Predictions of galaxy properties from accretion models. From left to right, the black lines show the accretion fraction, the number of mergers, the maximum mass ratio of the merger and the final ratio of stellar to dark-matter mass for all of the merger realizations. The magenta distributions (top) show the high-facc merger histories that satisfy the constraint on the colour ratio of the clusters (which happens rarely; see, for example, Extended Data Fig. 7). The cyan distributions (bottom) show the low-facc merger histories that satisfy the observed colour ratio of the clusters and the SN constraints. The high- accretion-fraction models (magenta) also predict a dark-matter-halo mass for NGC 1277 that is larger than the observational constraints17 (indicated by the arrow in the bottom right panel). The vertical dashed lines represent the median of the distributions and the vertical dotted lines show the 16th and 84th percentiles. © 2018 Macmillan Publishers Limited, part of Springer Nature. All rights reserved.