Detection of solar_like_oscillations_in_relies_of_the_milk_way_asteroseismology_of_k_giants_in_m4_using_data_from_nasa_k2_mission

Asteroseismic constraints on K giants make it possible to infer radii, masses and ages of tens of thousands of field stars. Tests against independent estimates of these properties are however scarce, especially in the metal-poor regime. Here, we report the detection of solar-like oscillations in 8 stars belonging to the red-giant branch and red-horizontal branch of the globular cluster M4. The detections were made in photometric observations from the K2 Mission during its Campaign 2. Making use of independent constraints on the distance, we estimate masses of the 8 stars by utilising different combinations of seismic and non-seismic inputs. When introducing a correction to the Δν scaling relation as suggested by stellar models, for RGB stars we find excellent agreement with the expected masses from isochrone fitting, and with a distance modulus derived using independent methods. The offset with respect to independent masses is lower, or comparable with, the uncertainties on the average RGB mass (4 − 10%, depending on the combination of constraints used). Our results lend confidence to asteroseismic masses in the metal poor regime. We note that a larger sample will be needed to allow more stringent tests to be made of systematic uncertainties in all the observables (both seismic and non-seismic), and to explore the properties of RHB stars, and of different populations in the cluster.
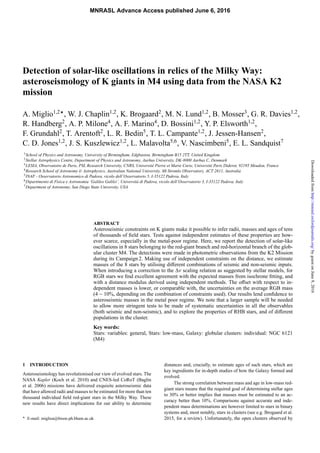
![Figure 1. Colour magnitude diagram of M4 stars based on the dataset de-
scribed in D’Antona et al. (2009). Magnitudes and colour were corrected
for differential reddening following Milone et al. (2012). The solid line rep-
resents a isochrone (from BaSTI, see Sec. 3.1.1 for details) fit to the CMD.
The large coloured open circles mark the stars with detected solar-like os-
cillations (the corresponding oscillation spectra are plotted in Fig. 2).
the Kepler space telescope (during its nominal mission) and by
CoRoT explored the metal-rich regime only, and did not provide
a test of the metal-poor population.
Globular clusters are the oldest stellar systems for which it is
possible to make reliable age estimates, and are hence benchmarks
to test other age determinations. Previous efforts to detect solar-
like oscillations in globular clusters have been made, but either no
oscillations were detected (Frandsen et al. 2007), or only marginal
detections were made (Stello & Gilliland 2009). However, K2—the
re-purposed Kepler mission (Howell et al. 2014)—has now begun
a survey of the ecliptic plane, which contains bright clusters includ-
ing the globular cluster M4. In this Letter we report the detection of
solar-like oscillations in K2 data of K giants belonging to M4, and
compare the measured global oscillation properties against those
expected from well-constrained, independent distance and mass es-
timates.
2 M4 DATA REDUCTION AND ANALYSIS
M4 was observed in K2 Campaign 2 for a total of 78.8 days. A frac-
tion of the cluster’s total angular area on the celestial sphere was
covered by sixteen 50-by-50 pixel superstamps. Masks for indi-
vidual targets within the superstamps were defined using the K2P2
(K2-Pixel-Photometry; Lund et al. 2015) pipeline. Each mask was
constructed from a summed image (over time) that allowed for the
apparent motion of the stars on the CCD due to the drift of the
spacecraft (Howell et al. 2014). Time-dependent positions of stars
on the CCD were estimated from the 2D cross-correlation of a
given superstamp, instead of estimated centroids for individual tar-
gets. A set of unsupervised machine learning techniques was then
applied to define the final masks, from which lightcurves were then
produced.
Changes in measured flux due to spacecraft roll were corrected
by utilising the strong correlation of those changes with the stellar
position on the CCD, using procedures similar to those described in
Vanderburg & Johnson (2014). The resulting, corrected lightcurves
5 10 15 20 25
0
1e+05
2e+05 S1
0 1 2
5 10 15 20 25 30 35 40
0
2e+04
4e+04
6e+04
8e+04
S2
0 2
5 10 15 20 25 30 35 40
0
5e+04
1e+05
S3
0 2
5 10 15 20 25 30 35 40 45
0
2e+04
4e+04
6e+04
8e+04
S4
0 2
10 20 30 40 50 60 70 80
0
1e+04
2e+04
3e+04
S5
Powerspectraldensity[ppm2
/Hz] 0 2 4
10 20 30 40 50 60 70 80
0
1e+04
2e+04
3e+04
S6
0 5
10 20 30 40 50 60 70 80
0
1e+04
2e+04
3e+04
S7
0 5
20 30 40 50 60 70 80 90 100
Frequency [ Hz]
0
5e+03
1e+04
2e+04
2e+04
S8
0 5
Figure 2. Solar-like oscillation spectra of eight K giants observed by K2.
The bottom star is in the RHB. Stars (from top to bottom) are ordered by
increasing νmax. Vertical lines show the position of radial (dashed lines)
and quadrupole (dash-dotted lines) oscillation frequencies as expected by
the pattern of oscillation modes in red-giant stars described in Mosser et al.
(2011). The expected granulation power and the combined granulation and
oscillation power is represented by dashed and solid thick lines. The in-
sets show the power spectrum of the power spectrum (PSPS) of each star,
computed from the region around νmax. In each PSPS the prominent peak at
Δν/2 (vertical gray line) is the detected signature of the near-regular spacing
of oscillation peaks in the frequency spectrum.
were then cleaned for artifacts using the KASOC filter (Handberg
& Lund 2014); time scales of τlong = 1 days and τshort = 0.25 days
were adopted for the median filters. We refer to Handberg & Lund
(2014) for additional details on the KASOC filter.
Among the sources identified by the K2P2
pipeline we se-
lected those that could be unambiguously identified as K giants
from the D’Antona et al. (2009) catalogue and the Marino et al.
(2008, 2011) membership studies. Moreover, we retained only stars
with V < 14 and B − I > 1.7, i.e. we avoided RR Lyrae pulsators,
blue-horizontal-branch stars, and stars that would be too faint to
have detectable oscillations (see Fig. 1).
We then searched the frequency-power spectra of the chosen
set of 28 lightcurves for evidence of solar-like oscillations using
byguestonJune9,2016http://mnrasl.oxfordjournals.org/Downloadedfrom](data:image/gif;base64,R0lGODlhAQABAIAAAAAAAP///yH5BAEAAAAALAAAAAABAAEAAAIBRAA7)
Recomendados
Recomendados
Más contenido relacionado
La actualidad más candente
La actualidad más candente (20)
Similar a Detection of solar_like_oscillations_in_relies_of_the_milk_way_asteroseismology_of_k_giants_in_m4_using_data_from_nasa_k2_mission
Similar a Detection of solar_like_oscillations_in_relies_of_the_milk_way_asteroseismology_of_k_giants_in_m4_using_data_from_nasa_k2_mission (20)
Más de Sérgio Sacani
Más de Sérgio Sacani (20)
Último
Último (20)
Detection of solar_like_oscillations_in_relies_of_the_milk_way_asteroseismology_of_k_giants_in_m4_using_data_from_nasa_k2_mission
- 1. Detection of solar-like oscillations in relics of the Milky Way: asteroseismology of K giants in M4 using data from the NASA K2 mission A. Miglio1,2 , W. J. Chaplin1,2 , K. Brogaard2 , M. N. Lund1,2 , B. Mosser3 , G. R. Davies1,2 , R. Handberg2 , A. P. Milone4 , A. F. Marino4 , D. Bossini1,2 , Y. P. Elsworth1,2 , F. Grundahl2 , T. Arentoft2 , L. R. Bedin5 , T. L. Campante1,2 , J. Jessen-Hansen2 , C. D. Jones1,2 , J. S. Kuszlewicz1,2 , L. Malavolta5,6 , V. Nascimbeni5 , E. L. Sandquist7 1School of Physics and Astronomy, University of Birmingham, Edgbaston, Birmingham B15 2TT, United Kingdom 2Stellar Astrophysics Centre, Department of Physics and Astronomy, Aarhus University, DK-8000 Aarhus C, Denmark 3LESIA, Observatoire de Paris, PSL Research University, CNRS, Université Pierre et Marie Curie, Université Paris Diderot, 92195 Meudon, France 4Research School of Astronomy & Astrophysics, Australian National University, Mt Stromlo Observatory, ACT 2611, Australia 5INAF - Osservatorio Astronomico di Padova, vicolo dell’Osservatorio 5, I-35122 Padova, Italy 6Dipartimento di Fisica e Astronomia ’Galileo Galilei’, Universitá di Padova, vicolo dell’Osservatorio 3, I-35122 Padova, Italy 7Department of Astronomy, San Diego State University, USA ABSTRACT Asteroseismic constraints on K giants make it possible to infer radii, masses and ages of tens of thousands of field stars. Tests against independent estimates of these properties are how- ever scarce, especially in the metal-poor regime. Here, we report the detection of solar-like oscillations in 8 stars belonging to the red-giant branch and red-horizontal branch of the glob- ular cluster M4. The detections were made in photometric observations from the K2 Mission during its Campaign 2. Making use of independent constraints on the distance, we estimate masses of the 8 stars by utilising different combinations of seismic and non-seismic inputs. When introducing a correction to the Δν scaling relation as suggested by stellar models, for RGB stars we find excellent agreement with the expected masses from isochrone fitting, and with a distance modulus derived using independent methods. The offset with respect to in- dependent masses is lower, or comparable with, the uncertainties on the average RGB mass (4 − 10%, depending on the combination of constraints used). Our results lend confidence to asteroseismic masses in the metal poor regime. We note that a larger sample will be needed to allow more stringent tests to be made of systematic uncertainties in all the observables (both seismic and non-seismic), and to explore the properties of RHB stars, and of different populations in the cluster. Key words: Stars: variables: general, Stars: low-mass, Galaxy: globular clusters: individual: NGC 6121 (M4) 1 INTRODUCTION Asteroseismology has revolutionised our view of evolved stars. The NASA Kepler (Koch et al. 2010) and CNES-led CoRoT (Baglin et al. 2006) missions have delivered exquisite asteroseismic data that have allowed radii and masses to be estimated for more than ten thousand individual field red-giant stars in the Milky Way. These new results have direct implications for our ability to determine E-mail: miglioa@bison.ph.bham.ac.uk distances and, crucially, to estimate ages of such stars, which are key ingredients for in-depth studies of how the Galaxy formed and evolved. The strong correlation between mass and age in low-mass red- giant stars means that the required goal of determining stellar ages to 30% or better implies that masses must be estimated to an ac- curacy better than 10%. Comparisons against accurate and inde- pendent mass determinations are however limited to stars in binary systems and, most notably, stars in clusters (see e.g. Brogaard et al. 2015, for a review). Unfortunately, the open clusters observed by MNRASL Advance Access published June 6, 2016 byguestonJune9,2016http://mnrasl.oxfordjournals.org/Downloadedfrom
- 2. Figure 1. Colour magnitude diagram of M4 stars based on the dataset de- scribed in D’Antona et al. (2009). Magnitudes and colour were corrected for differential reddening following Milone et al. (2012). The solid line rep- resents a isochrone (from BaSTI, see Sec. 3.1.1 for details) fit to the CMD. The large coloured open circles mark the stars with detected solar-like os- cillations (the corresponding oscillation spectra are plotted in Fig. 2). the Kepler space telescope (during its nominal mission) and by CoRoT explored the metal-rich regime only, and did not provide a test of the metal-poor population. Globular clusters are the oldest stellar systems for which it is possible to make reliable age estimates, and are hence benchmarks to test other age determinations. Previous efforts to detect solar- like oscillations in globular clusters have been made, but either no oscillations were detected (Frandsen et al. 2007), or only marginal detections were made (Stello & Gilliland 2009). However, K2—the re-purposed Kepler mission (Howell et al. 2014)—has now begun a survey of the ecliptic plane, which contains bright clusters includ- ing the globular cluster M4. In this Letter we report the detection of solar-like oscillations in K2 data of K giants belonging to M4, and compare the measured global oscillation properties against those expected from well-constrained, independent distance and mass es- timates. 2 M4 DATA REDUCTION AND ANALYSIS M4 was observed in K2 Campaign 2 for a total of 78.8 days. A frac- tion of the cluster’s total angular area on the celestial sphere was covered by sixteen 50-by-50 pixel superstamps. Masks for indi- vidual targets within the superstamps were defined using the K2P2 (K2-Pixel-Photometry; Lund et al. 2015) pipeline. Each mask was constructed from a summed image (over time) that allowed for the apparent motion of the stars on the CCD due to the drift of the spacecraft (Howell et al. 2014). Time-dependent positions of stars on the CCD were estimated from the 2D cross-correlation of a given superstamp, instead of estimated centroids for individual tar- gets. A set of unsupervised machine learning techniques was then applied to define the final masks, from which lightcurves were then produced. Changes in measured flux due to spacecraft roll were corrected by utilising the strong correlation of those changes with the stellar position on the CCD, using procedures similar to those described in Vanderburg & Johnson (2014). The resulting, corrected lightcurves 5 10 15 20 25 0 1e+05 2e+05 S1 0 1 2 5 10 15 20 25 30 35 40 0 2e+04 4e+04 6e+04 8e+04 S2 0 2 5 10 15 20 25 30 35 40 0 5e+04 1e+05 S3 0 2 5 10 15 20 25 30 35 40 45 0 2e+04 4e+04 6e+04 8e+04 S4 0 2 10 20 30 40 50 60 70 80 0 1e+04 2e+04 3e+04 S5 Powerspectraldensity[ppm2 /Hz] 0 2 4 10 20 30 40 50 60 70 80 0 1e+04 2e+04 3e+04 S6 0 5 10 20 30 40 50 60 70 80 0 1e+04 2e+04 3e+04 S7 0 5 20 30 40 50 60 70 80 90 100 Frequency [ Hz] 0 5e+03 1e+04 2e+04 2e+04 S8 0 5 Figure 2. Solar-like oscillation spectra of eight K giants observed by K2. The bottom star is in the RHB. Stars (from top to bottom) are ordered by increasing νmax. Vertical lines show the position of radial (dashed lines) and quadrupole (dash-dotted lines) oscillation frequencies as expected by the pattern of oscillation modes in red-giant stars described in Mosser et al. (2011). The expected granulation power and the combined granulation and oscillation power is represented by dashed and solid thick lines. The in- sets show the power spectrum of the power spectrum (PSPS) of each star, computed from the region around νmax. In each PSPS the prominent peak at Δν/2 (vertical gray line) is the detected signature of the near-regular spacing of oscillation peaks in the frequency spectrum. were then cleaned for artifacts using the KASOC filter (Handberg & Lund 2014); time scales of τlong = 1 days and τshort = 0.25 days were adopted for the median filters. We refer to Handberg & Lund (2014) for additional details on the KASOC filter. Among the sources identified by the K2P2 pipeline we se- lected those that could be unambiguously identified as K giants from the D’Antona et al. (2009) catalogue and the Marino et al. (2008, 2011) membership studies. Moreover, we retained only stars with V < 14 and B − I > 1.7, i.e. we avoided RR Lyrae pulsators, blue-horizontal-branch stars, and stars that would be too faint to have detectable oscillations (see Fig. 1). We then searched the frequency-power spectra of the chosen set of 28 lightcurves for evidence of solar-like oscillations using byguestonJune9,2016http://mnrasl.oxfordjournals.org/Downloadedfrom
- 3. ID RA [deg] DEC [deg] 2MASS ID V Vdr Teff [K] Δν [μHz] νmax [μHz] Noise [ppm2/μHz] S1 245.850089 -26.500147 16232402-2630005 12.777 12.786 4585 1.83 ± 0.02 11.1 ± 0.4 84 S2 245.884870 -26.439039 16233236-2626205 13.062 13.021 4715 2.55 ± 0.04 17.2 ± 0.7 211 S3 245.911908 -26.428539 16233885-2625427 13.071 13.071 4710 2.62 ± 0.04 17.7 ± 0.7 535 S4 245.820426 -26.496641 16231690-2629479 13.096 13.121 4715 2.64 ± 0.02 18.5 ± 0.7 188 S5 245.929534 -26.468725 16234308-2628074 13.539 13.583 4847 4.14 ± 0.02 32.5 ± 1.3 387 S6 245.949526 -26.496729 16234788-2629482 13.577 13.665 4842 4.30 ± 0.02 32.9 ± 1.3 202 S7 245.841473 -26.508892 16232195-2630320 13.645 13.668 4805 4.30 ± 0.02 34.3 ± 1.4 172 S8 245.985479 -26.424564 16235651-2625284 13.226 13.411 5672 5.67 ± 0.05 42.1 ± 1.7 192 Table 1. Properties of the stars with detected solar-like oscillations. Vdr is the V-band magnitude from the dataset described in D’Antona et al. 2009, corrected for differential reddening using the method described in Milone et al. (2012). Teff is calculated from corrected B − V colour and Casagrande & VandenBerg (2014), the assumed uncertainty on Teff is 100 K (see main text for details). two independent detection pipelines. The first one is based on an updated version (Elsworth et al., in preparation) of the automated detection pipeline described in Hekker et al. (2010) (see also Chap- lin et al. 2015). The asteroseismic analysis code was then used to extract from the detected oscillation spectra estimates of two commonly used global or average asteroseismic parameters: Δν, the average frequency separation between consecutive overtones of modes having the same angular degree; and νmax, the frequency at which the oscillations present their strongest observed amplitudes (see Elsworth et al., in preparation for details). To compare the de- tected power with expectations we used the relations in Mosser et al. (2012) and Kallinger et al. (2014) to describe the power en- velope due to the oscillations and the power spectrum of the gran- ulation, to which we then added the contribution due to shot noise estimated from the mean power close to the Nyquist frequency (see Fig. 2). The observed power excess is compatible with expecta- tions, in some cases weaker than expected, but this is in line with the fact that light curves of cluster stars suffer from a higher level of contamination from nearby sources. We have then performed a second analysis using an indepen- dent method that effectively utilizes the expected frequency pattern of red giant oscillation modes (Mosser et al. 2011). Estimates of the large spacing were first provided by the autocorrelation func- tion (Mosser & Appourchaux 2009), with the requirement that the null hypothesis be rejected at the 95 % confidence level. These val- ues were then refined with the method of Mosser et al. (2011). This uses a priori knowledge of the radial and quadrupole frequency pat- terns and provides reasonable constraints on the spacings even if the spectrum is of moderate quality only (see Fig. 2 and Hekker et al. 2012). Dipole modes, on the other hand, are not used since their frequencies are expected to show a complex pattern originat- ing from the interaction between acoustic and gravity modes. In all cases we also tested whether the excess power associated with a possible detection of the oscillations was consistent with expecta- tions based on results from archival Kepler data. For noisy spectra, the frequency of maximum oscillation was determined as for semi- regular variables showing only a limited number of modes (Mosser et al. 2013). Having compared results, we retained only stars where both pipelines reported a detection of solar-like oscillations (8 stars, la- belled S1 to S8; see Table 1 and Fig. 1). Their power spectra are shown in Fig. 2. Seven of the stars (S1 to S7) are on the red-giant branch (RGB); the eighth (S8, spectrum shown in bottom panel) is on the red horizontal branch (RHB). We adopted values and uncertainties for Δν and νmax from the pipeline by Mosser et al. (2011), which are compatible within 1-σ with those obtained with the first pipeline. For two stars (S2 and S6) the first pipeline re- turned two possible solutions for Δν, while results from the Mosser et al. (2011) method returned only a single value (which was com- patible with one of the two solutions of the first pipeline). Given the low fraction of stars in which we were able to un- ambiguously detect solar-like oscillations, we assessed the noise properties of the light curves analysed, and compared them with those of field stars. The stars analysed in this work have a noise level (calculated as in Stello et al. 2015 as the median power be- tween 260 and 280 μHz) of the order of few hundreds ppm2 /μHz (see Table 1), which is a factor ∼5-7 higher than in field stars of similar magnitude as presented in Stello et al. (2015). A thorough assessment of whether the augmented noise is primarily due to the contamination from nearby sources in such a crowded field remains to be addressed. Moreover, tests need to be carried out on how os- cillation detection pipelines perform with K2 datasets, which are shorter, and have higher noise (e.g. the instrumental noise peak at ν 47.23 μHz, see Lund et al. 2015), compared to those provided by the nominal Kepler mission. 3 RESULTS AND COMPARISON WITH INDEPENDENT CONSTRAINTS 3.1 Masses We proceeded as in Miglio et al. (2012) and estimated stellar masses by using several combinations of the available seismic and non-seismic constraints. The average separation scales to very good approximation as the square root of the mean density of the star, i.e., Δν ∝ ρ1/2 ; whilst νmax has been found to scale with a combination of surface gravity and effective temperature that also describes the dependence of the cut-off frequency for acoustic waves in an isothermal atmosphere, i.e., νmax ∝ gT−1/2 eff (see Chaplin & Miglio 2013 for further details and references). Four sets of masses were computed, using: M M νmax νmax, 3 Δν Δν −4 Teff Teff, 3/2 , (1) M M Δν Δν 2 L L 3/2 Teff Teff, −6 , (2) M M νmax νmax, L L Teff Teff, −7/2 , (3) M M νmax νmax, 12/5 Δν Δν −14/5 L L 3/10 . (4) The solar reference values were taken as Δν = 135.1 μHz, νmax, = byguestonJune9,2016http://mnrasl.oxfordjournals.org/Downloadedfrom
- 4. 3090 μHz (Huber et al. 2013) and Teff, = 5777 K. The solar ref- erence values for both pipelines used in this work differ from the values quoted by less than 0.5%, hence the size of systematic shifts in mass when using Eq 1-4 are expected to be lower than the un- certainties on the average RGB mass. The above equations assume strict adherence to the classic as- teroseismic scaling relations for Δν and νmax. Photometric Teff were calculated using (B−V)0 and compared with the value obtained using (V − I)0 to check for consistency. We used E(B − V) and E(V − I) values from Table 3 in Hendricks et al. (2012). Colour-Teff calibrations, as well as bolometric cor- rection (BC) at the stellar temperatures, and the solar BC were taken from Casagrande & VandenBerg (2014). We iterated between the asteroseismic surface gravity, obtained from νmax and Teff, and the colour-Teff relation, which requires the surface gravity as input. In the colour-Teff relation we assumed the spectroscopically deter- mined [Fe/H] = −1.1, and [α/Fe] = 0.4, see Marino et al. 2008. We assumed an uncertainty on each Teff of 100 K. We note that, for the 7 stars in common with the analysis by Marino et al. (2008), the spectroscopic and photometric Teff agree well within the uncertain- ties. For internal consistency, the distance modulus was derived by combining the radii of eclipsing binaries presented in Kaluzny et al. (2013) with the temperatures from Casagrande & Vanden- Berg (2014), giving (m − M)0 = 11.20 ± 0.10. We then estimated stellar luminosities using this distance together with the apparent magnitudes, and bolometric corrections. For each set of masses from Eq. 1–4, formal uncertainties on the individual masses were used to compute a weighted average mass of RGB stars (MRGB). The uncertainties in these averages were estimated from the weighted scatter in the masses (σM). To assess how well the formal fitting uncertainties reflected the scatter in the data we also report in Table 2 the weighted mean uncer- tainty estimated from the formal uncertainties on the masses (σM, see Miglio et al. 2012 for details). In some cases (Eq. 2 and 3) the observed scatter is significantly lower than expected from the formal uncertainties, which may indicate an overestimation of the observational uncertainties (e.g. on Teff which have a significant systematic component and a high-power dependence in Eq. 2 and 3). A source of possible systematic bias for masses determined using the average or global asteroseismic parameters are known de- partures from the classic scaling Δν ∝ ρ1/2 (see e.g. discussions in White et al. 2011; Miglio et al. 2012, 2013a; Belkacem et al. 2013). Suggested corrections to the Δν scaling are likely to depend (at a level of few percent) on the stellar structure itself. To estimate a set of corrections we computed stellar models using the code MESA (Paxton et al. 2011), taking an initial mass M = 0.85 M and heavy element abundance Z = 0.003 (obtained using the expres- sion in Salaris, Chieffi & Straniero 1993, and the spectroscopically determined metallicity and alpha-enhancement from Marino et al. 2008). A Reimers’ mass-loss efficiency parameter of η = 0.2 was also assumed. For any given model we defined Δν to be a Gaussian- weighted average (FWHM = 0.66 ν0.88 max, see Mosser et al. 2012), centred in νmax, of the large frequency separations of adiabatic ra- dial modes (for details see Miglio et al. 2013a and Rodrigues et al., in preparation). The Δν values were normalised so that a solar- calibrated model reproduced the average Δν observed in the Sun. Our results suggest that the seven RGB stars with detected os- cillations are in a νmax range where the mean density will be under- estimated by 8% when strict adherence of the classic Δν scaling is assumed. For the RHB star the comparison suggests an overesti- mation of the mean density by ∼ 4%. If we apply these corrections to the mass determinations (see last four rows of Table 2), we end up with a significantly lower scatter in the results (see also Fig. 3) for all RGB stars. Needless to say there are other sources of systematic uncer- tainty that may affect the mass determination (e.g., systematic un- certainties on Teff). A thorough description of the Δν corrections, their limitations and their dependences on stellar properties, will be presented in Rodrigues et al., in preparation. Extracting individual mode frequencies from these data is likely to be very challenging. Having estimates of individual fre- quencies, and not just the average Δν, would allow us to determine the stellar mean density with a much improved precision (see e.g. Huber et al. 2013, Handberg et al. in preparation), and to mitigate the impact of our poor modelling of surface layers (e.g. see Chaplin & Miglio 2013) and of ambiguities in the definition of the average Δν. 3.1.1 Comparison with independent estimates of mass and distance By fitting to the colour-magnitude diagram BaSTI (Pietrinferni et al. 2004) isochrones of the appropriate metallicity and alpha- enhancement, and adopting an initial He mass fraction Y = 0.25, we find an age of 13 Gyr and a MISO,RGB = 0.84 M . We adopt a conservative uncertainty of 0.05 M , which takes into account uncertainties on initial chemical composition, age, distance modu- lus and reddening. This value for MISO,RGB is also compatible with the value found by extrapolating with isochrones the mass of the turnoff eclipsing binaries (Kaluzny et al. 2013) to the red giant branch phase, which gives MEB,RGB = 0.85 M . When the Δν scaling is taken at face value, MRGB determined from the four sets of masses, albeit consistent ( 10%) with the expected mass, shows a significant scatter. When introducing a model-based correction to the Δν scaling relation, the scatter be- tween the various sets of masses is significantly reduced, and the discrepancy with independent mass estimates becomes smaller than the quoted uncertainties on the average mass (σM) and of the same order or smaller than the weighted scatter in the masses (σM). A vi- sual comparison between seismic masses and MISO,RGB is presented in Fig. 3. The mass of the RHB star is marginally consistent with ex- pectations (MISO,RHB 0.74 M ), and the model-suggested cor- rection increases the scatter between the different mass estimates. Given the uncertainty over mass-loss, and hence on the expected correction to the Δν scaling, increasing the number of RHB stars with detections will be crucial to quantify any significant bias in the seismic mass estimates. Several studies have revealed the existence of multiple stellar populations, having different chemical compositions, in globular clusters that have been subjected to a detailed abundance analysis (e.g., see Gratton, Carretta & Bragaglia 2012; Piotto et al. 2015). M4 is no exception, and the presence and properties of two main populations is well documented in the literature (see e.g. Marino et al. 2008; Carretta et al. 2009; Milone et al. 2014; Malavolta et al. 2014). It is widely accepted that the He-poor and He-rich popula- tions in globular clusters are coeval within a few hundreds Myr as predicted by the scenarios proposed to explain the occurrence of these multiple populations (e.g. see Renzini et al. 2015 for a recent review on the proposed scenarios). The present-day He-rich (Na-rich, O-poor) stars should there- fore be less massive than the He-poor (Na-poor, O-rich) stars be- byguestonJune9,2016http://mnrasl.oxfordjournals.org/Downloadedfrom
- 5. Eq. MRGB σM σM N MRHB (1) 0.99 0.05 0.02 7 0.79 ± 0.10 (2) 0.78 0.09 0.01 7 0.53 ± 0.12 (3) 0.84 0.06 0.01 7 0.61 ± 0.08 (4) 0.94 0.04 0.02 7 0.73 ± 0.07 ΔνCORR (1) 0.84 0.04 0.02 7 0.86 ± 0.11 (2) 0.84 0.09 0.01 7 0.51 ± 0.12 (3) 0.84 0.06 0.01 7 0.61 ± 0.08 (4) 0.84 0.03 0.02 7 0.78 ± 0.08 Table 2. Average mass of stars on the RGB estimated using different obser- vational constraints and scaling relations (Equations 1 to 4). N is the number of stars included in the average. The masses reported in the last four rows were obtained introducing a correction to the Δν scaling as described in Sec. 3.1. The mass of the RHB star (S8) is reported in the last column. DM σDM σDM N ΔνCORR 11.40 0.05 0.02 8 n 11.26 0.05 0.06 8 y Table 3. Mean true distance modulus (DM = (m − M)0) and associated uncertainties, with and without introducing a correction to the Δν scaling. cause the former evolve more quickly. The expected mass differ- ence on the RGB based on the different initial He mass fraction (0.25 versus 0.27; see Nardiello et al. 2015) is inferred to be 0.03 M (using BaSTI isochrones). A higher He enhancement, as sug- gested by, for example, Villanova et al. (2012), would imply a higher mass difference (see e.g. Valcarce et al. 2014, for an exhaus- tive review on recent results). The precision in the average mass determined here is insufficient to detect this difference. 3.2 Radius / distance Using a combination of seismic constraints and Teff, we may also estimate stellar radii: R R νmax νmax, Δν Δν −2 Teff Teff, 1/2 . (5) Radii determined from Eq. 5 agree at the 5 % level with indepen- dent estimates determined from L and Teff. The above may also be formulated as a comparison of distance moduli. After applying the model-predicted correction to the Δν scaling, we find an average distance modulus (see Table 3) that is in excellent agreement with the independent determination obtained from constraints on eclipsing binaries (see Sec. 3.1). 4 SUMMARY AND FUTURE PROSPECTS We have reported the first detections of solar-like oscillations in gi- ants belonging to a globular cluster. M4 provides what is at present a unique set of targets for testing asteroseismic mass and radius de- termination in low-metallicity environments. These tests are crucial for the robustness of Galactic archeology studies, which are now making use of solar-like oscillators (see e.g. Miglio et al. 2013b). In the sample of RGB stars analysed in our study, we find no evi- dence for a significant systematic offset between the seismic mass S1 S2 S3 S4 S5 S6 S7 S8 0.4 0.6 0.8 1 1.2 1.4 M/M sun No Δν correction Eq. (1) Eq. (2) Eq. (3) Eq. (4) S1 S2 S3 S4 S5 S6 S7 S8 0.4 0.6 0.8 1 1.2 1.4 M/M sun Δν correction Eq. (1) Eq. (2) Eq. (3) Eq. (4) Figure 3. Mass of M4 giants as inferred from Eq. 1 to 4 with (lower panel) and without (upper panel) applying a model-predicted correction to the Δν scaling relation. The last star to the right (S8) is a RHB star. The solid and dashed lines denote the 1-σ mass interval as determined from isochrone fitting and assuming two values for the initial He mass fraction (see Section 3.1.1 for details). and radius/distance estimates and independent determinations, pro- vided that a correction to the Δν scaling relation as suggested by stellar models is introduced. In that case, for RGB stars we find ex- cellent agreement with the expected masses from isochrone fitting, and using a distance modulus derived with independent methods. The offset with respect to independent masses is lower, or compa- rable with, the uncertainties on the average RGB mass (4 − 10%, depending on the combination of constraints used). Extracting clean light curves from these crowded images is challenging, and further complicated by the instrumental drifts of K2. Having demonstrated that it is possible to detect solar-like os- cillations in M4, we are now working on producing cleaner light curves for a larger sample of stars. A systematic analysis of as- teroseismic detections in a larger sample of M4 giants will allow more stringent tests of the mass determination and, by implication, systematic corrections to the asteroseismic Δν scaling relation. The detection of solar-like oscillations potentially opens the door to the more ambitious goal of using seismology to probe mul- tiple populations in old globular clusters. Based on results in the literature (Marino et al. 2008 and Carretta et al. 2009), six of the M4 stars with detected oscillations belong to the second (Na-rich, O-poor) population, while the RHB star and S2 are likely to be first generation (Na-poor, O-rich) stars. Again, an increase in the num- ber of stars with detections of solar-like oscillations may allow us to detect mass differences between multiple populations, although the systematic uncertainties described in Section 3 will need to be borne in mind. Looking to the future, neither the upcoming NASA TESS Mis- sion (Ricker et al. 2014) nor the ESA PLATO Mission (Rauer et al. 2014) are optimized for the study of densely populated stellar clus- ters. A space mission dedicated to the detection and study of os- cillations in globular clusters should be considered. Long-duration observations, like the multi-year observations provided by the nom- byguestonJune9,2016http://mnrasl.oxfordjournals.org/Downloadedfrom
- 6. inal Kepler mission, would give the frequency resolution needed to extract individual frequencies of many modes. This would not only improve the determination of global properties (see Section 3.1) but also give us access to seismic proxies of the internal structures of the stars (i.e., the near-core structure, internal rotation, and infor- mation on the envelope He abundance). The limitations imposed by the shorter-duration campaigns of K2 mean that extracting indi- vidual frequencies of red giants from the existing M4 data will be much more challenging. ACKNOWLEDGMENTS Funding for this Discovery mission is provided by NASA’s Sci- ence Mission Directorate. The authors wish to thank the entire Kepler and K2 team, without whom these results would not be possible. A.M., W.J.C., G.R.D., Y.P.E., T.C., C.J., and J.S.K. ac- knowledge the support of the UK Science and Technology Facil- ities Council (STFC). Funding for the Stellar Astrophysics Cen- tre is provided by The Danish National Research Foundation (Grant agreement no.: DNRF106). The research is supported by the ASTERISK project (ASTERoseismic Investigations with SONG and Kepler) funded by the European Research Council (Grant agreement no.: 267864). M.N.L. acknowledges the support of The Danish Council for Independent Research | Natural Science (Grant DFF-4181-00415), and the European Community’s Seventh Framework Programme (FP7/2007-2013) under grant agreement no. 312844 (SPACEINN). APM and AFM acknowledge support by the Australian Research Council through Discovery Early Ca- reer Researcher Awards DE150101816 and DE160100851. L.R.B., L.M. and V.N. acknowledge PRIN-INAF 2012 funding under the project entitled: ’The M4 Core Project with Hubble Space Tele- scope’. L.M. acknowledges the financial support from the Euro- pean Union Seventh Framework Programme (FP7/2007-2013) un- der Grant agreement number 313014 (ETAEARTH). REFERENCES Baglin A. et al., 2006, in COSPAR Meeting, Vol. 36, 36th COSPAR Scientific Assembly, p. 3749 Belkacem K., Samadi R., Mosser B., Goupil M.-J., Ludwig H.-G., 2013, in Astronomical Society of the Pacific Conference Series, Vol. 479, Progress in Physics of the Sun and Stars: A New Era in Helio- and Asteroseismology, Shibahashi H., Lynas-Gray A. E., eds., p. 61 Brogaard K., Sandquist E., Jessen-Hansen J., Grundahl F., Frand- sen S., 2015, Astrophysics and Space Science Proceedings, 39, 51 Carretta E., Bragaglia A., Gratton R., Lucatello S., 2009, A&A, 505, 139 Casagrande L., VandenBerg D. A., 2014, MNRAS, 444, 392 Chaplin W. J. et al., 2015, PASP, 127, 1038 Chaplin W. J., Miglio A., 2013, ARA&A, 51, 353 D’Antona F., Stetson P. B., Ventura P., Milone A. P., Piotto G., Caloi V., 2009, MNRAS, 399, L151 Frandsen S. et al., 2007, A&A, 475, 991 Gratton R. G., Carretta E., Bragaglia A., 2012, A&A Rev., 20, 50 Handberg R., Lund M. N., 2014, MNRAS, 445, 2698 Hekker S. et al., 2010, MNRAS, 402, 2049 —, 2012, A&A, 544, A90 Hendricks B., Stetson P. B., VandenBerg D. A., Dall’Ora M., 2012, AJ, 144, 25 Howell S. B. et al., 2014, PASP, 126, 398 Huber D. et al., 2013, ApJ, 767, 127 Kallinger T. et al., 2014, A&A, 570, A41 Kaluzny J. et al., 2013, AJ, 145, 43 Koch D. G. et al., 2010, ApJ, 713, L79 Lund M. N., Handberg R., Davies G. R., Chaplin W. J., Jones C. D., 2015, ApJ, 806, 30 Malavolta L., Sneden C., Piotto G., Milone A. P., Bedin L. R., Nascimbeni V., 2014, AJ, 147, 25 Marino A. F., Villanova S., Milone A. P., Piotto G., Lind K., Geisler D., Stetson P. B., 2011, ApJ, 730, L16 Marino A. F., Villanova S., Piotto G., Milone A. P., Momany Y., Bedin L. R., Medling A. M., 2008, A&A, 490, 625 Miglio A. et al., 2012, MNRAS, 419, 2077 —, 2013a, in European Physical Journal Web of Conferences, Vol. 43, European Physical Journal Web of Conferences, p. 3004 —, 2013b, MNRAS, 429, 423 Milone A. P. et al., 2014, MNRAS, 439, 1588 —, 2012, A&A, 540, A16 Mosser B., Appourchaux T., 2009, A&A, 508, 877 Mosser B. et al., 2011, A&A, 525, L9 —, 2013, A&A, 559, A137 —, 2012, A&A, 537, A30 Nardiello D., Milone A. P., Piotto G., Marino A. F., Bellini A., Cassisi S., 2015, A&A, 573, A70 Paxton B., Bildsten L., Dotter A., Herwig F., Lesaffre P., Timmes F., 2011, ApJS, 192, 3 Pietrinferni A., Cassisi S., Salaris M., Castelli F., 2004, ApJ, 612, 168 Piotto G. et al., 2015, AJ, 149, 91 Rauer H. et al., 2014, Experimental Astronomy, 38, 249 Renzini A. et al., 2015, MNRAS, 454, 4197 Ricker G. R. et al., 2014, in Society of Photo-Optical Instrumen- tation Engineers (SPIE) Conference Series, Vol. 9143, Society of Photo-Optical Instrumentation Engineers (SPIE) Conference Series, p. 20 Salaris M., Chieffi A., Straniero O., 1993, ApJ, 414, 580 Stello D., Gilliland R. L., 2009, ApJ, 700, 949 Stello D. et al., 2015, ApJ, 809, L3 Valcarce A. A. R., Catelan M., Alonso-García J., Cortés C., De Medeiros J. R., 2014, ApJ, 782, 85 Vanderburg A., Johnson J. A., 2014, PASP, 126, 948 Villanova S., Geisler D., Piotto G., Gratton R. G., 2012, ApJ, 748, 62 White T. R., Bedding T. R., Stello D., Christensen-Dalsgaard J., Huber D., Kjeldsen H., 2011, ApJ, 743, 161 byguestonJune9,2016http://mnrasl.oxfordjournals.org/Downloadedfrom