Properties of rubble-pile asteroid (101955) Bennu from OSIRIS-REx imaging and thermal analysis
•
1 recomendación•122 vistas

This document summarizes findings from imaging and thermal analysis of asteroid Bennu by NASA's OSIRIS-REx spacecraft. It finds that Bennu's surface is globally rough, dense with boulders over 1 meter in size, and has a low albedo of 4.4%. Thermal data indicates a moderate global thermal inertia of 350 J m-2 K-1 s-1/2, suggesting surface particle sizes of 0.5-5 cm by simple models, however images show the surface is dominated by boulders over 1 meter. Over 80% of the surface was analyzed, finding a power law distribution of boulder sizes with an index of -2.9 for boulders 8 meters

Recomendados
Recomendados
Más contenido relacionado
La actualidad más candente
La actualidad más candente (20)
Similar a Properties of rubble-pile asteroid (101955) Bennu from OSIRIS-REx imaging and thermal analysis
Similar a Properties of rubble-pile asteroid (101955) Bennu from OSIRIS-REx imaging and thermal analysis (20)
Más de Sérgio Sacani
Más de Sérgio Sacani (20)
Último
Último (20)
Properties of rubble-pile asteroid (101955) Bennu from OSIRIS-REx imaging and thermal analysis
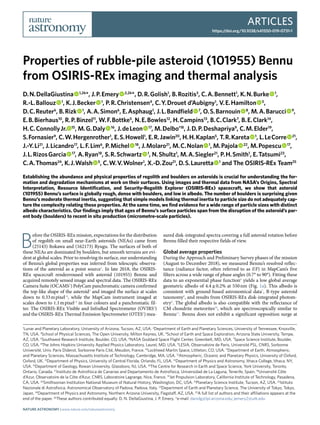
- 1. Articles https://doi.org/10.1038/s41550-019-0731-1 1 Lunar and Planetary Laboratory, University of Arizona, Tucson, AZ, USA. 2 Department of Earth and Planetary Sciences, University of Tennessee, Knoxville, TN, USA. 3 School of Physical Sciences, The Open University, Milton Keynes, UK. 4 School of Earth and Space Exploration, Arizona State University, Tempe, AZ, USA. 5 Southwest Research Institute, Boulder, CO, USA. 6 NASA Goddard Space Flight Center, Greenbelt, MD, USA. 7 Space Science Institute, Boulder, CO, USA. 8 The Johns Hopkins University Applied Physics Laboratory, Laurel, MD, USA. 9 LESIA, Observatoire de Paris, Université PSL, CNRS, Sorbonne Université, Univ. Paris Diderot, Sorbonne Paris Cité, Meudon, France. 10 Lockheed Martin Space, Littleton, CO, USA. 11 Department of Earth, Atmospheric, and Planetary Sciences, Massachusetts Institute of Technology, Cambridge, MA, USA. 12 Atmospheric, Oceanic and Planetary Physics, University of Oxford, Oxford, UK. 13 Department of Physics, University of Central Florida, Orlando, FL, USA. 14 Department of Physics and Astronomy, Ithaca College, Ithaca, NY, USA. 15 Department of Geology, Rowan University, Glassboro, NJ, USA. 16 The Centre for Research in Earth and Space Science, York University, Toronto, Ontario, Canada. 17 Instituto de Astrofísica de Canarias and Departamento de Astrofísica, Universidad de La Laguna, Tenerife, Spain. 18 Université Côte d’Azur, Observatoire de la Côte d’Azur, CNRS, Laboratoire Lagrange, Nice, France. 19 Jet Propulsion Laboratory, California Institute of Technology, Pasadena, CA, USA. 20 Smithsonian Institution National Museum of Natural History, Washington, DC, USA. 21 Planetary Science Institute, Tucson, AZ, USA. 22 Istituto Nazionale di Astrofisica, Astronomical Observatory of Padova, Padova, Italy. 23 Department of Earth and Planetary Science, The University of Tokyo, Tokyo, Japan. 24 Department of Physics and Astronomy, Northern Arizona University, Flagstaff, AZ, USA. 25 A full list of authors and their affiliations appears at the end of the paper. 26 These authors contributed equally: D. N. DellaGiustina, J. P. Emery. *e-mail: danidg@lpl.arizona.edu; jemery2@utk.edu B efore the OSIRIS-REx mission, expectations for the distribution of regolith on small near-Earth asteroids (NEAs) came from (25143) Itokawa and (162173) Ryugu. The surfaces of both of these NEAs are dominated by boulders, but smooth terrains are evi- dent at global scales. Prior to resolving its surface, our understanding of Bennu’s global properties was inferred from telescopic observa- tions of the asteroid as a point source1 . In late 2018, the OSIRIS- REx spacecraft rendezvoused with asteroid (101955) Bennu and acquired remotely sensed image and spectral data. The OSIRIS-REx Camera Suite (OCAMS2 ) PolyCam panchromatic camera confirmed the top-like shape of the asteroid3 and imaged the surface at scales down to 0.33 m pixel–1 , while the MapCam instrument imaged at scales down to 1.1 m pixel–1 in four colours and a panchromatic fil- ter. The OSIRIS-REx Visible and InfraRed Spectrometer (OVIRS4 ) and the OSIRIS-REx Thermal Emission Spectrometer (OTES5 ) mea- sured disk-integrated spectra covering a full asteroid rotation before Bennu filled their respective fields of view. Global average properties During the Approach and Preliminary Survey phases of the mission (August to December 2018), we measured Bennu’s resolved reflec- tance (radiance factor, often referred to as I/F) in MapCam’s five filters across a wide range of phase angles (0.7° to 90°). Fitting these data to an exponential phase function6 yields a low global average geometric albedo of 4.4 ± 0.2% at 550 nm (Fig. 1a). This albedo is consistent with ground-based astronomical data7 , B-type asteroid taxonomy8 , and results from OSIRIS-REx disk-integrated photom- etry9 . The global albedo is also compatible with the reflectance of CM chondrite meteorites10 , which are spectroscopically similar to Bennu11 . Bennu does not exhibit a significant opposition surge at Properties of rubble-pile asteroid (101955) Bennu from OSIRIS-REx imaging and thermal analysis D. N. DellaGiustina 1,26 *, J. P. Emery 2,26 *, D. R. Golish1 , B. Rozitis3 , C. A. Bennett1 , K. N. Burke 1 , R.-L. Ballouz 1 , K. J. Becker 1 , P. R. Christensen4 , C. Y. Drouet d’Aubigny1 , V. E. Hamilton 5 , D. C. Reuter6 , B. Rizk 1 , A. A. Simon6 , E. Asphaug1 , J. L. Bandfield 7 , O. S. Barnouin 8 , M. A. Barucci 9 , E. B. Bierhaus10 , R. P. Binzel11 , W. F. Bottke5 , N. E. Bowles12 , H. Campins13 , B. C. Clark7 , B. E. Clark14 , H. C. Connolly Jr. 15 , M. G. Daly 16 , J. de Leon 17 , M. Delbo’18 , J. D. P. Deshapriya9 , C. M. Elder19 , S. Fornasier9 , C. W. Hergenrother1 , E. S. Howell1 , E. R. Jawin20 , H. H. Kaplan5 , T. R. Kareta 1 , L. Le Corre 21 , J.-Y. Li21 , J. Licandro17 , L. F. Lim6 , P. Michel 18 , J. Molaro21 , M. C. Nolan 1 , M. Pajola 22 , M. Popescu 17 , J. L. Rizos Garcia 17 , A. Ryan18 , S. R. Schwartz 1 , N. Shultz1 , M. A. Siegler21 , P. H. Smith1 , E. Tatsumi23 , C. A. Thomas24 , K. J. Walsh 5 , C. W. V. Wolner1 , X.-D. Zou21 , D. S. Lauretta 1 and The OSIRIS-REx Team25 Establishing the abundance and physical properties of regolith and boulders on asteroids is crucial for understanding the for- mation and degradation mechanisms at work on their surfaces. Using images and thermal data from NASA’s Origins, Spectral Interpretation, Resource Identification, and Security-Regolith Explorer (OSIRIS-REx) spacecraft, we show that asteroid (101955) Bennu’s surface is globally rough, dense with boulders, and low in albedo. The number of boulders is surprising given Bennu’s moderate thermal inertia, suggesting that simple models linking thermal inertia to particle size do not adequately cap- ture the complexity relating these properties. At the same time, we find evidence for a wide range of particle sizes with distinct albedo characteristics. Our findings imply that ages of Bennu’s surface particles span from the disruption of the asteroid’s par- ent body (boulders) to recent in situ production (micrometre-scale particles). Nature Astronomy | www.nature.com/natureastronomy
- 2. Articles NATURE ASTROnOmy low phase angles. The absence of a strong opposition effect is not surprising given the low albedo and thus single-scattering nature of the surface6 . During Approach, we also acquired disk-integrated and rota- tionally resolved measurements of Bennu’s thermal radiance from OVIRS and OTES. From these data, we determine a global average thermalinertiaof350 ± 20 J m–2 K–1 s–1/2 (SupplementaryFigs.1and2, Methods, and Supplementary Information). The OSIRIS-REx ther- mal data constrain thermal inertia variations to <10 J m–2 K–1 s–1/2 over a full rotation. The low to moderate thermal inertia and small variability with rotation are within the uncertainties of previous results based on observations with the Spitzer Space Telescope12 . The thermal inertia of asteroid surfaces is often translated into a characteristic particle size using simplified models that assume a uniform particulate regolith12–14 . The basis for these models is that particles smaller than the diurnal thermal skin depth will pro- duce a thermal inertia smaller than the value for bedrock (1,500 to 2,500 J m–2 K–1 s–1/2 for typical planetary materials15,16 ). For the moderate thermal inertia measured for Bennu, these models pre- dict a surface dominated by 0.5- to 5-cm-diameter particles (see Methods and Supplementary Information). However, resolved images of Bennu’s surface show that it is in fact dominated by >1-m boulders (Fig. 2). These simplistic regolith models clearly do not accurately describe Bennu’s surface. Below, we discuss other possible interpre- tations of Bennu’s thermal inertia, including low thermal inertia of boulders, dust cover on boulders, a mixture of particulate regolith and boulders, or a combination of these effects. Spatially resolved surface morphology Bennu is geomorphologically diverse (Fig. 2), cratered, and covered by rocks with a wide range of sizes, consistent with its characteriza- tion as a rubble-pile asteroid17 . Impact craters range in size from 10 to over 150 m (ref. 18 ), and the surface is populated by more than 200 boulders >10 m in diameter. The largest boulders exceed 30 m and appear predominantly at high latitudes. Smaller metre-scale boulders are evenly distributed across the asteroid, consistent with the uniform thermal inertia with rotation. Boulders display a wide range of morphology, sizes, and albedo. One of the darkest objects is the partially exposed outcrop of a boulder in the southern (–Z) hemisphere (–20° latitude, 30° longitude), perhaps a constituent component of the asteroid. It measures nearly 100 m in observ- able longest dimension, but its full extent is unclear. Bennu exhibits only small areas (<20 m) of boulder-free regolith19 , contrary to pre- encounter expectations1,12,20 . We have completed boulder counts and size measurements over >80% of the asteroid’s surface (Supplementary Fig. 3). The mea- sured sizes of the boulders range from 1 to 58 m (longest dimension). Figure 3 depicts the global cumulative size-frequency distribution (CSFD) of Bennu. We find a power-law index of –2.9 ± 0.3 for boul- ders 8 m and larger (see Methods for a discussion of the statistical completeness limit). This power-law index is within the range of other small Solar System bodies (Supplementary Fig. 4). By comparison, asteroid (25143) Itokawa has a global power-law index of –3.5 ± 0.121 for boulders ≥10 m, which implies that more of its surface mass is contained in small particles than is the case for Bennu. This is consistent with the distinct appearance of these two asteroids—Bennu lacks Itokawa’s smooth regions such as the Muses Sea22 . However, the absolute number density of large boul- ders (≥20 m) on Bennu and Itokawa is comparable (28.2 km–2 versus ~25 km–2 )21,22 . Conversely, the number density of boulders ≥20 m on (162173) Ryugu (~50 km–2 ), the slightly larger top-shaped target of the Hayabusa2 mission, is twice that of Bennu and Itokawa. Like Bennu, Ryugu has a power-law index of –2.5 to –3.0. The num- ber densities of large boulders suggest that boulder abundance on rubble-pile NEAs scales with asteroid size, whereas the steeper power-law index on bi-lobed Itokawa suggests that surface particle distributions may be influenced by asteroid shape. Notably, the dis- tribution of the large boulders (≥20 m) at high latitudes on Bennu corresponds with a steepening in the dynamic surface slope outside the equatorial latitudes23 . Accordingly, material from mid-latitude to polar regions is less energetically coupled to the surface of the 0 10 20 30 40 50 60 70 80 90 Phase angle (°) 0 0.005 0.010 0.015 0.020 0.025 0.030 0.035 0.040 0.045 0.050 ReflectanceI/F MapCam, pan MapCam, b' band MapCam, v band MapCam, w band MapCam, x band Average phase curve 0 10 20 30 40 50 60 70 80 90 Phase angle (°) 0.97 0.98 0.99 1.00 1.01 1.02 1.03 1.04 1.05 Relativereflectance b'/v band ratio w/v band ratio x/v band ratio a b Fig. 1 | Resolved phase curves of Bennu. a, Global reflectance values of Bennu’s surface as a function of phase angle, which convey Bennu’s photometric behaviour. We fit these data to an exponential phase function for each MapCam band. For clarity, the phase function of the spectral average is shown as a dashed line. b, Spectral dependence is observed when reflectance for the b′ (473 nm), w (698 nm) and x (847 nm) bands are plotted relative to the v band (550 nm) at 0° phase angle. The positive slope in the w and x data, and negative slope in the b′ data, demonstrate phase reddening. The error bars represent 1σ uncertainties. Nature Astronomy | www.nature.com/natureastronomy
- 3. ArticlesNATURE ASTROnOmy asteroid23 . As a result, smaller particles may preferentially migrate away from these areas, resulting in the exhumation and retention of larger boulders at higher latitudes. A shallow power-law index suggests boulder production domi- nated by impact processes24 . While multiple candidate impact cra- ters18 are visible across the surface (Fig. 2), the events that formed them could not produce the large observed boulder population (Supplementary Fig. 5). The presence of intact blocks about 1/10th of the diameter of Bennu suggests that the largest boulders are frag- ments from the catastrophic disruption of its parent body and the subsequent rubble-pile reaccumulation18,25 . Thus, the large (≥20 m) boulders evident in Bennu’s relatively shallow CSFD represent some of the oldest intact material on the surface. Although boulders <20 m may have been inherited by the catastrophic disruption of Bennu’s parent body, it is likely that some were formed by impacts on Bennu’s own surface, and may have experienced further in situ breakdown and disaggregation by thermal fatigue26 . Physical properties of boulders Bennu’s thermal inertia may be conveying information about the physical properties of its large surface boulders. One interpretation of the moderate thermal inertia is that the large boulders could have a lower thermal inertia than typical planetary materials. Any property that impedes the thermal wave in the material could lower the thermal inertia (for example, porosity, cement between clasts of a breccia, amorphous material). For example, the CM chondrite Cold Bokkeveld has a low thermal conductivity and correspond- ingly low thermal inertia (~770 J m–2 K–1 s–1/2 )16 due its porosity (~15%)27 . The hypothesis that Bennu’s boulders themselves have a relatively low thermal inertia is supported by the close spectral match of Bennu’s surface to CM chondrites11 . However, the ther- mal inertia of Cold Bokkeveld (the lowest among measured mete- orites27 ) is still considerably larger than Bennu’s global value. We investigated the thermal inertia of the boulders on Bennu by run- ning a two-component thermal model constrained by the spatial density of boulders18 . We find that the upper limit on the average boulder thermal inertia on Bennu is 1,400 J m–2 K–1 s–1/2 . We will measure thermal inertia of individual boulders from upcoming spatially resolved thermal observations. The global thermal inertia of Itokawa (750 J m–2 K–1 s–1/2 )28 is more than twice Bennu’s, even though the number density of large boul- ders is comparable. The shallower CSFD power-law index on Bennu suggests that it may have fewer centimetre-scale particles than Itokawa. Although it is not yet known whether Bennu’s CSFD main- tains a constant power-law index from 8 m to 2 cm, analyses of rego- lith on other asteroids suggest constant power laws across similar scales29 . The lower thermal inertia and relative deficit of small par- ticles on Bennu, in turn, suggest that the boulders may have a lower 70 60 50 40 30 20 10 0° –10 –20 –30 –40 –50 –60 –70 0° 10 20 30 40 50 60 70 80 90 100 110 120 130 140 150 160 170 180 190 200 210 220 230 240 250 260 270 280 290 300 310 320 330 340 350 360 a Longitude Latitude b Fig. 2 | Asteroid Bennu imaged by the OSIRIS-REx Camera Suite. a, Whole-disk mosaics of Bennu. PolyCam images from 2 December 2018 are combined to show four sides of Bennu. When viewed from left to right these data illustrate one rotation of the asteroid. Phase angles of the images are between 47.72° and 51.91°, and pixel scales are between 0.509 and 2.926 m pixel–1 . b, Global equirectangular map of Bennu. PolyCam images acquired on 1 December 2018 (phase angle range of 33.22° and 35.76° and pixel scales between 0.743 and 3.866 m pixel–1 ) are combined with MapCam images from 13 December 2018, (phase angle range of 38.15° to 52.01° and pixel scales between 1.331 to 1.885 m pixel–1 ) and mosaicked into this equirectangular map of Bennu. North is defined as the +Z pole and points to the top of the image. Nature Astronomy | www.nature.com/natureastronomy
- 4. Articles NATURE ASTROnOmy thermal inertia than those on Itokawa. Different thermal inertias of boulders on S-type versus B-type asteroids are consistent with differences in the thermal conductivity of their respective analogue meteorites27 . Density and heat capacity also influence thermal iner- tia, but their variation among meteorite analogues is much smaller than that of thermal conductivity. Although the boulder abundance on Ryugu is about twice that on Bennu and the CSFD indices are similar, Ryugu’s thermal inertia is 200 to 500 J m–2 K–1 s–1/2 (refs. 30,31 ), suggesting that its boulders may have similar thermal inertia to Bennu’s. Porosity tends to have a stronger control on thermal iner- tia than composition27 , so the difference in Itokawa’s global thermal inertia compared with Bennu’s and Ryugu’s could result from dis- tinct porosities of their boulders. Boulders are a major source of albedo heterogeneity on Bennu. The full range of normal albedo variation is more than a factor of 4 (from 3.3% to 15%), though 95% of the range is between 3.6% to 4.8% (a factor of 1.5)19 . This diversity is greater than on Ryugu, which has a similar global geometric albedo to Bennu31 . The total range also exceeds that observed on Itokawa (factor of 1.3)32 and Eros (factor of 3.5)33 . Because much of Bennu’s albedo variation appears linked to boulder size, trends in albedo may help us assess the properties of these boulders. Figure 4a shows the normal albedo distribution of boulders identified to date. The largest boulders have albedos near the global average, whereas the brightest boulders (>1σ from the mean boulder albedo, or >6.8%) are all smaller than ~10 m. Although we are only sampling a small number of bright boulders (~370), our data show a clear difference in the size distri- butions of bright versus average-to-dark boulders (Fig. 4b). This distinct size distribution has several potential origins. Much of the spectrophotometric variation observed on airless bodies has been attributed to radiation and bombardment processes collec- tively referred to as ‘space weathering’. For example, on asteroid (433) Eros, colour and reflectance differences are not explained by distinct rock types, but rather by complex regolith sorting and space weathering processes34 . One study35 that investigated solar- wind-induced space weathering outcomes for CI/CM chondrites predicted that bluer and brighter regions on Bennu could represent more weathered material, although results from laser irradiation experiments show the opposite36 . Given that the large (>30 m) boul- ders represent intact material from Bennu’s parent body, their aver- age albedo may signify older surfaces that have been more optically modified. Smaller and brighter boulders may represent younger, more recently fragmented material. Another possibility is that bright material represents remnants of Bennu’s parent body or the impactor that disrupted it, which reac- creted into Bennu and other small asteroids. This scenario would imply that the observed heterogeneity is the result of distinct rock types, which fragment differently, leading to the observed differ- ences in size distribution. Some clues are provided from evidence of bright clasts bound in a matrix19 and in situ boulder disaggregation into resistant constituent clasts (Fig. 5). Some clasts have a range of albedos that differ from the surrounding terrain, implying that some of the albedo diversity on Bennu is inherited19 . Evidence of particulate regolith We observe diffuse units of dark material that we interpret as low- albedo dust blanketing the surface (Fig. 6 and Supplementary Fig. 6). The dark diffuse unit shown in Fig. 6 is proximal to the partially exposed boulder outcrop (discussed above), which is one of the darkest objects on the asteroid and shows a spectral feature at 550 nm19 . This spectral feature may be due to enhanced magnetite concentrations generated as a byproduct of space weathering19 . Our observation of dark dust cover strengthens this finding by supply- ing evidence that it is compositionally distinct. Laboratory studies show that the reflectance of CM chondrite powders increases with decreasing particle size37 . Thus, dust generated from mechanical breakdown on Bennu should be brighter, and for dust to be darker than the surroundings it likely has a different composition. However, the mechanism for transporting fine material from a composition- ally distinct reservoir to nearby terrains remains unclear. Furthermore, the presence of particulate regolith mixed with the observed boulders could explain the moderate thermal inertia. If such fine particulate material manifested as a dust (particle size less than a few tens of micrometres) coating on boulders, as we observe, it would result in a masking of the higher-thermal-inertia signature expectedfromlargeboulders.Dustcoatingsafewtensto100μmthick affect thermal signatures (J. Biel et al., manuscript in preparation). Particulates may also be present as coarser regolith between boul- ders or as a combination of dust coating and coarser interstitial regolith. Indeed, images of the surface reveal some areas that appear smooth at current pixel scales (0.33 m pixel–1 )19 , indicating the pres- ence of particulate regolith. The global scattering properties of Bennu obtained from spectro- photometric modelling reveal additional evidence of small particles. The spectral dependence of Bennu’s phase curve is nearly flat to within the radiometric precision of OCAMS (Fig. 1a). In relative compari- sons between the OCAMS colours, however, Bennu reddens at higher phase angles (Fig. 1b), as has been observed on several other aster- oids38,39 . Bennu’s low albedo does not favour multiple scattering, which has been invoked to explain phase reddening40 . Although single scat- tering is typically considered to have a weak wavelength dependence, it has been suggested39 that wavelength-dependent single scattering on low-albedo surfaces might be due to micrometre-scale particles. This inference is supported by laboratory analyses demonstrating that the external structure of small scatterers can exhibit wavelength-depen- dent interactions with light41 . As the wavelength begins to exceed the size of the scatterer, small grains become less opaque, leading to a relative increase in reflectance. The observed phase reddening thus implies the presence of micrometre-scale material on the surface. The presence of fine particles is consistent with one possible interpretation of the moderate global thermal inertia: a dust coating on boulders. Reflectance and thermal emission spectra are also consistent with the presence of fine particulates among the abundant boulders11 . Cumulativefrequencyperkm2 10,000 1,000 Completenesslimit 100 10 1 100101 Boulder diameter (longest dimension in m) –2.9 ± 0.3 Fig. 3 | Global cumulative size–frequency distribution of boulders. Bennu’s global cumulative size–frequency distribution of boulders plotted in logarithmic space. The data presented here are considered complete to >8 m (see Methods). Note the break in trend for boulders in the 20- to 40-m-diameter range. There is a deficit of boulders with diameters in the ranges of 25 to 30 m and 33 to 43 m. Light blue data points represent individual boulder diameters, while the red line represents the best-fit power-law slope. Nature Astronomy | www.nature.com/natureastronomy
- 5. ArticlesNATURE ASTROnOmy Finally, our thermal analysis finds that Bennu has a rough surface (root mean square (RMS) slope of 43 ± 1°, Supplementary Fig. 2). This roughness is comparable to that of other asteroids42–45 but rougher than that of the Moon46 . The model itself does not set a spatial scale for this roughness; it can be anywhere between the resolution of the shape model used for the thermal analysis (~12 m) and the diurnal thermal skin depth (~2 cm, see Methods), though we expect that roughness at the smaller length scales dominates the thermal signature42 . From the shape model of Bennu3 , we find RMS slopes that increase with decreasing spatial scale. Extrapolation of a power-law fit to roughness estimates from the shape model at four spatial scales fits the measured thermal roughness at a spatial scale of ~2 cm (Supplementary Fig. 7). We therefore predict that the surface of Bennu is rough at small spatial scales, perhaps consis- tent with the images of Ryugu returned by the MASCOT lander47 . Images of the surface of Bennu during the Reconnaissance phase of the mission will test this prediction. The presence of micrometre-scale particles on Bennu runs coun- ter to the expectation that small (>1 km) airless bodies have coarser regolith because their lower gravity hinders retention of fines (which escape the surface through impact events, solar wind pressure, and centripetal forces13,48,49 ). However, it is consistent with the findings of the Hayabusa mission, which collected micrometre-size particles from the surface of Itokawa50 . The presence of such particles implies an enhanced ability of the finest material to remain coupled to the surface through electrostatic effects51 , or the ongoing production of particles through micrometeorite impacts50 and thermal fatigue of boulders26 on timescales shorter than the loss mechanisms. Conclusion and perspectives Our initial findings from imaging and thermal data reveal a rub- ble-pile asteroid with extensive surficial diversity. There exists a heterogeneity of particle sizes on the surface. Large-scale boul- ders imply the presence of intact materials that originated at or before the disruption of Bennu’s parent body, whereas evidence of micrometre-scale particles points to more recent in situ production and retention of fines on the surface of the asteroid. The thermal inertia of Bennu suggests either a substantial population of centi- metre-scale particles among the surface boulders, thin dust cover blanketing the boulders, high porosity of the boulders, or a com- bination of these. Despite the inferred range of particle sizes, there are no large areas of well-sorted particulate regolith. The presence of bright boulders with a distinct size-frequency distribution may be primordial—perhaps, exposed fragments of a heterogeneous parent body that was collisionally disrupted. Conversely, their presence could be explained as fresher material that has undergone 10 20 30 40 50 60 Boulder diameter (longest dimension in m) 3 4 5 6 7 8 9 10 11 12 Normalalbedo(%) Global average albedo Globalcompletenesslimit Cumulativefrequencyperkm2 10,000 1,000 100 10 1 10010 Averagealbedo completenesslimit Brightalbedocompletenesslimit 1 –2.5 ± 0.2 –4.4 ± 0.7 Boulder diameter (longest dimension in m) a b Bright albedo (> 6.8%) Average albedo Fig. 4 | Albedo trends among Bennu’s boulders. a, Boulders on Bennu: normal albedo versus size. The brightest boulders have smaller diameters. The completeness limit of the global distribution of boulders and the global average albedo of Bennu are shown for context. b, Bennu’s CSFD of boulders with average albedo and bright albedo (>6.8%) in logarithmic space. While small numbers influence the power-law index for the bright boulders, these data suggest that the bright boulders have a different size–frequency distribution than the average-albedo boulders. Light blue data points represent the individual diameters of bright boulders, and dark blue points represent the individual diameters of average-to-dark boulders. The red lines associated with each dataset represent their best-fit power-law slope. 10 m Fig. 5 | Evidence of in situ boulder disaggregation. A boulder that appears to be degrading into its constituent clasts (approximate coordinates of 45° latitude, 110° longitude). This image was acquired with PolyCam and has an average phase angle of 51.33° and a pixel scale of 0.643 m pixel–1 . Nature Astronomy | www.nature.com/natureastronomy
- 6. Articles NATURE ASTROnOmy less optical surface modification via space weathering. We will test these hypotheses with observations at higher spatial and spectral resolutions planned for the Detailed Survey52 phase of the mission in the spring of 2019. Methods Calibration of OCAMS images. OCAMS images are processed by a calibration pipeline to be corrected for known sources of noise and converted to physical units. The corrections include bias and dark subtraction, charge smear removal and flat fielding. The pipeline removes noise using algorithms and data generated by a combination of ground-based and in-flight calibrations. The conversion to physical units is in terms of reflectance (that is, radiance factor or I/F). All image data used in this analysis are described in terms of reflectance. The absolute accuracy of the radiometric calibration is set by the in-flight calibration using images of the Moon taken during the OSIRIS-REx Earth Gravity Assist (EGA). We compare these images, taken with each of the cameras and with each of MapCam’s filters, with images taken by the RObotic Lunar Observatory (ROLO)53 . We use the ROLO bands that most closely match the OCAMS filters: 475 nm for b´, 553 nm for v, 703 nm for w, 865 nm for x and 665 nm for pan. We scale the ROLO data to match the phase angle of the OCAMS EGA images, ~42°, using the ROLO photometric model of the lunar surface. We register the ROLO data to their backplanes and project them into a common equal-area map and then back-project the data into OCAMS camera space. Because the ROLO and OCAMS acquired their images with different illumination conditions, we photometrically correct the ROLO and OCAMS data with a McEwen model54 . Moreover, because the ROLO and OCAMS images view different portions of the Moon, we reduce the area of the OCAMS images to match the ROLO images. We can then directly compare ROLO and OCAMS data by taking a ratio of the images projected into the same space. This comparison is noisy due to the imperfect registration between the two images. Therefore, we calculate a histogram of the image ratio and reduce the dataset to pixels that are within two standard deviations of the mean. This outlier rejection reduces the noise and effectively eliminates limb pixels, which have non-physical values after photometric correction. We take the mean of the remaining pixels to produce the correction to the OCAMS radiometric calibration. Global mosaic of Bennu. The global mosaic of Bennu in Fig. 2 was constructed using calibrated PolyCam images in units of I/F taken on 1 December 2018 over a full 4.3-h rotational period of Bennu. The images were taken between 05:13:11 and 09:11:41 utc when the spacecraft’s distance to Bennu was between 30.3 and 31.6 km. The corresponding spatial scale of the images was between 0.41 and 0.43 m pixel–1 , while the phase angle of the observation changed between 33.7° and 35.7°. Additional MapCam images from 13 December 2018 were added to fill in the south pole (–Z). These images were taken between 00:47:30 and 05:04:57 utc. Spacecraft distance was between 8.93 and 11.09 km. The pixel resolution of the images was between 1.600 and 1.885 m pixel–1 with phase angles between 39.3° and 56.2°. The global mosaic was constructed using the software and methods described in ref. 55 . No photometric correction was performed before mosaicking. However, a process similar to the ISIS3 noseam application was applied to minimize the presence of seams and to improve the cosmetic quality of the mosaic. Finally, some images were manually placed in areas where the automatic image prioritization mosaicking scheme yielded imperfect results. All geographic coordinates in this paper use a 0–360° convention for longitude. Boulder size-frequency distribution and albedo calculations. OSIRIS-REx Mission Terminology defines a feature as a boulder if it has positive relief and a diameter ≥21 cm, a size that is consistent with the diameter of the TAGSAM annular aperture. In that Mission Terminology, ‘cobbles’ are particles between 2 and 21 cm, and regolith fines are all particles smaller than 2 cm (that is, ingestible by the sampling mechanism). We use this terminology throughout the paper. For the purposes of counting a boulder towards the statistical population of particles on Bennu’s surface, these objects must also have a definable perimeter that is not partially buried and be characterized by the consistent presence of an elongated shadow. Accordingly, the partially exposed dark boulder outcrop at (–20° latitude, 30° longitude) is not counted within the size-frequency distribution we report, as its full extent remains unknown. Boulders in this dataset were identified across seven PolyCam images taken on 1 December 2018, covering a full rotational period of Bennu. The images were taken between 05:13:11 and 09:11:41 utc when the spacecraft’s distance to Bennu was between 30.3 and 31.6 km. The corresponding spatial scale of these images was between 0.41 and 0.43 m pixel–1 , while the phase angle of the observation changed between 33.7° and 35.7°. Using the geographic information system software ArcMap, boulders were manually identified in OCAMS images using polylines. The longest axis dimension was measured; for simplicity we refer to this as boulder diameter. The positions of polyline geometries are linked to the body-fixed Cartesian coordinates from OCAMS geometric backplanes, which were calculated using the ISIS3 spiceinit routine and the v13 shape model of Bennu, with an average facet size of 75 cm (ref. 3 ). The polyline endpoints and the midpoint are recorded and used to calculate boulder length. This technique allows us to identify boulders on unprojected images that have not been resampled. Reflectances for each boulder were extracted from the midpoint of each polyline to avoid shadowed pixels that often occur at measurement endpoints. Reflectances were converted to normal albedo using the Lommel–Seeliger disk function and an exponential phase function (see section ‘Resolved photometric modelling’) to correct I/F values to 0° phase angle, 0° emission angle, and 0° incidence angle (0°, 0°, 0°). Boulders with reflectances below 0.03 were not included in this analysis as manual inspection of several low-reflectance boulders indicate shadowing. Likewise, boulders identified at incidence or emission angles ≥70° were excluded as reflectance values after photometric correction with a Lommel–Seeliger disk function may become unphysical as those angles approach 90°. We consider bright boulders to be >6.8% normal albedo, which represents boulders that exceed 1σ of the mean boulder albedo for the global population of boulders presented here. In Fig. 3, we plot the global unbinned CSFD of boulders on Bennu in logarithmic space. In Fig. 4b, we plot the unbinned cumulative size-frequency distribution per normal albedo in logarithmic space. For each dataset, we assume the number of boulders detected follows a Poisson distribution56 . Thus, measurement uncertainty for individual boulders is captured as the square root of the number of boulders greater than or equal to D, normalized by surface area. We use surface area of 0.786 km2 derived from the v13 shape model3 . Completeness limits used to determine CSFDs were estimated from the data using a statistical approach to limit individual judgement in the assessment of data completeness. Specifically, we follow the technique in ref. 57 and applied it to boulder size-frequency distributions in ref. 58 . Accordingly, completeness is defined as the smallest value above which the differences between the probability distributions of the measured data and a best-fit power-law model are minimized. The distance between both distributions is quantified using the Kolmogorov– Smirnov statistic. We estimated the uncertainty for each completeness limit by performing a non-parametric bootstrap. This randomly samples the measurements with replacement to produce 1,000 synthetic datasets of a similar distribution, estimating the completeness limit for each, and taking the standard deviation. For the global population, we estimate a completeness limit of 8.4 ± 1.7 m, for the bright albedo population, 5.0 ± 0.5 m, and for the average albedo population, 5.1 ± 1.1 m. The difference in the completeness limits between the global boulder dataset and the datasets per albedo likely indicates that multiple statistically distinct boulder populations exist at scales <8.4 ± 1.7 m, which cannot be adequately modelled by a single power-law distribution. The method of maximum likelihood is used to estimate the power-law index57,58 . We estimated uncertainty in the power-law index in the same manner as the completeness limit by performing a non-parametric bootstrap. The resulting uncertainty value is the standard deviation of the synthetic datasets produced during the bootstrap. For the global population, we estimate a power-law index of −2.9 ± 0.3, for the bright albedo population, −4.4 ± 0.7, and for the average albedo population, −2.5 ± 0.2. The larger uncertainty associated with the bright 10 m Fig. 6 | Dark diffuse units. The inset shows one of the observed dark diffuse units on Bennu. Low-albedo (~3.4%) material blankets underlying terrain with a global average albedo. The central boulder mantled by dark material is at approximately –65° latitude, 32° longitude. The image has a phase angle of 4.292° and pixel scale of 3.546 m pixel–1 . This image has been stretched to highlight units of dark material. Nature Astronomy | www.nature.com/natureastronomy
- 7. ArticlesNATURE ASTROnOmy population of boulders is likely a result of the relatively smaller number of boulders in this dataset. Observations and preparation of OTES and OVIRS thermal radiance. The disk- integrated, rotationally resolved OVIRS data used in the thermal analysis were obtained on 2 and 3 November 2018. Observations began at 04:12 utc each day. Exposure times were ~1 s, and spectra were taken continuously for ~4.35 h (slightly more than one full rotation of Bennu). On 2 November, the spacecraft–Bennu distance, Bennu heliocentric distance, and phase angle were ~197 km, 1.041 au, and 5.1°, and Bennu filled ~0.37 of the field of view (FOV). On 3 November, these values were ~190 km, 1.037 au, 4.5°, and ~0.39. We began our analysis with the L3a radiometrically corrected OVIRS radiance spectra. The OVIRS spectra of Bennu are dominated by thermal radiance at λ ≳ 3 μm. We restricted thermal analysis of OVIRS to λ = 3.5–4.0 μm, where the thermal radiance is ~8 to 25 times the reflected radiance. To isolate the thermal radiance, we estimated the reflected radiance by scaling the solar spectrum to each OVIRS measurement at ~2.1 μm and subtracted this estimate from the total measured radiance (Supplementary Fig. 8). We then binned the remaining thermal radiance to 1° rotation phase for analysis. The disk-integrated, rotationally resolved OTES data used in the thermal analysis were obtained on 8 and 9 November 2018. Observations began at 04:13 utc each day. Exposure times were ~2 s, and spectra were taken continuously for ~4.49 h. On 8 November, the spacecraft–Bennu distance, Bennu heliocentric distance, and phase angle were ~162 km, 1.021 au, and 4.5°, and Bennu filled ~0.14 of the FOV. On 3 November, these values were ~159 km, 1.018 au, 5.7°, and ~0.15. Bennu was not perfectly centred in the OTES FOV, and the asymmetric filling caused calibration complications for this Fourier-transform infrared (FTIR) spectrometer11 . For the analysis presented here, neither the absolute radiometric nor the relative spectral calibrations were completed. Analysis of the OTES disk- integrated Approach phase data was therefore restricted to fitting relative thermal lightcurves of different wavelength channels independently. As with OVIRS, the relative thermal flux was binned to 1° rotation phase for analysis. We also reanalysed previous observations of Bennu by the Spitzer space telescope using the updated shape and spin state determined by OSIRIS-REx. Details of the Spitzer data can be found in ref. 12 , and results of the reanalysis can be found in the Supplementary Information. For analysis of all thermal data, we used the shape model (v13) determined from stereophotoclinometry performed on images of Bennu taken with OCAMS3 and the corresponding spin pole and rotation period (RA = 85.3 ± 0.2°, Dec = −60.2 ± 0.2°, rotation period = 4.296061 ± 2 × 10⁻⁶ h). For thermal analysis, the facet size of the shape model we used was ~12 m. For topography (including boulders) larger than this scale, the effects of surface tilts, shadowing, and global self-heating are directly computed. The effects of roughness from smaller-scale topography, including smaller boulders, are included using hemispherical craters to simulate that sub- resolution-element roughness. Thermal model and data fitting. The thermophysical analysis reported here uses a custom code that is based on the Advanced Thermophysical Model (ATPM)46,59,60 . For a given set of input parameters (that is, shape model, rotation period and pole orientation, illumination and viewing geometry, Bond albedo, emissivity, and thermal inertia), the ATPM computes the surface temperature distribution of an asteroid by solving 1D heat conduction with a surface boundary condition that takes into account direct and multiple-scattered sunlight, and also self-shadowing and self-heating effects resulting from interfacing surfaces. Rough surface thermal- infrared beaming (that is, re-radiation of absorbed sunlight back towards the Sun by small-scale surface roughness) is modelled by adding a fractional coverage of hemispherical craters to each shape model facet. The model flux is then computed from the model temperatures by summing the Planck function across facets and parts of hemispherical craters that were visible to the observer at the time of the measurements. For the analysis of the thermal data of Bennu, surface temperature distributions and model fluxes were computed for thermal inertias that ranged from 0 to 600 J m−2 K−1 s−1/2 in equally spaced steps of 10 J m−2 K−1 s−1/2 . We use a Bond albedo of 0.016, based on the measured geometric albedo and phase behaviour, and assume bolometric and spectral emissivities of 0.9. The assumption of 0.9 for bolometric emissivity is typical of silicate materials at these wavelengths, and constant spectral emissivity is consistent with the low spectral contrast of Bennu in the mid-infrared (<2%) measured by OTES11 and laboratory spectra of carbonaceous meteorites. To derive the thermal properties of Bennu, the model fluxes were compared against the measured fluxes by varying the rotation phase (that is, the initial rotational orientation of Bennu at the start of the flux measurements), thermal inertia, and surface roughness to find the minimum χ2 fit of the dataset analysed. The uncertainties of the derived thermal properties were assessed by using a Monte Carlo bootstrap method43 that produced 100 synthetic test datasets from the uncertainties of the original dataset (that is, including both the individual data point uncertainties and the instrument absolute calibration uncertainties). The minimum χ2 fit was sought for each synthetic dataset, and their best fitting parameters were then averaged to give a mean and standard deviation of the overall model fit. We used this Monte Carlo bootstrap method for assessing the final uncertainties instead of a reduced-χ2 cut-off because it more accurately takes into account the influence of systematic uncertainties introduced by the instrument absolute calibration. Calculation of thermal skin depth and characteristic particle size. The thermal skin depth is the depth over which the amplitude of the thermal wave decreases by e−1 and is given by ρ ω ~ Γ l c 2 (1)s p where Γ is thermal inertia, cp is heat capacity, ρ is grain density and ω is the rate of temperature variation—the rotation rate of the asteroid in the case of the diurnal skin depth. From the measured thermal inertia and uncertainties, and given the range of heat capacities (500 to 1,100 J kg−1 K−1 ) and densities (2,000 to 2,900 kg m−3 ), the diurnal skin depth on Bennu is 0.8 to 3.0 cm. Analytical methods to estimate regolith particle size from thermal inertia on airless bodies use models of heat conduction across particle contacts and radiation between particles calibrated through laboratory experiments13,61–63 . The general method consists of computing the effective regolith thermal conductivity from the measured thermal inertia, calculating a modelled effective thermal conductivity as a function of particle size considering both solid conduction and radiation terms for reasonable ranges of regolith properties and model parameters, then comparing the measured and modelled effective conductivities to find the particle size(s) where they agree. We employ the methods of refs. 13,61,62 with calibration of the parameters ξ and ζ from ref. 64 for a wide range (0.1 to 0.9) of possible regolith porosities (that is, space between regolith grain, distinct from the boulder porosity discussed in the main text), in order to examine extremes of resulting particle sizes. Resulting modelled regolith particle diameters are 0.5 to 4 cm. It is important to note that these simple analytical methods assume that all regolith particles are the same size (that is, monodisperse), which is physically unrealistic. These modelled particle sizes are therefore a thermally characteristic particle size that may not be the same as the average physical regolith particle diameter. For a power-law particle size distribution, the thermal flux is dominated by the smaller grains in the distribution. The estimates here, therefore, should not be taken to suggest that the regolith does not contain perhaps many larger particles (or boulders). Resolved photometric modelling. As this paper presents the first results from preliminary OSIRIS-REx data, we have opted to use empirical photometric functions due to their simple mathematical form and fewer free parameters than physically motivated models (such as Hapke, Shkuratov, and so on). When multiple scattering is not significant (that is, for low-reflectance asteroids), the disk function and phase function can be separated in functional forms6 . In this work, we choose to use an exponential phase function and use the Lommel–Seeliger disk function. The disk behaviour of low-reflectance objects (geometric albedo < 0.2) has been shown to generally follow a Lommel–Seeliger scattering law6 . To produce the phase plots shown in the main text, we processed images taken by MapCam in each of its five filters (b´, v, w, x and pan2 ) during two mission phases. The first were acquired between 29 October and 9 November during OSIRIS-REx’s Approach phase, during which time Bennu subtended at most 50 pixels across its diameter. These data contribute to the low end of the phase curve, between 0 and 20°. The second group was acquired during the Equatorial Pass of the Preliminary Survey phase, between 11 and 15 December. In these data, Bennu subtended between 400 and 900 pixels in MapCam’s field of view, covering a range of phase angles from 45° to 90°. Photometric statistics were calculated for each image individually by treating Bennu’s surface as a global average. To identify the pixels that will contribute to the average, we apply a reflectance threshold to the images. This threshold was 0.2 for the Approach images, where Bennu’s limb was not clearly defined, and 0.001 for the Preliminary Survey images, where the limb was clear. Both thresholds were set by inspection to include uniformly illuminated portions of the surface, rejecting off-limb and terminator pixels. The average of the pixels that pass the appropriate threshold for a given image is the mean reflectance for that image. To obtain photometric angles, the images are imported into the United States Geological Survey’s ISIS3 using the data import program ocams2isis. We attach observation geometry to each image using kernels from the Spacecraft, Planet, Instrument, C-matrix, Events (SPICE) Toolkit developed by NASA’s Navigation and Ancillary Information Facility65 . We also attach the geometry from the v13 shape model to the images. The ISIS3 application phocube produces backplanes for the images, including phase, incidence and emission angle. We calculate the average of each of these backplanes to get the mean photometric angles for each image. A summary of these statistics (mean reflectance, phase, incidence and emission) are compiled in an Image Photometric Data Information File (IPDIF). We smooth the data by averaging together images that fall within bins that are 1° wide in phase angle. The binned data are plotted to produce the reflectance curve shown in Fig. 1. We process the unbinned IPDIF with a photometric modelling script, written in Interactive Data Language (IDL), to fit the data against a Lommel–Seeliger model. This model includes the Lommel–Seeliger disk function, shown in equation (2), and an exponential phase function, shown in equation (3)6 . The modelling Nature Astronomy | www.nature.com/natureastronomy
- 8. Articles NATURE ASTROnOmy software solves for the free parameters β, γ and δ; the disk function has no free parameters. = + d i e i i e ( , ) cos( ) cos( ) cos( ) (2) α = β α γ α δ α+ + f A( ) e * * * (3)LS 2 3 We fit the data from each of the five filters to the model independently, using the mpfit tool in IDL. However, the variation between them is subtle; for clarity, Fig. 1 depicts the phase curve of the spectral average, with fit parameters of ALS = 0.0265; β = −3.55 × 10⁻² ; γ = 3.074 × 10⁻⁴ ; and δ = −1.889 × 10⁻⁶ . Though the fit is generally good (χ2 ~ 3 × 10⁻⁵ ), we note some extreme ends of the phase angle range (due to the opposition surge, though minor, at the low phase angles; due to shadowing and high incidence angles at high phase angles). The exponential phase function used here does not perfectly capture those nuances, but represents the bulk of the surface behaviour well. Geometric albedo is estimated by extrapolating the reflectance phase curves to 0° phase angle. As the exponential phase curve used in our model does not have a term to account for opposition surge, we perform a linear extrapolation from 0.7–2° to the 0° phase angle as these data show a change in slope that departs from the best-fit exponential function. The reflectance ratio in Fig. 1 is calculating by dividing the binned reflectance data for the b′, w, and x filters by the data from the v filter. We further normalize the data to the v filter at 0° phase and plot them as a function of phase to illustrate the reddening that occurs at high phase. Taking the ratio of the data eliminates the need to track absolute radiometry uncertainty. However, a relative uncertainty of ~0.5% remains due to the sub-spacecraft position and the point in Bennu’s orbit at which the image data were acquired. These two factors affect Bennu’s apparent reflectance due to changes in Bennu’s projected area and its albedo variation. Code availability The thermophysical analysis reported here uses a custom code that is based on the Advanced Thermophysical Model (ATPM) of refs. 46,59,60 . The ISIS3 code used to generate the image processing data products is available from the US Geological Survey–Astrogeology Science Center: https://isis.astrogeology.usgs.gov/ Data availability The data that support the plots within this paper and other findings of this study are available from the corresponding authors upon reasonable request. Raw (L0) through calibrated (L2, L3) OCAMS, OVIRS and OTES data will be available via the Planetary Data System (PDS) (https://sbn.psi.edu/pds/resource/orex/). Data are released to the PDS according to the schedule provided in the OSIRIS-REx Data Management Plan found in the OSIRIS-REx PDS archive. Image mosaics and photometric models will be available in the PDS 1 year after departure from the asteroid. Received: 31 January 2019; Accepted: 19 February 2019; Published: xx xx xxxx References 1. Lauretta, D. S. et al. The OSIRIS-REx target asteroid (101955) Bennu: constraints on its physical, geological, and dynamical nature from astronomical observations. Meteorit. Planet. Sci. 50, 834–849 (2015). 2. Rizk, B. et al. OCAMS: the OSIRIS-REx camera suite. Space Sci. Rev. 214, 26 (2018). 3. Barnouin, O. S. et al. Shape of (101955) Bennu indicative of a rubble pile with internal stiffness. Nat. Geosci. https://doi.org/10.1038/s41561-019- 0330-x(2019). 4. Reuter, D. C. et al. The OSIRIS-REx visible and infrared spectrometer (OVIRS): spectral maps of the asteroid Bennu. Space Sci. Rev. 214, 54 (2018). 5. Christensen, P. R. et al. The OSIRIS-REx thermal emission spectrometer (OTES) instrument. Space Sci. Rev. 214, 87 (2018). 6. Li, J.-Y., Helfenstein, P., Buratti, B., Takir, D. & Clark, B. E. in Asteroids IV (eds Michel, P., DeMeo, F. E. & Bottke, W. F.) 277–326 (Univ. of Arizona Press, Tucson, 2015). 7. Hergenrother, C. W. et al. Lightcurve, color and phase function photometry of the OSIRIS-REx target asteroid (101955) Bennu. Icarus 226, 663–670 (2013). 8. Alí-Lagoa, V. et al. Differences between the Pallas collisional family and similarly sized B-type asteroids. Astron. Astrophys. 591, A14 (2016). 9. Hergenrother, C. W. et al. Operational environment and rotational acceleration of asteroid (101955) Bennu from OSIRIS-REx observations. Nat. Commun. https://doi.org/10.1038/s41467-019-09213-x (2019). 10. Clark, B. E. et al. Asteroid (101955) 1999 RQ36: spectroscopy from 0.4 to 2.4μm and meteorite analogs. Icarus 216, 462–475 (2011). 11. Hamilton, V. E. et al. Evidence for widespread hydrated minerals on asteroid (101955) Bennu. Nat. Astron. https://doi.org/10.1038/s41550-019-0722-2 (2019). 12. Emery, J. P. et al. Thermal infrared observations and thermophysical characterization of OSIRIS-REx target asteroid (101955) Bennu. Icarus 234, 17–35 (2014). 13. Gundlach, B. & Blum, J. A new method to determine the grain size of planetary regolith. Icarus 223, 479–492 (2013). 14. Delbo’, M., Mueller, M., Emery, J. P., Rozitis, B. & Capria, M. T. in Asteroids IV (eds Michel, P., DeMeo, F. E. & Bottke, W. F.) 107–128 (Univ. of Arizona Press, Tucson, 2015). 15. Jakosky, B. M. On the thermal properties of Martian fines. Icarus 66, 117–124 (1986). 16. Opeil, C. P., Consolmagno, G. J. & Britt, D. T. The thermal conductivity of meteorites: new measurements and analysis. Icarus 208, 449–454 (2010). 17. Walsh, K. J. Rubble pile asteroids. Annu. Rev. Astron. Astrophys. 56, 593–624 (2018). 18. Walsh, K. J. et al. Craters, boulders and regolith of (101955) Bennu indicative of an old and dynamic surface. Nat. Geosci. https://doi.org/10.1038/ s41561-019-0326-6 (2019). 19. Lauretta, D. S. et al. The unexpected surface of asteroid (101955) Bennu. Nature https://doi.org/10.1038/s41586-019-1033-6 (2019). 20. Nolan, M. C. et al. Shape model and surface properties of the OSIRIS-REx target Asteroid (101955) Bennu from radar and lightcurve observations. Icarus 226, 629–640 (2013). 21. Mazrouei, S., Daly, M. G., Barnouin, O. S., Ernst, C. M. & DeSouza, I. Block distributions on Itokawa. Icarus 229, 181–189 (2014). 22. Michikami, T. et al. Size-frequency statistics of boulders on global surface of asteroid 25143 Itokawa. Earth Planets Space 60, 13–20 (2008). 23. Scheeres, D. J. et al. The dynamic geophysical environment of (101955) Bennu based on OSIRIS-REx measurements. Nat. Astron. https://doi. org/10.1038/s41550-019-0721-3 (2019). 24. Lee, P. et al. Ejecta blocks on 243 Ida and on other asteroids. Icarus 120, 87–105 (1996). 25. Michel, P., Benz, W., Tanga, P. & Richardson, D. C. Collisions and gravitational reaccumulation: forming asteroid families and satellites. Science 294, 1696–1700 (2001). 26. Delbo’, M. et al. Thermal fatigue as the origin of regolith on small asteroids. Nature 508, 233–236 (2014). 27. Opeil, C. P., Consolmagno, G. J., Safarik, D. J. & Britt, D. T. Stony meteorite thermal properties and their relationship with meteorite chemical and physical states. Meteorit. Planet. Sci. 47, 319–329 (2012). 28. Müller, T. G., Sekiguchi, T., Kaasalainen, M., Abe, M. & Hasegawa, S. Thermal infrared observations of the Hayabusa spacecraft target asteroid 25143 Itokawa. Astron. Astrophys. 443, 347–355 (2005). 29. Rodgers, D. J., Ernst, C. M., Barnouin, O. S., Murchie, S. L. & Chabot, N. L. Methodology for finding and evaluating safe landing sites on small bodies. Planet. Space Sci. 134, 71–81 (2016). 30. Müller, T. G. et al. Hayabusa-2 mission target asteroid 162173 Ryugu (1999 JU 3): searching for the object’s spin-axis orientation. Astron. Astrophys. 599, A103 (2017). 31. Sugita, S. et al. The geomorphology, color, and thermal properties of Ryugu: implications for parent-body processes. Science https://doi.org/10.1126/ science.aaw0422 (in the press). 32. Saito, J. et al. Detailed Images of asteroid 25143 Itokawa from Hayabusa. Science 312, 1341–1344 (2006). 33. Murchie, S. et al. Color variations on Eros from NEAR multispectral imaging. Icarus 155, 145–168 (2002). 34. Riner, M. A., Robinson, M. S., Eckart, J. M. & Desch, S. J. Global survey of color variations on 433 Eros: implications for regolith processes and asteroid environments. Icarus 198, 67–76 (2008). 35. Lantz, C., Binzel, R. P. & DeMeo, F. E. Space weathering trends on carbonaceous asteroids: a possible explanation for Bennu’s blue slope? Icarus 302, 10–17 (2018). 36. Thompson, M. S., Loeffler, M. J., Morris, R. V., Keller, L. P. & Christoffersen, R. Spectral and chemical effects of simulated space weathering of the Murchison CM2 carbonaceous chondrite. Icarus 319, 499–511 (2019). 37. Johnson, T. V. & Fanale, F. P. Optical properties of carbonaceous chondrites and their relationship to asteroids. J. Geophys. Res. 78, 8507–8518 (1973). 38. Sanchez, J. A. et al. Phase reddening on near-Earth asteroids: implications for mineralogical analysis, space weathering and taxonomic classification. Icarus 220, 36–50 (2012). 39. Li, J. et al. Spectrophotometric modeling and mapping of Ceres. Icarus 322, 144–167 (2019). 40. Muinonen, K. et al. Asteroid photometric and polarimetric phase curves: joint linear-exponential modeling. Meteorit. Planet. Sci. 44, 1937–1946 (2009). 41. Pilorget, C., Fernando, J., Ehlmann, B. L., Schmidt, F. & Hiroi, T. Wavelength dependence of scattering properties in the VIS-NIR and links with grain-scale physical and compositional properties. Icarus 267, 296–314 (2016). Nature Astronomy | www.nature.com/natureastronomy
- 9. ArticlesNATURE ASTROnOmy 42. Rozitis, B. The surface roughness of (433) Eros as measured by thermal- infrared beaming. Mon. Not. R. Astron. Soc. 464, 915–923 (2017). 43. Rozitis, B., Green, S. F., MacLennan, E. & Emery, J. P. Observing the variation of asteroid thermal inertia with heliocentric distance. Mon. Not. R. Astron. Soc. 477, 1782–1802 (2018). 44. Rozitis, B. & Green, S. F. Physical characterisation of near-Earth asteroid (1620) Geographos. Astron. Astrophys. 568, A43 (2014). 45. Spencer, J. R. A rough-surface thermophysical model for airless planets. Icarus 83, 27–38 (1990). 46. Rozitis, B. & Green, S. F. Directional characteristics of thermal-infrared beaming from atmosphereless planetary surfaces—a new thermophysical model. Mon. Not. R. Astron. Soc. 415, 2042–2062 (2011). 47. Jaumann, R. et al. Surface geomorphology of near earth asteroid (162173) Ryugu from in-situ observations: first results from the MASCOT camera. In Am. Geophys. Union Fall Meet. 2018 abstr. P21A-03 (American Geophysical Union, 2018). 48. Nakamura, A. M., Fujiwara, A. & Kadono, T. Velocity of finer fragments from impact. Planet. Space Sci. 42, 1043–1052 (1994). 49. Hanuš, J., Delbo’, M., Ďurech, J. & Alí-Lagoa, V. Thermophysical modeling of main-belt asteroids from WISE thermal data. Icarus 309, 297–337 (2018). 50. Nagao, K. et al. Irradiation history of Itokawa regolith material deduced from noble gases in the Hayabusa samples. Science 333, 1128–1131 (2011). 51. Scheeres, D. J., Hartzell, C. M., Sánchez, P. & Swift, M. Scaling forces to asteroid surfaces: the role of cohesion. Icarus 210, 968–984 (2010). 52. Lauretta, D. S. et al. OSIRIS-REx: sample return from asteroid (101955) Bennu. Space Sci. Rev. 212, 925–984 (2017). 53. Kieffer, H. H. & Stone, T. C. The spectral irradiance of the Moon. Astron. J. 129, 2887–2901 (2005). 54. McEwen, A. S. A precise lunar photometric function. Lunar Planet. Sci. 27, 841–842 (1996). 55. DellaGiustina, D. N. et al. Overcoming the challenges associated with image-based mapping of small bodies in preparation for the OSIRIS-REx mission to (101955) Bennu. Earth Space Sci. 5, 929–949 (2018). 56. Uni-, W. et al. Standard techniques for presentation and analysis of crater size-frequency data. Icarus 37, 467–474 (1979). 57. Clauset, A., Shalizi, C. R. & Newman, M. E. J. Power-law distributions in empirical data. SIAM Rev. 51, 661–703 (2009). 58. DeSouza, I., Daly, M. G., Barnouin, O. S., Ernst, C. M. & Bierhaus, E. B. Improved techniques for size-frequency distribution analysis in the planetary sciences: application to blocks on 25143 Itokawa. Icarus 247, 77–80 (2015). 59. Rozitis, B. & Green, S. F. The influence of rough surface thermal-infrared beaming on the Yarkovsky and YORP effects. Mon. Not. R. Astron. Soc. 423, 367–388 (2012). 60. Rozitis, B. & Green, S. F. The influence of global self-heating on the Yarkovsky and YORP effects. Mon. Not. R. Astron. Soc. 433, 603–621 (2013). 61. Gundlach, B. & Blum, J. Outgassing of icy bodies in the Solar System—II: Heat transport in dry, porous surface dust layers. Icarus 219, 618–629 (2012). 62. Sakatani, N. et al. Thermal conductivity model for powdered materials under vacuum based on experimental studies. AIP Adv. 7, 015310 (2017). 63. Sakatani, N., Ogawa, K., Arakawa, M. & Tanaka, S. Thermal conductivity of lunar regolith simulant JSC-1A under vacuum. Icarus 309, 13–24 (2018). 64. Ryan, A. J. Heat and Mass Transfer on Planetary Surfaces PhD thesis, Arizona State Univ. (2018). 65. Acton, C., Bachman, N., Semenov, B. & Wright, E. A look towards the future in the handling of space science mission geometry. Planet. Space Sci. 150, 9–12 (2018). 66. Gault, B. D. E., Shoemaker, E. M. & Moore, H. J. Spray Ejected From The Lunar Surface By Meteoroid Impact (NASA, 1963). 67. Moore, H. J. in Analysis of Apollo 10: Photography and Visual Observations 24–26 (NASA, 1971). 68. Bart, G. D. & Melosh, H. J. Using lunar boulders to distinguish primary from distant secondary impact craters. Geophys. Res. Lett. 34, L07203 (2007). Acknowledgements This material is based upon work supported by NASA under contract NNM10AA11C issued through the New Frontiers Program. We thank C. Ernst for providing the data used in Supplementary Fig. 4 to compare the size-frequency distribution of boulders on Bennu to other small bodies. B.R. acknowledges funding support from the Royal Astronomical Society in the form of a research fellowship. P.M. acknowledges funding support from the French space agency CNES and from Academies of Excellence: Complex systems and Space, environment, risk, and resilience, part of the IDEX JEDI of the Université Côte d’Azur. M.A.B., J.D.P.D. and S.F. also acknowledge financial support from CNES the French space agency. M.P. acknowledges funding support from the Italian Space Agency (ASI) under the ASI-INAF agreement no. 2017–37-H.0. Part of this work was performed at the Jet Propulsion Laboratory, California Institute of Technology under contract with the National Aeronautics and Space Administration. S.R.S. acknowledges support from NASA Grant no. 80NSSC18K0226 as part of the OSIRIS- REx Participating Scientist Program. Author contributions D.N.D. leads the OSIRIS-REx Image Processing Working Group (IPWG). J.P.E. leads the OSIRIS-REx Thermal Analysis Working Group (TAWG). Both led the analysis and paper writing efforts. M.A.B., C.A.B., K.N.B., H.C., J.d.L., C.Y.D.d’A., S.F., D.R.G., C.H., E.S.H., H.H.K., T.K., L.L.C., J.-Y.L., J.L., J.L.R.G., P.M., M.N., M.P., D.C.R., B.R., P.H.S., E.T., C.A.T. and X.-D.Z. contributed to the image processing analysis of MapCam images. O.S.B., K.J.B., C.A.B., D.R.G. and C.H. contributed to the production of the global mosaic. E.A., R.-L.B., O.S.B., C.A.B., E.B.B., W.F.B., K.N.B., H.C., H.C.C.Jr, M.D., M.D., C.M.E., E.R.J., P.M., J.M., M.N., M.P., A.R., S.R.S., E.T. and K.J.W. contributed to the interpretation of the boulder size-frequency distribution. B.E.C., J.D.P.D., C.Y.D.d’A., S.F., D.R.G., C.H., E.S.H., J.-Y.L., B.R., N.S., A.A.S., P.H.S. and X.-D.Z. contributed to the interpretation of the photometric model. E.A., R.-L.B., J.L.B., O.S.B., R.P.B., W.F.B., N.B., P.R.C., B.C.C., M.D., C.M.E., V.E.H., E.S.H., E.R.J., T.K., L.F.L., J.M., M.N., M.P., D.C.R., B.R., A.R., S.R.S., M.A.S., A.A.S., E.T., C.A.T. and K.J.W. contributed to the interpretation of the thermophysical measurements. N.B., P.R.C., L.F.L., B.R. and M.A.S. contributed to the analysis or calibration of thermal data. D.N.D., C.Y.D.d’A., J.P.E., D.R.G., V.E.H., C.H., L.F.L., D.C.R., B.R. and A.A.S. contributed to the planning of observations. K.J.B., C.Y.D.d’A., D.R.G., E.S.H., B.R., N.S., P.H.S. and X.-D.Z. contributed to the calibration of image data. D.S.L. leads the mission and contributed significantly to the analysis. C.W.V.W. contributed substantially to the content and writing of the paper. The entire OSIRIS-REx Team made the encounter with Bennu possible. Competing interests The authors declare no competing interests. Additional information Supplementary information is available for this paper at https://doi.org/10.1038/ s41550-019-0731-1. Reprints and permissions information is available at www.nature.com/reprints. Correspondence and requests for materials should be addressed to D.N.D. or J.P.E. Publisher’s note: Springer Nature remains neutral with regard to jurisdictional claims in published maps and institutional affiliations. © The Author(s), under exclusive licence to Springer Nature Limited 2019 The OSIRIS-REx Team D. E. Highsmith27 , J. Small27 , D. Vokrouhlický28 , N. E. Bowles12 , E. Brown12 , K. L. Donaldson Hanna12 , T. Warren12 , C. Brunet29 , R. A. Chicoine29 , S. Desjardins29 , D. Gaudreau29 , T. Haltigin29 , S. Millington-Veloza29 , A. Rubi29 , J. Aponte30 , N. Gorius29 , A. Lunsford29 , B. Allen31 , J. Grindlay31 , D. Guevel31 , D. Hoak31 , J. Hong31 , D. L. Schrader32 , J. Bayron33 , O. Golubov34 , P. Sánchez34 , J. Stromberg35 , M. Hirabayashi36 , C. M. Hartzell37 , S. Oliver38 , M. Rascon38 , A. Harch39 , J. Joseph39 , S. Squyres39 , D. Richardson40 , J. P. Emery2 , L. McGraw16 , R. Ghent41 , R. P. Binzel11 , M. M. Al Asad42 , C. L. Johnson21,42 , L. Philpott42 , H. C. M. Susorney42 , E. A. Cloutis43 , R. D. Hanna44 , H. C. Connolly Jr.15 , F. Ciceri45 , A. R. Hildebrand45 , E.-M. Ibrahim45 , Nature Astronomy | www.nature.com/natureastronomy
- 10. Articles NATURE ASTROnOmy L. Breitenfeld46 , T. Glotch46 , A. D. Rogers46 , B. E. Clark14 , S. Ferrone14 , C. A. Thomas24 , H. Campins13 , Y. Fernandez13 , W. Chang47 , A. Cheuvront48 , D. Trang49 , S. Tachibana50 , H. Yurimoto50 , J. R. Brucato51 , G. Poggiali51 , M. Pajola22 , E. Dotto52 , E. Mazzotta Epifani52 , M. K. Crombie53 , C. Lantz54 , M. R. M. Izawa55 , J. de Leon17 , J. Licandro17 , J. L. Rizos Garcia17 , S. Clemett56 , K. Thomas-Keprta56 , S. Van wal57 , M. Yoshikawa57 , J. Bellerose19 , S. Bhaskaran19 , C. Boyles19 , S. R. Chesley19 , C. M. Elder19 , D. Farnocchia19 , A. Harbison19 , B. Kennedy19 , A. Knight19 , N. Martinez-Vlasoff19 , N. Mastrodemos19 , T. McElrath19 , W. Owen19 , R. Park19 , B. Rush19 , L. Swanson19 , Y. Takahashi19 , D. Velez19 , K. Yetter19 , C. Thayer58 , C. Adam59 , P. Antreasian59 , J. Bauman59 , C. Bryan59 , B. Carcich59 , M. Corvin59 , J. Geeraert59 , J. Hoffman59 , J. M. Leonard59 , E. Lessac-Chenen59 , A. Levine59 , J. McAdams59 , L. McCarthy59 , D. Nelson59 , B. Page59 , J. Pelgrift59 , E. Sahr59 , K. Stakkestad59 , D. Stanbridge59 , D. Wibben59 , B. Williams59 , K. Williams59 , P. Wolff59 , P. Hayne60 , D. Kubitschek60 , M. A. Barucci9 , J. D. P. Deshapriya9 , S. Fornasier9 , M. Fulchignoni9 , P. Hasselmann9 , F. Merlin9 , A. Praet9 , E. B. Bierhaus10 , O. Billett10 , A. Boggs10 , B. Buck10 , S. Carlson-Kelly10 , J. Cerna10 , K. Chaffin10 , E. Church10 , M. Coltrin10 , J. Daly10 , A. Deguzman10 , R. Dubisher10 , D. Eckart10 , D. Ellis10 , P. Falkenstern10 , A. Fisher10 , M. E. Fisher10 , P. Fleming10 , K. Fortney10 , S. Francis10 , S. Freund10 , S. Gonzales10 , P. Haas10 , A. Hasten10 , D. Hauf10 , A. Hilbert10 , D. Howell10 , F. Jaen10 , N. Jayakody10 , M. Jenkins10 , K. Johnson10 , M. Lefevre10 , H. Ma10 , C. Mario10 , K. Martin10 , C. May10 , M. McGee10 , B. Miller10 , C. Miller10 , G. Miller10 , A. Mirfakhrai10 , E. Muhle10 , C. Norman10 , R. Olds10 , C. Parish10 , M. Ryle10 , M. Schmitzer10 , P. Sherman10 , M. Skeen10 , M. Susak10 , B. Sutter10 , Q. Tran10 , C. Welch10 , R. Witherspoon10 , J. Wood10 , J. Zareski10 , M. Arvizu-Jakubicki1 , E. Asphaug1 , E. Audi1 , R.-L. Ballouz1 , R. Bandrowski1 , K. J. Becker1 , T. L. Becker1 , S. Bendall1 , C. A. Bennett1 , H. Bloomenthal1 , D. Blum1 , W. V. Boynton1 , J. Brodbeck1 , K. N. Burke1 , M. Chojnacki1 , A. Colpo1 , J. Contreras1 , J. Cutts1 , C. Y. Drouet d’Aubigny1 , D. Dean1 , D. N. DellaGiustina1 , B. Diallo1 , D. Drinnon1 , K. Drozd1 , H. L. Enos1 , R. Enos1 , C. Fellows1 , T. Ferro1 , M. R. Fisher1 , G. Fitzgibbon1 , M. Fitzgibbon1 , J. Forelli1 , T. Forrester1 , I. Galinsky1 , R. Garcia1 , A. Gardner1 , D. R. Golish1 , N. Habib1 , D. Hamara1 , D. Hammond1 , K. Hanley1 , K. Harshman1 , C. W. Hergenrother1 , K. Herzog1 , D. Hill1 , C. Hoekenga1 , S. Hooven1 , E. S. Howell1 , E. Huettner1 , A. Janakus1 , J. Jones1 , T. R. Kareta1 , J. Kidd1 , K. Kingsbury1 , S. S. Balram-Knutson1 , L. Koelbel1 , J. Kreiner1 , D. Lambert1 , D. S. Lauretta1 , C. Lewin1 , B. Lovelace1 , M. Loveridge1 , M. Lujan1 , C. K. Maleszewski1 , R. Malhotra1 , K. Marchese1 , E. McDonough1 , N. Mogk1 , V. Morrison1 , E. Morton1 , R. Munoz1 , J. Nelson1 , M. C. Nolan1 , J. Padilla1 , R. Pennington1 , A. Polit1 , N. Ramos1 , V. Reddy1 , M. Riehl1 , B. Rizk1 , H. L. Roper1 , S. Salazar1 , S. R. Schwartz1 , S. Selznick1 , N. Shultz1 , P. H. Smith1 , S. Stewart1 , S. Sutton1 , T. Swindle1 , Y. H. Tang1 , M. Westermann1 , C. W. V. Wolner1 , D. Worden1 , T. Zega1 , Z. Zeszut1 , A. Bjurstrom61 , L. Bloomquist61 , C. Dickinson61 , E. Keates61 , J. Liang61 , V. Nifo61 , A. Taylor61 , F. Teti61 , M. Caplinger62 , H. Bowles63 , S. Carter63 , S. Dickenshied63 , D. Doerres63 , T. Fisher63 , W. Hagee63 , J. Hill63 , M. Miner63 , D. Noss63 , N. Piacentine63 , M. Smith63 , A. Toland63 , P. Wren63 , M. Bernacki64 , D. Pino Munoz64 , S.-i. Watanabe57,65 , S. A. Sandford66 , A. Aqueche6 , B. Ashman6 , M. Barker6 , A. Bartels6 , K. Berry6 , B. Bos6 , R. Burns6 , A. Calloway6 , R. Carpenter6 , N. Castro6 , R. Cosentino6 , J. Donaldson6 , J. P. Dworkin6 , J. Elsila Cook6 , C. Emr6 , D. Everett6 , D. Fennell6 , K. Fleshman6 , D. Folta6 , D. Gallagher6 , J. Garvin6 , K. Getzandanner6 , D. Glavin6 , S. Hull6 , K. Hyde6 , H. Ido6 , A. Ingegneri6 , N. Jones6 , P. Kaotira6 , L. F. Lim6 , A. Liounis6 , C. Lorentson6 , D. Lorenz6 , J. Lyzhoft6 , E. M. Mazarico6 , R. Mink6 , W. Moore6 , M. Moreau6 , S. Mullen6 , J. Nagy6 , G. Neumann6 , J. Nuth6 , D. Poland6 , D. C. Reuter6 , L. Rhoads6 , S. Rieger6 , D. Rowlands6 , D. Sallitt6 , A. Scroggins6 , G. Shaw6 , A. A. Simon6 , J. Swenson6 , P. Vasudeva6 , M. Wasser6 , R. Zellar6 , J. Grossman67 , G. Johnston67 , M. Morris67 , J. Wendel67 , A. Burton68 , L. P. Keller68 , L. McNamara68 , S. Messenger68 , K. Nakamura-Messenger68 , A. Nguyen68 , K. Righter68 , E. Queen69 , Nature Astronomy | www.nature.com/natureastronomy
- 11. ArticlesNATURE ASTROnOmy K. Bellamy70 , K. Dill70 , S. Gardner70 , M. Giuntini70 , B. Key70 , J. Kissell70 , D. Patterson70 , D. Vaughan70 , B. Wright70 , R. W. Gaskell21 , L. Le Corre21 , J.-Y. Li21 , J. L. Molaro21 , E. E. Palmer21 , M. A. Siegler21 , P. Tricarico21 , J. R. Weirich21 , X.-D. Zou21 , T. Ireland71 , K. Tait72 , P. Bland73 , S. Anwar4 , N. Bojorquez-Murphy4 , P. R. Christensen4 , C. W. Haberle4 , G. Mehall4 , K. Rios4 , I. Franchi3 , B. Rozitis3 , C. B. Beddingfield74 , J. Marshall74 , D. N. Brack75 , A. S. French75 , J. W. McMahon75 , D. J. Scheeres75 , E. R. Jawin20 , T. J. McCoy20 , S. Russell20 , M. Killgore76 , W. F. Bottke5 , V. E. Hamilton5 , H. H. Kaplan5 , K. J. Walsh5 , J. L. Bandfield7 , B. C. Clark7 , M. Chodas77 , M. Lambert77 , R. A. Masterson77 , M. G. Daly16 , J. Freemantle16 , J. A. Seabrook16 , O. S. Barnouin8 , K. Craft8 , R. T. Daly8 , C. Ernst8 , R. C. Espiritu8 , M. Holdridge8 , M. Jones8 , A. H. Nair8 , L. Nguyen8 , J. Peachey8 , M. E. Perry8 , J. Plescia8 , J. H. Roberts8 , R. Steele8 , R. Turner8 , J. Backer78 , K. Edmundson78 , J. Mapel78 , M. Milazzo78 , S. Sides78 , C. Manzoni79 , B. May79 , M. Delbo’18 , G. Libourel18 , P. Michel18 , A. Ryan18 , F. Thuillet18 and B. Marty80 27 Aerospace Corporation, Chantilly, VA, USA. 28 Astronomical Institute, Charles University, Prague, Czech Republic. 29 Canadian Space Agency, Saint- Hubert, Quebec, Canada. 30 Catholic University of America, Washington, DC, USA. 31 Center for Astrophysics, Harvard University, Cambridge, MA, USA. 32 Center for Meteorite Studies, Arizona State University, Tempe, AZ, USA. 33 City University of New York, New York, NY, USA. 34 Colorado Center for Astrodynamics Research, University of Colorado, Boulder, CO, USA. 35 Commonwealth Scientific and Industrial Research Organisation (CSIRO), Canberra, Australian Capital Territory, Australia. 36 Department of Aerospace Engineering, Auburn University, Auburn, AL, USA. 37 Department of Aerospace Engineering, University of Maryland, College Park, MD, USA. 38 Department of Astronomy and Steward Observatory, University of Arizona, Tuscon, AZ, USA. 39 Department of Astronomy, Cornell University, Ithaca, NY, USA. 40 Department of Astronomy, University of Maryland, College Park, MD, USA. 41 Department of Earth Sciences, University of Toronto, Toronto, Ontario, Canada. 42 Department of Earth, Ocean and Atmospheric Sciences, University of British Columbia, Vancouver, British Columbia, Canada. 43 Department of Geography, University of Winnipeg, Winnipeg, Manitoba, Canada. 44 Department of Geological Sciences, Jackson School of Geosciences, University of Texas, Austin, TX, USA. 45 Department of Geoscience, University of Calgary, Calgary, Alberta, Canada. 46 Department of Geosciences, Stony Brook University, Stony Brook, NY, USA. 47 Edge Space Systems, Greenbelt, MD, USA. 48 General Dynamics C4 Systems, Denver, CO, USA. 49 Hawaiʻi Institute of Geophysics and Planetology, University of Hawaiʻi at Mānoa, Honolulu, HI, USA. 50 Hokkaido University, Sapporo, Japan. 51 INAF–Astrophysical Observatory of Arcetri, Florence, Italy. 52 INAF–Osservatorio Astronomico di Roma, Rome, Italy. 53 Indigo Information Services, Tucson, AZ, USA. 54 Institut d’Astrophysique Spatiale, CNRS/Université Paris Sud, Orsay, France. 55 Institute for Planetary Materials, Okayama University–Misasa, Misasa, Japan. 56 Jacobs Technology, Houston, TX, USA. 57 JAXA Institute of Space and Astronautical Science, Sagamihara, Japan. 58 Kavli Institute for Astrophysics and Space Research, Massachusetts Institute of Technology, Cambridge, MA, USA. 59 KinetX Aerospace, Inc., Simi Valley, CA, USA. 60 Laboratory for Atmospheric and Space Physics, University of Colorado, Boulder, CO, USA. 61 Macdonald, Dettwiler, and Associates, Brampton, Ontario, Canada. 62 Malin Space Science Systems, San Diego, CA, USA. 63 Mars Space Flight Facility, Arizona State University, Tempe, AZ, USA. 64 Mines ParisTech, Paris, France. 65 Nagoya University, Nagoya, Japan. 66 NASA Ames Research Center, Moffett Field, CA, USA. 67 NASA Headquarters, Washington, DC, USA. 68 NASA Johnson Space Center, Houston, TX, USA. 69 NASA Langley Research Center, Hampton, VA, USA. 70 NASA Marshall Space Flight Center, Huntsville, AL, USA. 71 Research School of Earth Sciences, Australian National University, Canberra, Australian Capital Territory, Australia. 72 Royal Ontario Museum, Toronto, Ontario, Canada. 73 School of Earth and Planetary Sciences, Curtin University, Perth, Western Australia, Australia. 74 SETI Institute, Mountain View, CA, USA. 75 Smead Department of Aerospace Engineering, University of Colorado, Boulder, CO, USA. 76 Southwest Meteorite Laboratory, Payson, AZ, USA. 77 Space Systems Laboratory, Department of Aeronautics and Astronautics, Massachusetts Institute of Technology, Cambridge, MA, USA. 78 US Geological Survey Astrogeology Science Center, Flagstaff, AZ, USA. 79 London Stereoscopic Company, London, UK. 80 Université de Lorraine, Nancy, France. Nature Astronomy | www.nature.com/natureastronomy