SlideShare una empresa de Scribd logo
1 de 6
Descargar para leer sin conexión
Community-based Disaster Risk Reduction Project
Bicol Region, Philippines

MULTI-HAZARD MAPPING
using Geographic Information System (GIS)
Multi-Hazard Mapping using GIS

ACF Disaster Risk Reduction (DRR) Project has been
implemented in Camarines Sur and Catanduanes with the
objective of reducing the population’s vulnerability of
population to natural disasters.

Hazards like typhoon, landslide, flood, storm surge,
tsunami, and earthquake poses risks to life, property and
livehood compounded by physical exposure and proximity
to hazard-prone areas, socio-economic, and cultural and
behavioral conditions.
An integral part of disaster risk reduction undertaken by
this project is the Geographic Information System (GIS)based Multi-hazard Mapping conducted in pilot barangays
from the two provinces. The process of multi-hazard m
apping integrates different hazard-related information for
specific areas to convey a composite picture of natural
hazards in varying magnitude, frequence and areas of
effect.
Combination of spatial analysis and local knowledge of
communities are essential inputs in producing
multi-hazard maps. Local knowledge of communities are
gathered through Participatory Capacity and Vulnerability
Assessment (PCVA) where community members develop
community hazard and resource maps.

Using GIS, maps are produced through the integration of spatial data
and local community knowledge. GIS aids in efficient development,
storage, updating, access and sharing of multi-hazard mapping
information.The availability of reliable multi-hazard maps are
important risk assessment tools providing relevant information
essential for community planning and decision making, especially in
emergency response, and disaster preparedness and mitigation.

Key Concepts in Multi-Hazard Mapping
HAZARD: “A potentially damaging physical event, phenomenon or
human activity that may cause loss of life or injury, property damage,
social and economic disruption or environmental degradation. Hazards
include latent conditions representing future threats and can have
different origins: natural (geological, hydrometeorological, biological)
or induced by human processes (environmental degradation and
technological hazards). Hazards can be single, sequential or combined
in their origin and effects. Each hazard is characterised by its location, intensity, frequency and probability.”
GEOGRAPHIC INFORMATION SYSTEM (GIS): “Analysis that combine
relational databases with spatial interpretation and outputs often in
form of maps. More elaborate definition is that of computer
programmes for capturing, storing, checking, integrating, analysing
and displaying data about the earth that is spatially referenced. GIS
are increasingly being utilised for hazard and vulnerability mapping
and analysis, as well as for the application of disaster risk
management measures.”
		
*Source: UN International Strategy for Disaster Reduction, 2004
The Process of Multi-Hazard Mapping using GIS

Data acquired from primary and secondary
sources were subject for field validation,
ground truthing and accuracy check and
cleaned up based on spatial and non-spatial
data.
Primary data were collected from Global
Positioning System (GPS) survey with
georectified NAMRIA map and images from
Google Earth, community consultation and
use of PCVA community maps developed by
community members including barangay
council and representatives from women,
elderly, and youth sectors. Secondary data
were collected from NAMRIA, PHIVOLCS, and
Google Earth.

Relevant data are integrated, consolidated,
and encoded in Microsoft Excel spreadsheet.
Each datum identified is classified according
to groups (i.e. Elevation, Northing, Easting,
etc.). This process brings data into the
electronic environment.
Database creation starts when encoded data
are processed through GIS software
developing a database for hazard maps per
barangay (i.e. Flood hazard map, Landslide
hazard map, etc.) with non-spatial
attributes associated to spatial features (i.e.
Longitude-Latitude) coming up with
topology and themes allowing for iterative
and interactive pair-wise comparison.

Analysis on data gathered for multi-hazard
mapping and risk assessment focused on
features and corresponding position on
Hydro-Meteorological Hazard and Siesmic
Hazard maps from national data
incorporating local knowledge from the
barangays. Spatial analysis tools are used to
model, predict and reach conclusions
include geometrics manipulation and
analysis including data projection, joining
tables, vertex adjustment, features
symbology, GPS data integration.
Data Storage is the process of storing
analyzed and manipulated data. On-screen
digitizing of maps was done.

Data Exporting and Product Generation were
done with the completion of maps. Outputs
can be in the form of maps and other
illustrations like charts, graphs, tabular
reports depending on what specific
information are required to be generated.

Maps were presented to and reviewied by
partner DCCs from regional, provincial, and
municipal levels particularly to key persons
involved with local development planning
and disaster management, and partner
agencies like PAGASA, PHIVOLCS, and MGB
Region V. Revisions were incorporated based
on inputs gathered.
Maps are printed and published in an
interactive GIS stand-alone environment
for CD distribution using HTML environment
together with a Multi-Hazard Brochure.
Uses of Multi-Hazard Maps
Hazard and Risk Identification
Impact of natural disasters can be minimized
significantly if proper and timely information is
available. Multi-hazard mapping process supports the
requirement of availability of relevant information
since the first step in producing multi-hazard maps
is the identification of hazards and risks. Information
about areas that maybe affected by various hazards
and location of vulnerable elements such as
population, buildings, infrastructure, livelihood
sources.
Emergency Response
During disasters, local government units (LGUs) are
under extreme pressure to make abrupt decisions
affecting thousands of people, often with limited time
to analyze situations and undertake actions.
Maps are cartographically simple with information
enabling local chief executives to make prompt and
appropriate responses especially in emergencies. Maps
help LGUs identify, prioritize, and allocate resources
to vulnerable population in high risk areas for safe
evacuation, rescue, relief and rehabilitation.

Risk Management and Local Development
Planning
Hazard mapping is a crucial guide in optimizing
development gains and minimizing potential loss
of physical assets, human resources, and
environmental capital.
Mainstreaming multi-hazard mapping into local
development planning is essential to effective
disaster risk management. The link between DRR
and population growth, physical demands of
human settlement, economic planning and
appropriate use of land should be recognized by
LGUs.
Maps contained and updated in local planning
information database are useful documents for
crafting of disaster risk management plans, local
development plans, water management plans,
tourism plans, land-use plans, zoning and other
land use regulations.
Possible Problems in Multi-hazard Mapping
Data quality from reliable sources is an important consideration
contributing to the multi-hazard mapping process credibility. Hence,
LGUs need to be aware to anticipate possible problems that may be
encountered in undertaking this activity, and take necessary actions to
ensure that outputs produced are of high quality.
Lack of or Outdated Cadastral Base Maps
In many areas, updated cadastral maps may not be available to be
used as base maps in preparing accurate hazard maps. Using old base
maps might lead to inaccurate boundaries and other physical
structures, and will not represent the area’s real situation. Hence, GISbased multi-hazard mapping should use updated base maps.
Differences between Available Base Maps

Capacity Building
Investment on capacity building activities should be done to
ensure active community participation and equip LGUs with
technical staff possessing knowledge, skills, and equipment to
successfully perform multi-hazard mapping.
Participatory Capacity and Vulnerability Assessment (PCVA)
Community inputs are essential in mapping process, hence,
community involvement is important. Communities where
areas are subject for mapping should be aware with clear
understanding of the purpose and importance of multi-hazard
mapping. PCVA can be used as a venue were barangay council
members, and sector representatives from women, elderly,
livelihood and youth jointly participate in mapping hazards in
their areas based from first-hand experience.

Discrepancies maybe observed in geospatial features like rivers and
coastal boundaries when using maps from varied sources due to
differences in dates. For example, NAMRIA maps were gathered in
1950s while Google Earth images are dated 2000. Hence, LGUs should
determine base map source to be used or if using multiple base map
sources, clearly indicate differences in the hazard maps produced.

Training on Multi-Hazard Mapping using GIS

Change of Geo-spatial Features Over Time

Provision of Hardware and Software

Dynamic environmental variations, human settlements and activities
bring changes to geo-spatial features of areas. Hence, regularly
updating of map information and conducting field validation are
necessary to maintain validity, accuracy and reliability of the hazard
maps.

Computer, GPS devices, and GIS software are needed to
develop, store, and update hazard maps. Hardware with
at least Pentium III with 128RAM and 64MB video card, GPS
device of any model, and Operating System (Cross platforms).
Softwares range from open source to paid.

Local development planners, disaster risk managers, and
technicians in-charge of producing and updating require
trainings, especially on software use since GIS skills are
software-specific.
With the
aid of GIS

technology,

risk information is

just one

click away!

Multi-hazard Mapping using Geographic Information System
(GIS) is a pilot activity of ACF under its Disaster Risk
Reduction (DRR) Project. This information material includes
a brochure and a CD.
The brochure describes the importance, process and
possible problems faced in multi-hazard mapping with the
aim of informing LGUs intending to pursue and replicate this
activity in their localities. The CD contains the multi-hazard
map database covering ACF project areas and are intended
for use and subject for updating of respective provincial
and municipal governments.

Más contenido relacionado

La actualidad más candente

Role of gis in climate change
Role of gis in climate changeRole of gis in climate change
Role of gis in climate changeSalar Saeed Dogar
 
Remote Sensing and GIS in Land Use / Land Cover Mapping
Remote Sensing and GIS in Land Use / Land Cover MappingRemote Sensing and GIS in Land Use / Land Cover Mapping
Remote Sensing and GIS in Land Use / Land Cover MappingVenkatKamal1
 
Flood Mapping using GIS
Flood Mapping using GISFlood Mapping using GIS
Flood Mapping using GISPrabhas Gupta
 
Hazard, vulnerability, risk
Hazard, vulnerability, riskHazard, vulnerability, risk
Hazard, vulnerability, riskMd Asif Hasan
 
Vulnerability Mapping (Vulnerability Assessment)
Vulnerability Mapping (Vulnerability Assessment)Vulnerability Mapping (Vulnerability Assessment)
Vulnerability Mapping (Vulnerability Assessment)ESD UNU-IAS
 
drought monitoring and management using remote sensing
drought monitoring and management using remote sensingdrought monitoring and management using remote sensing
drought monitoring and management using remote sensingveerendra manduri
 
EARLY WARNING SYSTEM(EWS)
EARLY WARNING SYSTEM(EWS)EARLY WARNING SYSTEM(EWS)
EARLY WARNING SYSTEM(EWS)umang talpara
 
Concept of disaster, hazard, vulnerability, exposure, capacity
Concept of disaster, hazard, vulnerability, exposure, capacityConcept of disaster, hazard, vulnerability, exposure, capacity
Concept of disaster, hazard, vulnerability, exposure, capacityDr. Fayaz Ahmad Malla
 
Flood risk mapping using GIS and remote sensing
Flood risk mapping using GIS and remote sensingFlood risk mapping using GIS and remote sensing
Flood risk mapping using GIS and remote sensingRohan Tuteja
 
LANDSLIDE HAZARD ZONATION MAPPING USING RS AND GIS
LANDSLIDE HAZARD ZONATION MAPPING USING RS AND GISLANDSLIDE HAZARD ZONATION MAPPING USING RS AND GIS
LANDSLIDE HAZARD ZONATION MAPPING USING RS AND GISAditya Ghumare
 
Application of gis in natural disaster management
Application of gis in natural disaster managementApplication of gis in natural disaster management
Application of gis in natural disaster managementMuhammad Sajjad
 
Early warning System Disaster Management
Early warning System Disaster ManagementEarly warning System Disaster Management
Early warning System Disaster ManagementVraj Pandya
 
Basic of gis concept and theories
Basic of gis concept and theoriesBasic of gis concept and theories
Basic of gis concept and theoriesMohsin Siddique
 
Role of GIS and remote sensing in Disaster Management
  Role of GIS and remote sensing in Disaster Management  Role of GIS and remote sensing in Disaster Management
Role of GIS and remote sensing in Disaster ManagementLeema Margret A
 

La actualidad más candente (20)

Role of gis in climate change
Role of gis in climate changeRole of gis in climate change
Role of gis in climate change
 
Remote Sensing and GIS in Land Use / Land Cover Mapping
Remote Sensing and GIS in Land Use / Land Cover MappingRemote Sensing and GIS in Land Use / Land Cover Mapping
Remote Sensing and GIS in Land Use / Land Cover Mapping
 
Flood Mapping using GIS
Flood Mapping using GISFlood Mapping using GIS
Flood Mapping using GIS
 
Digital elevation model in GIS
Digital elevation model in GISDigital elevation model in GIS
Digital elevation model in GIS
 
Hazard, vulnerability, risk
Hazard, vulnerability, riskHazard, vulnerability, risk
Hazard, vulnerability, risk
 
GIS IN DISASTER MANAGEMENT
GIS IN DISASTER MANAGEMENTGIS IN DISASTER MANAGEMENT
GIS IN DISASTER MANAGEMENT
 
Vulnerability Mapping (Vulnerability Assessment)
Vulnerability Mapping (Vulnerability Assessment)Vulnerability Mapping (Vulnerability Assessment)
Vulnerability Mapping (Vulnerability Assessment)
 
drought monitoring and management using remote sensing
drought monitoring and management using remote sensingdrought monitoring and management using remote sensing
drought monitoring and management using remote sensing
 
EARLY WARNING SYSTEM(EWS)
EARLY WARNING SYSTEM(EWS)EARLY WARNING SYSTEM(EWS)
EARLY WARNING SYSTEM(EWS)
 
Concept of disaster, hazard, vulnerability, exposure, capacity
Concept of disaster, hazard, vulnerability, exposure, capacityConcept of disaster, hazard, vulnerability, exposure, capacity
Concept of disaster, hazard, vulnerability, exposure, capacity
 
Flood risk mapping using GIS and remote sensing
Flood risk mapping using GIS and remote sensingFlood risk mapping using GIS and remote sensing
Flood risk mapping using GIS and remote sensing
 
LANDSLIDE HAZARD ZONATION MAPPING USING RS AND GIS
LANDSLIDE HAZARD ZONATION MAPPING USING RS AND GISLANDSLIDE HAZARD ZONATION MAPPING USING RS AND GIS
LANDSLIDE HAZARD ZONATION MAPPING USING RS AND GIS
 
Components of GIS
Components of GISComponents of GIS
Components of GIS
 
GIS data structure
GIS data structureGIS data structure
GIS data structure
 
Land use cover pptx.
Land use cover pptx.Land use cover pptx.
Land use cover pptx.
 
Application of gis in natural disaster management
Application of gis in natural disaster managementApplication of gis in natural disaster management
Application of gis in natural disaster management
 
Early warning System Disaster Management
Early warning System Disaster ManagementEarly warning System Disaster Management
Early warning System Disaster Management
 
Basic of gis concept and theories
Basic of gis concept and theoriesBasic of gis concept and theories
Basic of gis concept and theories
 
Role of GIS and remote sensing in Disaster Management
  Role of GIS and remote sensing in Disaster Management  Role of GIS and remote sensing in Disaster Management
Role of GIS and remote sensing in Disaster Management
 
Geoprocessing
GeoprocessingGeoprocessing
Geoprocessing
 

Destacado

Participatory 3-Dimensional Mapping (P3DM) for Disaster Risk Reduction
Participatory 3-Dimensional Mapping (P3DM) for Disaster Risk ReductionParticipatory 3-Dimensional Mapping (P3DM) for Disaster Risk Reduction
Participatory 3-Dimensional Mapping (P3DM) for Disaster Risk ReductionGiacomo Rambaldi
 
disaster risk reduction w GIS
disaster risk reduction w GISdisaster risk reduction w GIS
disaster risk reduction w GISFaik Sofyan
 
Mapping Piedmont Landforms in Arizona Using ArcGIS and the Trimble GeoXT Hand...
Mapping Piedmont Landforms in Arizona Using ArcGIS and the Trimble GeoXT Hand...Mapping Piedmont Landforms in Arizona Using ArcGIS and the Trimble GeoXT Hand...
Mapping Piedmont Landforms in Arizona Using ArcGIS and the Trimble GeoXT Hand...Ayres Associates (Anthony Alvarado)
 
Pg thesis document_guidelines final
Pg thesis document_guidelines finalPg thesis document_guidelines final
Pg thesis document_guidelines finalgopal22041981
 
Manelyn L. Mananap Thesis (Chapter 3)
Manelyn L. Mananap Thesis (Chapter 3)Manelyn L. Mananap Thesis (Chapter 3)
Manelyn L. Mananap Thesis (Chapter 3)mtlobrido
 
Global Positioning System
Global Positioning SystemGlobal Positioning System
Global Positioning SystemRishi Shukla
 
Gps tracking system
Gps tracking system Gps tracking system
Gps tracking system Sumit Kumar
 

Destacado (9)

Participatory 3-Dimensional Mapping (P3DM) for Disaster Risk Reduction
Participatory 3-Dimensional Mapping (P3DM) for Disaster Risk ReductionParticipatory 3-Dimensional Mapping (P3DM) for Disaster Risk Reduction
Participatory 3-Dimensional Mapping (P3DM) for Disaster Risk Reduction
 
disaster risk reduction w GIS
disaster risk reduction w GISdisaster risk reduction w GIS
disaster risk reduction w GIS
 
Mapping Piedmont Landforms in Arizona Using ArcGIS and the Trimble GeoXT Hand...
Mapping Piedmont Landforms in Arizona Using ArcGIS and the Trimble GeoXT Hand...Mapping Piedmont Landforms in Arizona Using ArcGIS and the Trimble GeoXT Hand...
Mapping Piedmont Landforms in Arizona Using ArcGIS and the Trimble GeoXT Hand...
 
Pg thesis document_guidelines final
Pg thesis document_guidelines finalPg thesis document_guidelines final
Pg thesis document_guidelines final
 
Manelyn L. Mananap Thesis (Chapter 3)
Manelyn L. Mananap Thesis (Chapter 3)Manelyn L. Mananap Thesis (Chapter 3)
Manelyn L. Mananap Thesis (Chapter 3)
 
Format thesis
Format thesisFormat thesis
Format thesis
 
Chapter iii
Chapter iiiChapter iii
Chapter iii
 
Global Positioning System
Global Positioning SystemGlobal Positioning System
Global Positioning System
 
Gps tracking system
Gps tracking system Gps tracking system
Gps tracking system
 

Similar a Process of hazard mapping

GIS for risk assesment.pptx
GIS for risk assesment.pptxGIS for risk assesment.pptx
GIS for risk assesment.pptxZahidAyoub4
 
Digital cartography and natural disaster management
Digital cartography and natural disaster managementDigital cartography and natural disaster management
Digital cartography and natural disaster managementGCUF
 
Gis applications in tourism a tool for sustainable tourism
Gis applications in tourism  a tool for sustainable tourismGis applications in tourism  a tool for sustainable tourism
Gis applications in tourism a tool for sustainable tourismpankaj kumar
 
Basics of Disater And its Management.pdf
Basics of Disater And its Management.pdfBasics of Disater And its Management.pdf
Basics of Disater And its Management.pdfRanjitZende2
 
Gis in disaster managemant
Gis  in disaster managemantGis  in disaster managemant
Gis in disaster managemantnisarg gandhi
 
Geographical Information System and Karnataka Forest cover digitization
Geographical Information System and Karnataka Forest cover digitizationGeographical Information System and Karnataka Forest cover digitization
Geographical Information System and Karnataka Forest cover digitizationKamlesh Kumar
 
Essays on Geography and GIS, Vol. 3
Essays on Geography and GIS, Vol. 3Essays on Geography and GIS, Vol. 3
Essays on Geography and GIS, Vol. 3Esri
 
GIS for Comprehensive Emergency Management
GIS for Comprehensive Emergency ManagementGIS for Comprehensive Emergency Management
GIS for Comprehensive Emergency ManagementEsri
 
Role of Geologists in Natural Hazard Mapping and Application_Dr Kyi Khin_MGSS...
Role of Geologists in Natural Hazard Mapping and Application_Dr Kyi Khin_MGSS...Role of Geologists in Natural Hazard Mapping and Application_Dr Kyi Khin_MGSS...
Role of Geologists in Natural Hazard Mapping and Application_Dr Kyi Khin_MGSS...KYI KHIN
 
CY_2022_DOST_GIA_Approved_Projects_from_January_to_September_2022.pdf
CY_2022_DOST_GIA_Approved_Projects_from_January_to_September_2022.pdfCY_2022_DOST_GIA_Approved_Projects_from_January_to_September_2022.pdf
CY_2022_DOST_GIA_Approved_Projects_from_January_to_September_2022.pdfnancydoloriel1
 
Iirs lecture space inputs to disaster management in india
Iirs lecture space inputs to disaster management in indiaIirs lecture space inputs to disaster management in india
Iirs lecture space inputs to disaster management in indiaTushar Dholakia
 
Disaster risk reduction in the Hindu Kush – Himalayan Region
Disaster risk reduction in the Hindu Kush – Himalayan RegionDisaster risk reduction in the Hindu Kush – Himalayan Region
Disaster risk reduction in the Hindu Kush – Himalayan RegionGlobal Risk Forum GRFDavos
 
Allinsite warankqa 1 ¨demo¨ (1)
Allinsite   warankqa 1 ¨demo¨ (1)Allinsite   warankqa 1 ¨demo¨ (1)
Allinsite warankqa 1 ¨demo¨ (1)MarcelineHR
 
GIS in South America
GIS in South AmericaGIS in South America
GIS in South AmericaEsri
 
Santillan assessing the-impacts_of_flooding_caused_by_extreme_rainfall_events...
Santillan assessing the-impacts_of_flooding_caused_by_extreme_rainfall_events...Santillan assessing the-impacts_of_flooding_caused_by_extreme_rainfall_events...
Santillan assessing the-impacts_of_flooding_caused_by_extreme_rainfall_events...Vanrosco
 
Study of Multihazard on urban habitats of India: A case study of Ahmedabad City
Study of Multihazard on urban habitats of India: A case study of Ahmedabad CityStudy of Multihazard on urban habitats of India: A case study of Ahmedabad City
Study of Multihazard on urban habitats of India: A case study of Ahmedabad CityIEI GSC
 
Tanzania mapping groups Morogoro flooding Erick.pdf
Tanzania mapping groups Morogoro flooding Erick.pdfTanzania mapping groups Morogoro flooding Erick.pdf
Tanzania mapping groups Morogoro flooding Erick.pdfJanet Chapman
 

Similar a Process of hazard mapping (20)

GIS for risk assesment.pptx
GIS for risk assesment.pptxGIS for risk assesment.pptx
GIS for risk assesment.pptx
 
Digital cartography and natural disaster management
Digital cartography and natural disaster managementDigital cartography and natural disaster management
Digital cartography and natural disaster management
 
Gis applications in tourism a tool for sustainable tourism
Gis applications in tourism  a tool for sustainable tourismGis applications in tourism  a tool for sustainable tourism
Gis applications in tourism a tool for sustainable tourism
 
Presentation on gis and future trends
Presentation on gis and future trendsPresentation on gis and future trends
Presentation on gis and future trends
 
Basics of Disater And its Management.pdf
Basics of Disater And its Management.pdfBasics of Disater And its Management.pdf
Basics of Disater And its Management.pdf
 
Gis in disaster managemant
Gis  in disaster managemantGis  in disaster managemant
Gis in disaster managemant
 
Geographical Information System and Karnataka Forest cover digitization
Geographical Information System and Karnataka Forest cover digitizationGeographical Information System and Karnataka Forest cover digitization
Geographical Information System and Karnataka Forest cover digitization
 
Essays on Geography and GIS, Vol. 3
Essays on Geography and GIS, Vol. 3Essays on Geography and GIS, Vol. 3
Essays on Geography and GIS, Vol. 3
 
GIS for Comprehensive Emergency Management
GIS for Comprehensive Emergency ManagementGIS for Comprehensive Emergency Management
GIS for Comprehensive Emergency Management
 
Role of Geologists in Natural Hazard Mapping and Application_Dr Kyi Khin_MGSS...
Role of Geologists in Natural Hazard Mapping and Application_Dr Kyi Khin_MGSS...Role of Geologists in Natural Hazard Mapping and Application_Dr Kyi Khin_MGSS...
Role of Geologists in Natural Hazard Mapping and Application_Dr Kyi Khin_MGSS...
 
Mod 2 part 1.pdf
Mod 2 part 1.pdfMod 2 part 1.pdf
Mod 2 part 1.pdf
 
CY_2022_DOST_GIA_Approved_Projects_from_January_to_September_2022.pdf
CY_2022_DOST_GIA_Approved_Projects_from_January_to_September_2022.pdfCY_2022_DOST_GIA_Approved_Projects_from_January_to_September_2022.pdf
CY_2022_DOST_GIA_Approved_Projects_from_January_to_September_2022.pdf
 
GIS Interactive Web-Tool Austria-2009
GIS Interactive Web-Tool Austria-2009GIS Interactive Web-Tool Austria-2009
GIS Interactive Web-Tool Austria-2009
 
Iirs lecture space inputs to disaster management in india
Iirs lecture space inputs to disaster management in indiaIirs lecture space inputs to disaster management in india
Iirs lecture space inputs to disaster management in india
 
Disaster risk reduction in the Hindu Kush – Himalayan Region
Disaster risk reduction in the Hindu Kush – Himalayan RegionDisaster risk reduction in the Hindu Kush – Himalayan Region
Disaster risk reduction in the Hindu Kush – Himalayan Region
 
Allinsite warankqa 1 ¨demo¨ (1)
Allinsite   warankqa 1 ¨demo¨ (1)Allinsite   warankqa 1 ¨demo¨ (1)
Allinsite warankqa 1 ¨demo¨ (1)
 
GIS in South America
GIS in South AmericaGIS in South America
GIS in South America
 
Santillan assessing the-impacts_of_flooding_caused_by_extreme_rainfall_events...
Santillan assessing the-impacts_of_flooding_caused_by_extreme_rainfall_events...Santillan assessing the-impacts_of_flooding_caused_by_extreme_rainfall_events...
Santillan assessing the-impacts_of_flooding_caused_by_extreme_rainfall_events...
 
Study of Multihazard on urban habitats of India: A case study of Ahmedabad City
Study of Multihazard on urban habitats of India: A case study of Ahmedabad CityStudy of Multihazard on urban habitats of India: A case study of Ahmedabad City
Study of Multihazard on urban habitats of India: A case study of Ahmedabad City
 
Tanzania mapping groups Morogoro flooding Erick.pdf
Tanzania mapping groups Morogoro flooding Erick.pdfTanzania mapping groups Morogoro flooding Erick.pdf
Tanzania mapping groups Morogoro flooding Erick.pdf
 

Último

Activity 01 - Artificial Culture (1).pdf
Activity 01 - Artificial Culture (1).pdfActivity 01 - Artificial Culture (1).pdf
Activity 01 - Artificial Culture (1).pdfciinovamais
 
UGC NET Paper 1 Mathematical Reasoning & Aptitude.pdf
UGC NET Paper 1 Mathematical Reasoning & Aptitude.pdfUGC NET Paper 1 Mathematical Reasoning & Aptitude.pdf
UGC NET Paper 1 Mathematical Reasoning & Aptitude.pdfNirmal Dwivedi
 
Jual Obat Aborsi Hongkong ( Asli No.1 ) 085657271886 Obat Penggugur Kandungan...
Jual Obat Aborsi Hongkong ( Asli No.1 ) 085657271886 Obat Penggugur Kandungan...Jual Obat Aborsi Hongkong ( Asli No.1 ) 085657271886 Obat Penggugur Kandungan...
Jual Obat Aborsi Hongkong ( Asli No.1 ) 085657271886 Obat Penggugur Kandungan...ZurliaSoop
 
ICT role in 21st century education and it's challenges.
ICT role in 21st century education and it's challenges.ICT role in 21st century education and it's challenges.
ICT role in 21st century education and it's challenges.MaryamAhmad92
 
The basics of sentences session 3pptx.pptx
The basics of sentences session 3pptx.pptxThe basics of sentences session 3pptx.pptx
The basics of sentences session 3pptx.pptxheathfieldcps1
 
Understanding Accommodations and Modifications
Understanding  Accommodations and ModificationsUnderstanding  Accommodations and Modifications
Understanding Accommodations and ModificationsMJDuyan
 
Food safety_Challenges food safety laboratories_.pdf
Food safety_Challenges food safety laboratories_.pdfFood safety_Challenges food safety laboratories_.pdf
Food safety_Challenges food safety laboratories_.pdfSherif Taha
 
HMCS Max Bernays Pre-Deployment Brief (May 2024).pptx
HMCS Max Bernays Pre-Deployment Brief (May 2024).pptxHMCS Max Bernays Pre-Deployment Brief (May 2024).pptx
HMCS Max Bernays Pre-Deployment Brief (May 2024).pptxEsquimalt MFRC
 
Explore beautiful and ugly buildings. Mathematics helps us create beautiful d...
Explore beautiful and ugly buildings. Mathematics helps us create beautiful d...Explore beautiful and ugly buildings. Mathematics helps us create beautiful d...
Explore beautiful and ugly buildings. Mathematics helps us create beautiful d...christianmathematics
 
1029 - Danh muc Sach Giao Khoa 10 . pdf
1029 -  Danh muc Sach Giao Khoa 10 . pdf1029 -  Danh muc Sach Giao Khoa 10 . pdf
1029 - Danh muc Sach Giao Khoa 10 . pdfQucHHunhnh
 
Fostering Friendships - Enhancing Social Bonds in the Classroom
Fostering Friendships - Enhancing Social Bonds  in the ClassroomFostering Friendships - Enhancing Social Bonds  in the Classroom
Fostering Friendships - Enhancing Social Bonds in the ClassroomPooky Knightsmith
 
Holdier Curriculum Vitae (April 2024).pdf
Holdier Curriculum Vitae (April 2024).pdfHoldier Curriculum Vitae (April 2024).pdf
Holdier Curriculum Vitae (April 2024).pdfagholdier
 
SOC 101 Demonstration of Learning Presentation
SOC 101 Demonstration of Learning PresentationSOC 101 Demonstration of Learning Presentation
SOC 101 Demonstration of Learning Presentationcamerronhm
 
ComPTIA Overview | Comptia Security+ Book SY0-701
ComPTIA Overview | Comptia Security+ Book SY0-701ComPTIA Overview | Comptia Security+ Book SY0-701
ComPTIA Overview | Comptia Security+ Book SY0-701bronxfugly43
 
Application orientated numerical on hev.ppt
Application orientated numerical on hev.pptApplication orientated numerical on hev.ppt
Application orientated numerical on hev.pptRamjanShidvankar
 
Sociology 101 Demonstration of Learning Exhibit
Sociology 101 Demonstration of Learning ExhibitSociology 101 Demonstration of Learning Exhibit
Sociology 101 Demonstration of Learning Exhibitjbellavia9
 
Graduate Outcomes Presentation Slides - English
Graduate Outcomes Presentation Slides - EnglishGraduate Outcomes Presentation Slides - English
Graduate Outcomes Presentation Slides - Englishneillewis46
 
1029-Danh muc Sach Giao Khoa khoi 6.pdf
1029-Danh muc Sach Giao Khoa khoi  6.pdf1029-Danh muc Sach Giao Khoa khoi  6.pdf
1029-Danh muc Sach Giao Khoa khoi 6.pdfQucHHunhnh
 
Unit-IV; Professional Sales Representative (PSR).pptx
Unit-IV; Professional Sales Representative (PSR).pptxUnit-IV; Professional Sales Representative (PSR).pptx
Unit-IV; Professional Sales Representative (PSR).pptxVishalSingh1417
 
This PowerPoint helps students to consider the concept of infinity.
This PowerPoint helps students to consider the concept of infinity.This PowerPoint helps students to consider the concept of infinity.
This PowerPoint helps students to consider the concept of infinity.christianmathematics
 

Último (20)

Activity 01 - Artificial Culture (1).pdf
Activity 01 - Artificial Culture (1).pdfActivity 01 - Artificial Culture (1).pdf
Activity 01 - Artificial Culture (1).pdf
 
UGC NET Paper 1 Mathematical Reasoning & Aptitude.pdf
UGC NET Paper 1 Mathematical Reasoning & Aptitude.pdfUGC NET Paper 1 Mathematical Reasoning & Aptitude.pdf
UGC NET Paper 1 Mathematical Reasoning & Aptitude.pdf
 
Jual Obat Aborsi Hongkong ( Asli No.1 ) 085657271886 Obat Penggugur Kandungan...
Jual Obat Aborsi Hongkong ( Asli No.1 ) 085657271886 Obat Penggugur Kandungan...Jual Obat Aborsi Hongkong ( Asli No.1 ) 085657271886 Obat Penggugur Kandungan...
Jual Obat Aborsi Hongkong ( Asli No.1 ) 085657271886 Obat Penggugur Kandungan...
 
ICT role in 21st century education and it's challenges.
ICT role in 21st century education and it's challenges.ICT role in 21st century education and it's challenges.
ICT role in 21st century education and it's challenges.
 
The basics of sentences session 3pptx.pptx
The basics of sentences session 3pptx.pptxThe basics of sentences session 3pptx.pptx
The basics of sentences session 3pptx.pptx
 
Understanding Accommodations and Modifications
Understanding  Accommodations and ModificationsUnderstanding  Accommodations and Modifications
Understanding Accommodations and Modifications
 
Food safety_Challenges food safety laboratories_.pdf
Food safety_Challenges food safety laboratories_.pdfFood safety_Challenges food safety laboratories_.pdf
Food safety_Challenges food safety laboratories_.pdf
 
HMCS Max Bernays Pre-Deployment Brief (May 2024).pptx
HMCS Max Bernays Pre-Deployment Brief (May 2024).pptxHMCS Max Bernays Pre-Deployment Brief (May 2024).pptx
HMCS Max Bernays Pre-Deployment Brief (May 2024).pptx
 
Explore beautiful and ugly buildings. Mathematics helps us create beautiful d...
Explore beautiful and ugly buildings. Mathematics helps us create beautiful d...Explore beautiful and ugly buildings. Mathematics helps us create beautiful d...
Explore beautiful and ugly buildings. Mathematics helps us create beautiful d...
 
1029 - Danh muc Sach Giao Khoa 10 . pdf
1029 -  Danh muc Sach Giao Khoa 10 . pdf1029 -  Danh muc Sach Giao Khoa 10 . pdf
1029 - Danh muc Sach Giao Khoa 10 . pdf
 
Fostering Friendships - Enhancing Social Bonds in the Classroom
Fostering Friendships - Enhancing Social Bonds  in the ClassroomFostering Friendships - Enhancing Social Bonds  in the Classroom
Fostering Friendships - Enhancing Social Bonds in the Classroom
 
Holdier Curriculum Vitae (April 2024).pdf
Holdier Curriculum Vitae (April 2024).pdfHoldier Curriculum Vitae (April 2024).pdf
Holdier Curriculum Vitae (April 2024).pdf
 
SOC 101 Demonstration of Learning Presentation
SOC 101 Demonstration of Learning PresentationSOC 101 Demonstration of Learning Presentation
SOC 101 Demonstration of Learning Presentation
 
ComPTIA Overview | Comptia Security+ Book SY0-701
ComPTIA Overview | Comptia Security+ Book SY0-701ComPTIA Overview | Comptia Security+ Book SY0-701
ComPTIA Overview | Comptia Security+ Book SY0-701
 
Application orientated numerical on hev.ppt
Application orientated numerical on hev.pptApplication orientated numerical on hev.ppt
Application orientated numerical on hev.ppt
 
Sociology 101 Demonstration of Learning Exhibit
Sociology 101 Demonstration of Learning ExhibitSociology 101 Demonstration of Learning Exhibit
Sociology 101 Demonstration of Learning Exhibit
 
Graduate Outcomes Presentation Slides - English
Graduate Outcomes Presentation Slides - EnglishGraduate Outcomes Presentation Slides - English
Graduate Outcomes Presentation Slides - English
 
1029-Danh muc Sach Giao Khoa khoi 6.pdf
1029-Danh muc Sach Giao Khoa khoi  6.pdf1029-Danh muc Sach Giao Khoa khoi  6.pdf
1029-Danh muc Sach Giao Khoa khoi 6.pdf
 
Unit-IV; Professional Sales Representative (PSR).pptx
Unit-IV; Professional Sales Representative (PSR).pptxUnit-IV; Professional Sales Representative (PSR).pptx
Unit-IV; Professional Sales Representative (PSR).pptx
 
This PowerPoint helps students to consider the concept of infinity.
This PowerPoint helps students to consider the concept of infinity.This PowerPoint helps students to consider the concept of infinity.
This PowerPoint helps students to consider the concept of infinity.
 

Process of hazard mapping

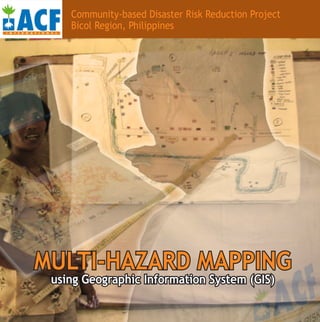
  • 1. Community-based Disaster Risk Reduction Project Bicol Region, Philippines MULTI-HAZARD MAPPING using Geographic Information System (GIS)
  • 2. Multi-Hazard Mapping using GIS ACF Disaster Risk Reduction (DRR) Project has been implemented in Camarines Sur and Catanduanes with the objective of reducing the population’s vulnerability of population to natural disasters. Hazards like typhoon, landslide, flood, storm surge, tsunami, and earthquake poses risks to life, property and livehood compounded by physical exposure and proximity to hazard-prone areas, socio-economic, and cultural and behavioral conditions. An integral part of disaster risk reduction undertaken by this project is the Geographic Information System (GIS)based Multi-hazard Mapping conducted in pilot barangays from the two provinces. The process of multi-hazard m apping integrates different hazard-related information for specific areas to convey a composite picture of natural hazards in varying magnitude, frequence and areas of effect. Combination of spatial analysis and local knowledge of communities are essential inputs in producing multi-hazard maps. Local knowledge of communities are gathered through Participatory Capacity and Vulnerability Assessment (PCVA) where community members develop community hazard and resource maps. Using GIS, maps are produced through the integration of spatial data and local community knowledge. GIS aids in efficient development, storage, updating, access and sharing of multi-hazard mapping information.The availability of reliable multi-hazard maps are important risk assessment tools providing relevant information essential for community planning and decision making, especially in emergency response, and disaster preparedness and mitigation. Key Concepts in Multi-Hazard Mapping HAZARD: “A potentially damaging physical event, phenomenon or human activity that may cause loss of life or injury, property damage, social and economic disruption or environmental degradation. Hazards include latent conditions representing future threats and can have different origins: natural (geological, hydrometeorological, biological) or induced by human processes (environmental degradation and technological hazards). Hazards can be single, sequential or combined in their origin and effects. Each hazard is characterised by its location, intensity, frequency and probability.” GEOGRAPHIC INFORMATION SYSTEM (GIS): “Analysis that combine relational databases with spatial interpretation and outputs often in form of maps. More elaborate definition is that of computer programmes for capturing, storing, checking, integrating, analysing and displaying data about the earth that is spatially referenced. GIS are increasingly being utilised for hazard and vulnerability mapping and analysis, as well as for the application of disaster risk management measures.” *Source: UN International Strategy for Disaster Reduction, 2004
  • 3. The Process of Multi-Hazard Mapping using GIS Data acquired from primary and secondary sources were subject for field validation, ground truthing and accuracy check and cleaned up based on spatial and non-spatial data. Primary data were collected from Global Positioning System (GPS) survey with georectified NAMRIA map and images from Google Earth, community consultation and use of PCVA community maps developed by community members including barangay council and representatives from women, elderly, and youth sectors. Secondary data were collected from NAMRIA, PHIVOLCS, and Google Earth. Relevant data are integrated, consolidated, and encoded in Microsoft Excel spreadsheet. Each datum identified is classified according to groups (i.e. Elevation, Northing, Easting, etc.). This process brings data into the electronic environment. Database creation starts when encoded data are processed through GIS software developing a database for hazard maps per barangay (i.e. Flood hazard map, Landslide hazard map, etc.) with non-spatial attributes associated to spatial features (i.e. Longitude-Latitude) coming up with topology and themes allowing for iterative and interactive pair-wise comparison. Analysis on data gathered for multi-hazard mapping and risk assessment focused on features and corresponding position on Hydro-Meteorological Hazard and Siesmic Hazard maps from national data incorporating local knowledge from the barangays. Spatial analysis tools are used to model, predict and reach conclusions include geometrics manipulation and analysis including data projection, joining tables, vertex adjustment, features symbology, GPS data integration. Data Storage is the process of storing analyzed and manipulated data. On-screen digitizing of maps was done. Data Exporting and Product Generation were done with the completion of maps. Outputs can be in the form of maps and other illustrations like charts, graphs, tabular reports depending on what specific information are required to be generated. Maps were presented to and reviewied by partner DCCs from regional, provincial, and municipal levels particularly to key persons involved with local development planning and disaster management, and partner agencies like PAGASA, PHIVOLCS, and MGB Region V. Revisions were incorporated based on inputs gathered. Maps are printed and published in an interactive GIS stand-alone environment for CD distribution using HTML environment together with a Multi-Hazard Brochure.
  • 4. Uses of Multi-Hazard Maps Hazard and Risk Identification Impact of natural disasters can be minimized significantly if proper and timely information is available. Multi-hazard mapping process supports the requirement of availability of relevant information since the first step in producing multi-hazard maps is the identification of hazards and risks. Information about areas that maybe affected by various hazards and location of vulnerable elements such as population, buildings, infrastructure, livelihood sources. Emergency Response During disasters, local government units (LGUs) are under extreme pressure to make abrupt decisions affecting thousands of people, often with limited time to analyze situations and undertake actions. Maps are cartographically simple with information enabling local chief executives to make prompt and appropriate responses especially in emergencies. Maps help LGUs identify, prioritize, and allocate resources to vulnerable population in high risk areas for safe evacuation, rescue, relief and rehabilitation. Risk Management and Local Development Planning Hazard mapping is a crucial guide in optimizing development gains and minimizing potential loss of physical assets, human resources, and environmental capital. Mainstreaming multi-hazard mapping into local development planning is essential to effective disaster risk management. The link between DRR and population growth, physical demands of human settlement, economic planning and appropriate use of land should be recognized by LGUs. Maps contained and updated in local planning information database are useful documents for crafting of disaster risk management plans, local development plans, water management plans, tourism plans, land-use plans, zoning and other land use regulations.
  • 5. Possible Problems in Multi-hazard Mapping Data quality from reliable sources is an important consideration contributing to the multi-hazard mapping process credibility. Hence, LGUs need to be aware to anticipate possible problems that may be encountered in undertaking this activity, and take necessary actions to ensure that outputs produced are of high quality. Lack of or Outdated Cadastral Base Maps In many areas, updated cadastral maps may not be available to be used as base maps in preparing accurate hazard maps. Using old base maps might lead to inaccurate boundaries and other physical structures, and will not represent the area’s real situation. Hence, GISbased multi-hazard mapping should use updated base maps. Differences between Available Base Maps Capacity Building Investment on capacity building activities should be done to ensure active community participation and equip LGUs with technical staff possessing knowledge, skills, and equipment to successfully perform multi-hazard mapping. Participatory Capacity and Vulnerability Assessment (PCVA) Community inputs are essential in mapping process, hence, community involvement is important. Communities where areas are subject for mapping should be aware with clear understanding of the purpose and importance of multi-hazard mapping. PCVA can be used as a venue were barangay council members, and sector representatives from women, elderly, livelihood and youth jointly participate in mapping hazards in their areas based from first-hand experience. Discrepancies maybe observed in geospatial features like rivers and coastal boundaries when using maps from varied sources due to differences in dates. For example, NAMRIA maps were gathered in 1950s while Google Earth images are dated 2000. Hence, LGUs should determine base map source to be used or if using multiple base map sources, clearly indicate differences in the hazard maps produced. Training on Multi-Hazard Mapping using GIS Change of Geo-spatial Features Over Time Provision of Hardware and Software Dynamic environmental variations, human settlements and activities bring changes to geo-spatial features of areas. Hence, regularly updating of map information and conducting field validation are necessary to maintain validity, accuracy and reliability of the hazard maps. Computer, GPS devices, and GIS software are needed to develop, store, and update hazard maps. Hardware with at least Pentium III with 128RAM and 64MB video card, GPS device of any model, and Operating System (Cross platforms). Softwares range from open source to paid. Local development planners, disaster risk managers, and technicians in-charge of producing and updating require trainings, especially on software use since GIS skills are software-specific.
  • 6. With the aid of GIS technology, risk information is just one click away! Multi-hazard Mapping using Geographic Information System (GIS) is a pilot activity of ACF under its Disaster Risk Reduction (DRR) Project. This information material includes a brochure and a CD. The brochure describes the importance, process and possible problems faced in multi-hazard mapping with the aim of informing LGUs intending to pursue and replicate this activity in their localities. The CD contains the multi-hazard map database covering ACF project areas and are intended for use and subject for updating of respective provincial and municipal governments.