SlideShare una empresa de Scribd logo
1 de 57
Daffodil International University Page 1
CHAPTER ONE
1.1 Background of study
Non-communicable diseases (NCDs) refer to non-infectious diseases or illnesses that are caused
by something other than pathogens. The term is used to imply a variety of conditions including
cancer, cardiovascular diseases, diabetes mellitus, chronic respiratory diseases, musculoskeletal
disorders and other conditions. Globally, about 25 million or one half of all deaths are from
NCDs, and this proportion keeps rising. Non-communicable diseases (NCDs) are responsible for
a high proportion of deaths and disabilities. World Health Organization (WHO) estimated that, in
2000, NCDs and mental disorders caused 59% of deaths and 46% of the global burden of disease
(WHO, 2002). Based on available trends, by 2020 NCDs are predicted to account for 73% of
deaths and 60% of disease burden worldwide (Murray, 1996).
According to the WHO African Regional Consultation Meeting Report on Global Strategy on
Diet, Physical Activity and Health (Harare, 2003), “the risk for non communicable diseases is
gaining importance in Africa with a prevalence of high blood pressure estimated at 30- 40 %
although prevalence data from national surveys are generally inadequate.”
The World Health Report 2001 indicates that NCDs, in 1998, accounted for almost 60% of all
deaths and 43% of global burden of diseases. Seventy-five percent of total deaths resulting from
NCDs occur in the developing countries. The treatment of NCDs is known to be expensive,
labour-intensive and needs technological sophistication which most countries are lacking.
Identification of major risk factors, their prevention and control form the basis of the prevention
of NCDs. Risk factors of today eventually become the diseases and the public burden in the days
after. Population measurements of these risk factors are used to describe the distribution of future
disease rather than predicting the health of specific individuals. Knowledge of risk factors can
then be applied to shift population distribution of these risk factors. Risk factors are measurable
under field conditions and amenable to intervention.
Identification of risk factors and their quantification is of great importance in order to calculate
the avoidable burden of disease and framing of cost-effective strategies for prevention.
Daffodil International University Page 2
1.2 Problem statement
The problem of non-communicable diseases remains an area of public health focus globally. It is
estimated that, globally, 25 million or one half of all deaths and most of the physical disabilities
are attributable to NCDs, and this is still on the increase year after year. WHO estimated that in
2000, NCDs and mental disorders caused 59% of deaths and 46% of the global burden of disease
(WHO, 2002). Recently, non-communicable diseases have gained popularity in the Sekyere
West District due to its overwhelming burden in the district. According to the 2008 Annual
Report of the District Health Directorate, ‘all the non-communicable diseases had increased
compared to the previous years and is a source of worry for the municipality’. There is therefore
the likelihood of future increase of non communicable disease burden in the district if no
intervention is implemented.
Among the top-10 causes of institutional death in the district, Cardio-Vascular Diseases (CVDs)
mainly hypertension, diabetes and stroke ranked 1st in 2004 representing 11.3 % of total causes
of deaths in that year and 2.9 % in 2005, ranking 7th. In 2006 and 2007, CVA still accounted for
8.94 % and 7.4 % of causes of death respectively.
Similarly, with diabetes mellitus, an increasing trend of cases year after year was observed with
34 and 63 cases of diabetes recorded in 2003 and 2004 respectively. A continuum of increases
occurred from 215 cases in 2005 to 258 cases in 2007 and 666 cases in 2008. The picture of non
communicable diseases in the district from the previous years to date makes this study so critical
for the documentation of the distribution of risk factors among the population.
1.3 Rationale of the study
Non-communicable diseases remain an area of high public health concern as well as health
services providers. Until recently, non-communicable diseases were not given much attention as
the diseases were noted to be confined to the wealthy people. The growing middle class and ever
changing lifestyle in developing countries have led to the rapid increase in the burden of NCD;
the epidemiological trend has caught up with Somalia. With the current increase in trend of the
diseases among all the different social categories of people, attention has begun to rise about
major determinants of the diseases and risk factors for NCDs.
Daffodil International University Page 3
In the Howlwadag District of the Banadir region, NCDs are among the leading causes of deaths.
This and others necessitate this recent study into assessing the level of prevalence, risk and risk
factors, and other determinants of the diseases such that tentative interventions can be put in
place at a minimum cost before the situation gets out of control.
In order to take effective prevention measures, identification of the risk factors is an essential
prerequisite. Little is known about the prevalence of the risk factor coupled with little data
available on the dietary habits, physical activity and other life-style associated factors in the
District.
It is with these concerns, that an assessment of risk factors is the focus of this study and has been
given priority attention in the District. The WHO STEPs Approach on NCDs risk factor
surveillance is considered an efficient tool to be used for assessing the risk factor situation in the
District.
In view of the burden of NCDs highlighted above, there is the need to have systematic data to
determine the magnitude of the problem of NCDs so as to influence policy and resource
allocation between prevention and care, this been one of the core relevance of the study.
1.4 Research questions
The study investigated these general research questions:
 Do you have an idea about the risk factors of non-communicable diseases?
 What factors contribute to the risk of non-communicable diseases?
 How is non-communicable disease distributed in the Howlwadag District in Somalia
 Who is highly affected with NCDs and their risk factors?
Daffodil International University Page 4
1.5 Objectives
1.5.1 Generalobjective:
The main objective of the study was to assess the prevalence, levels of risk and the major risk
factors for non-communicable diseases in the Howlwadag Destrict- Mogadishu Somalia
1.5.2 Specific objectives:
Specifically, the study was intended to:
1. Assess the level of awareness/knowledge in the Howlwadag Destrict- Mogadishu Somalia on
NCDs.
2. Identify the individual age groups that are mostly at risk of NCDs
3. Identify the determinants (physical, environmental, socio-economical, biological, behavioral
and nutritional factors) of non-communicable disease in the Mogadishu.
4. Assess the trend and distribution of non-communicable diseases as well as their risk factors in
the district.
5. Generate a baseline documentation to contribute to the existing literature for further research
interventions
1.6 Research hypothesis
The study investigated the following specific hypotheses:
 Sedentary lifestyles such as smoking, drinking, physical inactivity among individuals are
strong risk factors for developing NCDs.
 Low consumption of fresh fruits and vegetables and their nutrient biomarkers are associated
with increased risk of NCDs.
 Poor dietary/nutritional behaviors contribute to increased risk of NCDs.
Daffodil International University Page 5
 Socio-economic factors are key determinants of non-communicable diseases such as
hypertension and diabetes.
 NCDs and their risk factors are equally associated with males and females
 Advanced age is a risk factor for developing NCDs
1.7 Variables.
1.7.1 Dependent variable:
The non-communicable diseases among people living with non communicable diseases:
This will be obtained by asking patients the time, place and his/her occupation when
he/she fell the disease, when diagnosed sing and symptoms.
1.7.2 Independent variables
The prevalence of risk factors Independent variables include: Stigma, Religious, Traditional
beliefs, Education level and Occupation
1.8 Scope of the study
The study focuses basically on the assessment of the extent of prevalence, levels of risk and the
major risk factors for non-communicable diseases among residents in the Howl-wadaag District
in Mogadishu - Somalia.The study focuses basically on the assessment of the extent of
prevalence, levels of risk and the major risk factors for non-communicable diseases among
residents in the Howl-wadaag District in Mogadishu - Somalia.
1.9 Definition of terms
Chronic non- communicable diseases (CNCDs):CNCDs are defined as diseases or conditions
which affect individuals over an extended period
of time and for which there are no known causative agents that could be transmitted from one
affected individual to another (Daar et al, 2007).
Risk factors: A risk factor refers to any attribute, characteristic or exposure of an individual
which increases
the likelihood of his or her developing a non-communicable disease (WHO, 2005a).
Daffodil International University Page 6
Lifestyle:The way in which a person or a group lives (Hornby, 2000).
Chronic diseases of lifestyle (CDLs):This is a group of diseases which affect people who share
similar risk factors as a result of exposure, over many decades, to unhealthy diets, smoking, lack
of exercise and possibly stress. The major risk factors include high blood pressure, tobacco
addiction, high blood cholesterol and diabetes. These are also called non-communicable diseases
or degenerative diseases (Fourie, 2001).
Health promotion:This is defined as the process of enabling people to increase control over, and
to improve, their health, to reach a state of complete physical, mental and social well-being
(Coulson, Goldstein & Ntuli, 2002).
Public health:This is the science and art of promoting, protecting and improving health and
well-being through the organized efforts of society (McPherson, 2001).
1.10 Aim of the study
The purpose of this study was to determine the prevalence of risk factors for noncommunicable
diseases among men and women aged between 15 and 70 years living in Howkwadag
Mogadishu Somalia.
1.11 Significance of the study
Most developing countries of sub-saharan Africa, including Somalia, are faced with a double
burden of infectious diseases and the emerging non-communicable disease pandemic. This is a
concern for public health since it poses a great threat to already overstretched and poorly
structured health care systems.
Statistics show that non-communicable disease morbidity and mortality are rapidly increasing,
especially among the poorest of the poor. WHO member countries resolved that surveillance of
the major common risk factors would form a comprehensive baseline starting point for the
legislation, planning and execution of health promotion interventions. Results in this study would
complement the scarce knowledge on the existing interactions between socio-demographic
characteristics, behavior and non-communicable diseases among residents of Mombasa. This
information will facilitate the training and practice of health care workers, including medical
doctors, physiotherapists, environmental health officers and nurses
Daffodil International University Page 7
CHAPTER TWO: LITERATURE REVIEW
2.1 Introduction
There are various definitions for a literature review as indicated by many researchers and
institutions. A literature review is both a summary and explanation of the complete and current
state of knowledge on a specific topic (University of Guelph 2013:1). The University of
Wisconsin (2013:1) defined literature review as a critical analysis of a segment of a published
body of knowledge through summary, classification, and comparison of prior research studies,
review of literature and theoretical articles. Similarly, a literature review is an objective,
thorough summary and critical analysis of the relevant available research and non-research
literature on the topic being studied (Hart 1998:28).
This chapter presents a review of the relevant literature on the global evolution and epidemiology
of chronic non-communicable diseases. The current trends in behavioral health risk factors are
observed within and between different populations. Studies focusing on the associations between
health risk factors and populations’ socio-demographic characteristics are reviewed, as well as
theories underlying risk factors patterns among populations. The chapter also looks at the health
and socioeconomic impact of non-communicable diseases upon individuals, societies and
governments. Finally, global and regional models of evidence based cost-effective preventive
and control programs are presented.
2.2 Global Level of Awareness on Non-Communicable Diseases
Non-communicable diseases (NCDs) and mental health are the leading causes of death
worldwide, causing 60% of the global deaths and 46% of the global burden of disease (WHO
2001, Murray, et al., 1996). NCDs include Cardio-Vascular Diseases (CVDs) such as stroke,
heart attacks, diabetes, chronic lung diseases, cancer, diseases of bones and joints and mental
illness (Nigel, 2001a).The biggest single killer is coronary heart diseases, followed by other
CVDs, cancer and chronic lung disease in that order. Diabetes is a major contributor to deaths
from CVDs, but also causes its own unique complications. Common risk factors of these NCDs
Daffodil International University Page 8
include smoking, physical inactivity, obesity, and diets high in saturated fats and sodium and low
in fruit and vegetables intake (Nigel, 2001a).
Many developing countries are affected by a double burden of disease; the combination of long
established infectious diseases with a rapidly growing new epidemic of chronic NCDs (WHO
2000). Until recently, risk factors such as high blood pressure, cholesterol, tobacco use, excess
alcohol consumption, obesity, and the diseases linked to them were associated with developed
countries. Studies from some African countries suggest that in predominantly urban settings, the
prevalence of diabetes and hypertension increased markedly over the last ten years to the year 2000 (
Nigel, 2001b).
2.3 Non-communicable diseases: The global situation
According to WHO (2005a), non-communicable diseases, including heart diseases and stroke,
cancer, chronic obstructive pulmonary diseases and type 2 diabetes, are the major causes of death
and disability worldwide, including many young people and those in middle age. This drastic
shift in the leading global cause of death, from infectious diseases and malnutrition to non-
communicable diseases, poses a great public health concern. As noted in the global burden of
disease survey by Murray and Lopez (1996), most of the non-communicable disease cases are
detected in the low- and middle-income developing countries where the majority of the world’s
population lives. The increasing impact of non-communicable diseases in these countries
threatens to overwhelm already stretched health care systems. The Murray and Lopez analysis
also revealed that the total global disease burden, including non-communicable diseases, is
unequally distributed, with nearly 90% occurring in the developing countries, yet only 10% of
the total global expenditure is allocated to those countries. This disparity presents a major public
health inequity, one worthy of urgent address by the international health organizations if a
desirable outcome is to be expected in the prevention and control of non-communicable diseases
in the developing countries, which contribute substantially towards the global morbidity and
mortality rates. Table 2.1 below shows the WHO estimates for non-communicable diseases in
different world regions.
Daffodil International University Page 9
Table 2.1: The common non-communicable diseases estimates (100,000) per WHO,
World region
NCDs Africa Europe America
Cardiovascular
diseases (heart diseases
& stroke)
4214 6078 6006
Cancer 1064 1045 1307
Diabetes mellitus 113 264 421
Chronic respiratory
conditions
1199 1088 980
2.3.1 Non-communicable diseases in developed countries
Statistics by the World Health Organization (2008) indicate that deaths worldwide from non-
communicable diseases exceed those from infectious diseases. It was also revealed that a relatively
smaller proportion of approximately 20% of deaths from non-communicable diseases occur in the
developed countries, where major advancements in primary health care and public health
infrastructure have been achieved. However, as revealed lately in the United States of America by
Gregg et al (2008), this status is currently being challenged by the declining rates in the eradication
of non-communicable diseases as well as marked disparities in prevalence across racial and ethnic
boundaries. With reference to the Omran model on the global epidemiologic transition, various
populations face different health status transformations, depending on their underlying
socioeconomic determinants. Developed countries are in this respect essentially classified in the age
of delayed degenerative diseases characterized by fully advanced primary health care systems and
technological advancements (Levenson et al, 2003).
In a study to evaluate the cause-specific mortality rate in the United States, Europe and Australia by
Unal, Critchley and Capewell (2005), it was revealed that cardiovascular diseases are the largest
cause of death. In line with the findings of the global burden of disease study, the authors also
reported a reduction in the mortality rate in Britain and most of the industrialized countries. This is
Daffodil International University Page 10
likely due to the impact of an improved primary health care system and advanced medical
technology, as seen for example in New Zealand where Capewell, Beaglehole, Seddon and
McMurray (2000) reported a 50–75% reduction in cardiac deaths following a population-wide
prevention program and modernized cardiological treatments.
2.3.2 Non-communicable diseases in middle-income economies
The profile and impact of non-communicable diseases across different economies is well
recognized. In Latin America and the Caribbean countries, which form part of the middle income
group of countries, this emerging epidemic is no exception. A study by Perel, Casas, Ortiz and
Miranda (2006) indicated a 73% prevalence of mortality from non-communicable diseases and a
76% prevalence of disability-adjusted life years (DALYs), with the major contribution being
from cardiovascular diseases. This dominance is projected to rise significantly by 2020. In line
with the Yusuf et al (2001) findings, this study identified urbanization, globalization and
population aging as the major driving forces underlying the dynamics of a population’s health.
Likewise, in Asia and the Pacific region, a report by Sen (1998) suggested that advances in
socioeconomic development and changes in demographics had altered the profile of the major
causes of mortality and morbidity, with indications that infectious and parasitic diseases were no
longer the major causes of death in the region. These findings collectively underline the
transitions in global disease profiles and health facing different populations under the adopted
negative effects of urbanization.
In an African cause-specific mortality rate study using data from demographic surveillance sites,
Adjuik et al (2006) found that South Africa registered more deaths due to noncommunicable diseases
when compared to most other African countries. According to the authors, this is attributable to the
country’s socioeconomic and demographic status, supporting similar associations observed in related
studies in the field of non-communicable disease epidemiology.
2.3.3 Non-communicable diseases in low-income countries
The low-income developing countries are composed of most Asian and sub-saharan African
countries. They host the majority of the world’s population and are characterized by poor health
Daffodil International University Page 11
care systems and under-developed public health infrastructures (Mathers and Loncar, 2006). This
status puts the developing countries in a challenging position in dealing with existing infectious
diseases and emerging non-communicable diseases. A comparative international survey on the
burden of non-communicable diseases by Boutayeb and Boutayeb (2005) highlighted a global
concern with increasing trends in developing countries, where the transition imposes more
constraints in dealing with the double burden of both infectious and non-communicable diseases.
The Boutayeb and Boutayeb study also observed an accelerating trend in noncommunicable
disease mortality rates, from 47% to 56% between 1990 and 2000, reaching a projected 69% in
2020. Though relatively lower than the 80% mortality toll reported by Ezzati et al (2002), the
increasing trend poses a great public health challenge in those developing countries which are
characterized by poor health care systems.
In the oft-cited burden of disease study by Murray and Lopez (1996), it was revealed that more
people died of non-communicable diseases in the developing countries compared to the
developed countries. Kenya, as one of the low-income countries of the sub-saharan African
region, is no exception to this emerging public health threat.
2.4 Age Specific Prevalence Rate of Non-Communicable Disease
While malnutrition and infection persist as the major nutritional problems affecting mostly
children, chronic diseases are the main cause of premature deaths in adults even in the poorest
countries. Immunizations and antibiotics are having a major impact on infectious diseases, but
progress is much slower in combating non-communicable chronic diseases (NCDs).In Britain,
death before middle age has been largely avoided, but death in middle age is still common,
though it is largely avoidable. 80% of such deaths involve vascular or neoplastic diseases, for
many of which better treatment and more effective preventive measures can be foreseen.
In 1980 there were about 50 million deaths in the world, half in people under 35 years of age.
Indeed, 15 million were under five. In early childhood, about four million deaths a year were due
to diarrhea, about four million to acute respiratory infections, and about four million to diseases
that can largely be prevented by vaccination. (Anon, 2008)
Daffodil International University Page 12
A study involving 4,733 subjects indicated that Diabetes, IGT and combined IFG and IGT
increase with age, as the oldest age group (64+ years) has the highest diabetes prevalence
(13.6%). The age-adjusted prevalence of diabetes, IFG and IGT, were 6.4, 6.0 and 10.7%,
respectively. Diabetes is also known to be common among males than females (7.7% vs. 5.5%)
with a probability of [P<0.05] in the same study. Worsening glycaemic status is associated with
increase in age, body mass index, systolic and diastolic blood pressures. (Amoah, 2003)
2.5 Risk Factors ofNon-Communicable Diseases
2.5.1 High Blood Pressure
Blood pressure is considerably lower in children than in adults and increases steadily throughout
the first two decades of life. In adults, cross-sectional and longitudinal surveys have shown that
systolic and diastolic blood pressure increase progressively with age. For example, in the WHO
MONICA survey, systolic blood pressure increased by about 0.29 to 0.91 mm Hg per year in
men and 0.6–1.31 per year in women (Wolf et all., 1997). This increase remains stable and
possibly declines after age 50 for diastolic but not for systolic blood pressure, leading to a steep
increase in pulse pressure; a key risk factor for cardiovascular outcome (Franklin et all., 1999).
These trends have been demonstrated in both genders and most ethnic groups (Hajjar et al.,
2003).
2.5.2 Anthropometric Indexes
Body mass index (BMI) is an important correlate of blood pressure and hypertension prevalence.
By the current World Health Organization (WHO,2000) criteria, a BMI <18.5kg/m2 is
considered underweight, 18.5–24.9 kg/m2 ideal weight and 25–29.9kg/m2 overweight or pre-
obese. The obese category is sub-divided into obese class I (30–34.9kg/m2), obese class II (35–
39.9kg/m2) and obese class III (≥40kg/m2). A BMI greater than 28kg/m2 in adults is associated
with a three to four-fold greater risk of morbidity due to T2DM and CVDs than in the general
population (Van Itallie, 1985).
Daffodil International University Page 13
The recent increase in overweight and obesity in the United States (Flegal et al., 2002) both in
adults and children may explain, in part, the associated increase in hypertension prevalence over
the past decade. In the NHANES-III data, obese men and women had a hypertension prevalence
ranging from 49% to 64% with increasing degrees of obesity in men and from 39% to 63% with
increasing obesity in women versus 27% in normal-weight men and 23% in normal-weight
women (Must et al., 1999). According to Paffenbarger et al., 1983, weight gain is also associated
with an increase in hypertension incidence and the age-related rise in systolic blood pressure.
In an analysis of four Chicago epidemiological studies, weight gain was associated with an
increase in pulse pressure. In the Framingham Heart Study, a 5% weight gain was associated
with a 20% to 30% increase in hypertension incidence (Vasan et al., 2001). A study by Winkvist
et al., 1997 in Indonesia indicated 11.6% and 14.3% in their studies in the years 1996 and 1997
respectively as being a rate of overweight or obese among their study subjects
Obesity which is defined as a condition of abnormal or excessive fat accumulation in adipose
tissue, to the extent that health is impaired (Garrow, 1988) in absolute terms, and its distribution
in the body - either around the waist and trunk (abdominal, central or android obesity) or
peripherally around the body (gynoid obesity) - has important health implications. A central
distribution of body fat is associated with a higher risk of morbidity and mortality than a more
peripheral distribution (Kissebah et al., 1994).
2.5.3 Nutritional/Dietary Behavior Measures
Results of observational studies and clinical trials document an association between sodium
chloride (NaCl) intake and blood pressure (Kotchen et al., 1994). The effect of NaCl on blood
pressure increases with age, with the height of the blood pressure, and in persons with a family
history of hypertension. Among population groups, age-related increments of blood pressure and
the prevalence of hypertension are related to NaCl intake (Elliott et al., 1996).
Excess blood glucose levels predispose in a way to the development of diabetes, which is
basically influence by lifestyle. A study by Baridalyne et al., 2003 into Profile of Biochemical
Daffodil International University Page 14
Risk Factors for non communicable diseases in Urban, Rural and Peri-urban Haryana, India
documented 11.4% of men in urban areas having fasting blood glucose above the cut off.
2.5.4 Sedentary lifestyle
Sedentary life style and low educational attainment have each been linked to the rise in blood
pressure with age, low socio-economic status, low occupational class, psycho-social factors such
as hostility and time urgency/impatience, job strain, depression (Davidson et al., 2000).
2.5.5 Tobacco Smoking
Smoking, which is believed to be the number one major single known cause of non-communicable
diseases (Toustad et al., 2006), is widespread around the world. Estimate of the World Health
Organization (WHO) indicates that roughly about 30% of the global adult male populations are
smokers.
It is estimated that tobacco-related deaths exceed 4 million annually. It has been estimated that
by 2030, diarrhoeal diseases and lower respiratory infections will have been surpassed by
chronic obstructive airways diseases as causes of mortality (Murray and Lopez 1990; Lopez et
al, 2006).While the prevalence of tobacco use in many industrialized nations is reducing, there is
a growing epidemic of smoking in the developing world. In many African countries, there is
paucity of data on the epidemiology of tobacco and smoking. Based on the available data
however, in African countries, it appears smoking among adults is more common among males
and the poor (Pampel, 2002).
In sub-Sahara Africa, data on national smoking prevalence ranges from 20% to 60% among men.
Rate of smoking among certain sub-Saharan African youth has been documented. A prevalence
rate of 1.4% in Zimbabwe, 1.5% in Nigeria, 34.4% in Cape Town, South Africa which exhibit a
steadily increase and that must need an attended (Townsend et al, 2006). In Kenya, a study into a
Global Youth Tobacco Survey document a rate of 7.2% cigarette smoking among school-going
children and 8.5% of other tobacco related products (Global Youth Tobacco Survey, 2001).
Daffodil International University Page 15
Various categories of smoking exist which must be considered in estimating an extent of smoking
related infections. A study into Prevalence and determinants of adolescent tobacco smoking in Addis
Ababa, Ethiopia indicate an overall prevalence of 2.9% of which 4.5% males and 1% females were
current smokers. The same study also reports an estimated 15.1% males and 5.7% females ex-
smoking status among the population (Emmanuel et al; 2007).
2.5.6 Physical Inactivity
Physical inactivity is known to be a major public health problem of concern in 2000 as physical
activity levels of people of all ages tended to decrease (CDC 2001). The Centres for Disease and
Control (CDC 2001) reported that, among the youth in America aged 12 and 13 years, 69% were
regularly active. However, the number dropped to 38% for young people between the ages of 18-
21 years. A physically inactive child is more likely to become a physically inactive adult, which
could lead to chronic diseases of lifestyle (Frantz et al., 2003).
Among the United Kingdom, London Health Observatory reported that both adults and children
in Britain are less active and less fit than previously. The Allied Dunbar National Fitness Survey
(1992) identified UK adult population groups who were sedentary as women aged 16-24 years,
middle-aged men and people aged 50 years and over. In the Health Survey in England 1997,
22% boys and 30% girls were reported as being physically inactive between age 10 and 15. In
the 16-24 year age group, 39% of the males were reported as inactive and 62% of the females
were reported as inactive.
In some Sub-Saharan countries, prevalence of physical inactivity has been recorded. A study in
South Africa report from Birth to Twenty (BTT) 2002, indicates that more than 40% of young
people do not participate in regular physical activity. The BTT study found that physical activity
was less common among girls than boys and among those with lower income and less education.
2.5.7 Environmental Factors
Urbanization is an important factor in the aetiology of obesity, and a major risk factor for NCDs.
It accelerates the changes in diet, physical inactivity and increases access to tobacco products
Daffodil International University Page 16
and high fat foods which are all risk factors of NCDs (Vorster 2000). Diet and physical inactivity
are modifiable risk factors associated with changes in lifestyle.
Diets of the African population tend to differ between rural and urban dwellers. Studies have
shown that rural dwellers diets are low in fat and sugar but high in carbohydrates and fibre
(Steyn et al., 2001), while their urban counterparts show high fat and low fibre and carbohydrate
intake (Bourne et al., 2002) which is typical of a Western diet. Popkin (1999) suggests that the
shift from an agricultural economy to industrialization is one of the major economic changes that
are associated with nutrition transition.
2.6 Epidemiological Trend of Non-Communicable Diseases
In United States, Estimates of hypertension (generally defined as systolic blood pressure ≥140
mm Hg and/or diastolic blood pressure ≥90 mm Hg, or taking antihypertensive medications)
prevalence in the United States varies somehow. A study conducted with a total population of
15,739, aged between 45–64 years, revealed a prevalence rate of 35% (Nieto et al., 1995) in the
years 1987–1989. A similar study by the Woman's Health Initiative in U.S in the years between
1993 and 1997 of a total population of 90,755 women aged 50–79 years also revealed a
prevalence rate of hypertension of 37.8% (Wassertheil et al., 2000).
In the Behavioural Risk Factor Surveillance System (BRFSS) in U.S, self-reported hypertension
prevalence increased from 21.2% in 1991 to 25.7% in 2001 (Ahluwalia et. al., 2001).
In developing countries, the trend is for a rapid increase in hypertension prevalence, and in developed
countries, the previous trend of a decrease in hypertension prevalence is actually reversing (Cent.,
2005; Gupta, 2004; Hajjar et al., 2003).
Generally, the worldwide burden of hypertension in 2000 was estimated to be 972 million
persons or 26.4% of the adult world population, with 333 million in developed and 639 million
in developing countries (Kearney et al., 2005). It has been estimated that by 2025 1.56 billion
individuals will have hypertension, an increase of 60% from 2000 (Kearney et al., 2005).
Daffodil International University Page 17
Between the 1920s and the 1960s, data gathered from Korle-Bu hospital showed a steady
increase of stroke and cardiovascular diseases (Pobee, 2006). Hospital-based and community-
based studies conducted since the 1950s provide important information on prevalence and
morbidity trends for hypertension, diabetes and other chronic non communicable disease such as
cancers and sickle cell disease.
In the 1970s, the World Health Organisation (WHO) sponsored research in Mamprobi on
Cardiovascular Disease (CVD) recorded hypertension prevalence of 13% in the community
(Pobee, 2006). A non-communicable disease survey conducted in 1998 recorded a national
prevalence of 27.8% for hypertension (Bosu, 2007). Studies conducted after the national survey
show higher prevalence rates across different groups in different regions: 28.7% in Kumasi in the
Ashanti Region; 32% prevalence in Bawku/Zebilla in the Upper East Region; 36.9% in Keta-
Dzelukope in the Volta Region; and 47.8% among a cohort of women in Accra (Pobee, 2006;
Cappuccio et al., 2004; Hill et al., 2005). Reported facility cases of hypertension increased by 67
per cent, from 58,677 in 1989 to 97,980 in 1998 (Amoah et al.,2002). In 2005, national out-
patient hypertension cases totalled 250,000 (Bosu, 2007). During the same period (1950s to
present) major causes of death have shifted from solely communicable diseases to a combination
of communicable and chronic non-communicable diseases.
2.7 Determinants of non-communicable diseases:The role of health risk
factors
A “risk factor” refers to any attribute, characteristic or exposure of an individual which increases
the likelihood of developing non- communicable disease. In the public health context, risk factor
measurement is used to describe the distribution pattern of future diseases in a population.
(WHO, 2001).
According to the findings of an American national health survey by Mokdad, Marks, Stroup and
Gerberding (2004), a large body of epidemiologic studies has clearly demonstrated that
behavioral factors such as cigarette smoking, risky drinking of alcoholic beverages, physical
inactivity and unhealthy dietary practices contribute significantly to preventable chronic
noncommunicable disease morbidity and mortality. In line with observations made by WHO
Daffodil International University Page 18
(2005a), the authors also found extensive evidence for a multi-factorial interaction between a
population’s underlying socioeconomic determinants and the risk factors. These analyses,
together with many other studies conducted in this discipline, attempt to present
noncommunicable diseases as a consequence of the negative effects of modern lifestyles,
especially among developing populations. Figure 2.2 below illustrates the multi-factorial
determinants underlying the development of chronic non-communicable diseases.
Figure 2.1 Causes of chronic non-communicable diseases (WHO, 2005a).
2.8 The impact of chronic non-communicable diseasesandtheir risk factors
2.8.1 Health impact.
The lives of far too many people are being blighted or cut short by chronic diseases such as heart
disease, stroke, cancer, chronic respiratory diseases and diabetes. This is no longer only
happening in the high income countries. This is a very serious situation to individuals, societies,
public health and economies affected. (Jong-Wook,2005). In 2000, the 53rd World Health
Assembly reported that public health advocacy, especially in the developing countries, had been
traditionally devoted to infectious diseases. In contrast, it became clear that the impact and
profile of non-communicable diseases had generally been insufficiently appreciated.
Main chronic non- communicable diseases
Heart diseases, stroke, cancer, chronic respiratory diseases, type 2 diabetes.
Intermediate risk factors
Raised blood pressure, raised blood glucose, abnormal blood lipids,
overweight/obesity.
Common modifiable risk factors
Unhealthy diet, physical inactivity, smoking, risky alcohol
consumption.
Underlying socioeconomic determinants
Urbanization, globalization, population ageing.
Daffodil International University Page 19
2.8.2 Socioeconomic impact
Chronic diseases and poverty are interconnected in a vicious cycle. The poorest quintile in
almost all countries is more vulnerable to chronic diseases for several reasons, including greater
exposure to health-risk living conditions and decreased access to good-quality health care
services (Sachs, 2005). Chronic diseases represent a major cost and a profound economic burden
to individuals, families, health systems and societies. According to Marmot (2004), chronic
diseases may cause poverty or worsen already existing poverty by ruining a family’s economic
prospects through direct catastrophic expenditure on health care services and prolonged loss of
income. This argument is supported by the findings of a case study in Jamaica by Henry-Lee and
Yearwood (1999) who found that approximately 59% of people with chronic diseases reported
financial difficulties caused by their illness.
2.9 Models of best practice in the controland prevention of non
communicable diseases
In 2000, the 53rd World Health Assembly passed a resolution on the prevention and control of
non-communicable diseases among member states in their efforts to reduce the toll of morbidity,
mortality and premature mortality related to non-communicable diseases (WHO, 2005a).
The main objective of this global strategy was to map the emerging epidemic and analyze its
social, economic and behavioural determinants in order to provide guidance for policy making
and public health action. It was proposed in the assembly that comprehensive and integrated
surveillance of non-communicable disease risk factors would be part of the wider health
information system recommended by the World Health Organization as an essential national
public health function. The means of preventing and controlling most non-communicable
diseases through comprehensive and integrated action are already established, and have proved
applicable and cost-effective even in resource-constrained settings (Jong-Wook, 2005).
Daffodil International University Page 20
Chapter Three
Methodology
3.1 Introduction
This chapter describes the study setting and the rationale for its selection, the research design
employed, and the sampling techniques utilized. Tools of data collection and methods of data
analysis are outlined, as well as a description of the pilot study. The protocol observed to ensure
ethical considerations is also stated.
3.2 Study type and design
A cross-sectional study design was adapted to assess the prevalence, levels of risk and the major
risk factors for developing non communicable disease (Hypertension and Diabetes) among a
representative sample in the Howl-wadaag district in Mogadishu - Somalia with the use of
structured questionnaire on formal interview basis as well as direct physical measurements and
biochemical analysis.
3.3 Study Area
This study was undertaken Howl-wadag District, one of the largest districts in Benadir region
Somalia.
3.4 Study Period:
The time scope that the study will cover is from May to December 2015
3.5 Study population:
The study population comprised of individuals with or without indications of risk for NCDs within
the District. The target population for the study was selected among individuals of not less than 18
years of age in both sexes as at the time of the study and who had been resident in the district for a
period of more than three months. It was assumed that people aged 20 or above stood a chance of
risk of contacting NCDs if not genetically acquired. Exclusion criteria included physical disability,
Daffodil International University Page 21
mental disability and the presence of communication barriers, those who agreed to participate only
in Step 1 and those who refused to participate in the study.
3.6 Sample Size
The sample size of this study was 80. The sample size was selected from the target population
100 pateints by using Slovene's formula
Slovene’s formula:
n =
𝑵
𝟏+𝑵∗𝒆
N= sample n= sample size e=0.05 (constant)
n=
100
1+100 ∗0.052 = 80.
3.7 Sampling Technique
Study participants will be selected from the district hospital, one health centre and two
dispensaries. These health facilities were purposely selected because they had large number of
Non-communicable diseases patients.
3.8 Data collection procedures
A questionnaire was used to collect the data. The questionnaire was written in English, and
translated into Somali language since most of Somali elderly they don’t know English language.
The questioner was distributed by local representatives from howl-wadag districts hospital in
Banadir region Somalia. The researcher explained the purpose of the study to the participants
and get reliable data. The choice of the instrument is because a questionnaire as a research
instrument is a quick method to collect data. However, the technique is less time consuming and
adequately covered the entire sample within the proposed time framework.
3.9 Data analysis
After the collection of data, the researcher verified and checked the data and then entered in to
the computer. Data was analyzed by the researcher by using a software package used for
Daffodil International University Page 22
statistical analysis i.e. Statistical Package for Social Sciences (SPSS) version 6.1 according to
key variables.
3.10 Ethical implication
The study was conducted after getting permission and an introductory letter from the Faculty of
Allied Health Science, Department of Public Health Daffodil International University.
Introductory letter was also obtained from leadership or mayor of Banadir region. In addition
Inform Consent of the respondents were obtained from the study participants to confirm their
willingness to participate in the study after explaining to them the objectives of the study. The
respondents were notified of their right to refuse or terminate at any point of the interview. The
information provided by each respondent was kept confidential. No names of any respondent
were discovered to anybody. Responses was coded and reported in a generalized manner,
without mentioning who said what. Works of other people used in this study were correctly be
referenced and authors were duly recognized.
Daffodil International University Page 23
CHAPTER FOUR
RESULTS OF THE STUDY
This chapter presents results of analysis based on data collected on The prevalence of risk factors
for non-communicable diseases among people living in Howlwadag Destrict - Mogadishu
Somalia. The local representatives of the researcher distributed samples of 80 records. All the 80
questionnaires were returned and were found to be useful for data analysis hence100 response
rate. The following table summarizes the characteristics of the respondents.
Table 4.1 Distribution of Study Participants by Socio Demographics
Variable Frequency Percentage
Age
20-40
40-60
60-80
80 and above
Total
MEAN±54
SD±2.31
15
25
27
13
80
8.75
31.25
33.75
16.25
100
Sex
Male
Female
Total
30
50
80
37.5
62.5
100
Marital Status
Single
Married
Widow
Divorced
Total
10
25
24
11
80
12.5
31.25
30
13.75
100
Daffodil International University Page 24
Education
Never
Primary
Secondary
Diploma
Bachelor degree and above
Total
19
16
25
15
5
80
23.75
20
31.25
18.75
6.25
100
Occupation
House wife
Civil society
Self employee
Health workers
Total
30
20
20
5
80
37.5
25
25
6.25
100
House hold size
One
Two
Three
Four
Greater than four
Total
2
5
15
28
30
80
2.5
6.25
18.75
35
37.5
100
Daffodil International University Page 25
Monthly family income in sh.
Som
Less or equal 3000000
3500000-5000000
5500000-6000000
6000000 and above
Total
20
31
19
10
80
25
38.75
23.75
12.5
100
Age- majority of the respondent’s age were 27 (60-80) comprising (27 N=80),25(31.25) their age
was 40-60,15(8.75) were age 20-40 and also 80 years and above while 13 (16.25) Religion all
respondents are muslim N=80 (100)
Table shows the characteristics of study participants stratified by their GENDER. Of 80 NCD
patients, 30 (37.5) were males and 50 (62.5) were females. This table shows that most of the
participants were married while few numbers were windowed and divorced. 10 Were single
(12.5), 35 were Married (43.75),24 were widow (30) and 11 were divorced (13.75). The majority
respondents are secondary school education, 25(31.25) while of the respondent, reported to have
attained are never go to school education 19(23.75).16(20 ) were primary. 15(18.75)had
Diploma. While 5(6.25) was Bachelor degree and above education. Majority of the respondents
were house wife of number 30 (37.5),while Civil society and Self employee ware same
respondents 20(25) and Health workers and students were also same number 5 (6.25).
The above tabel indicates the distribution of the respondents by their income. The respondents in
this study were asked their monthly family income. It was observed that the income of the
participants was different according to their occupational status. Most of the respondents 31
(38.75)their income was (3500000-5000000sh.so)Some of the families their income was between
(lessorequal3000000) with proportion of 20(25)Some of the families their income (5500000-
6000000sh.so) with proportion 19(23.75) according to rich people with above than
6000000sh.so 10(12.5).
Daffodil International University Page 26
Table 4.2: Smoking Status of Respondents.
Variables Frequency Percentage
Smoking status
Never smoke
Current smokers
Ex-smoker
Total
35
24
21
80
43.75
30
26.25
100
At what age did you started smoking?
20 years
40 years
50 years and above
None smoke
Total
20
11
14
35
80
25
13.75
17.5
43.75
100
Do you smoke any of the tobacco products?
Yes
No
Total
20
60
80
25
75
100
How many times in a day do you smoke?
One a day
Two times a day
Three times a day
None smoke
Total
5
10
5
60
80
6.25
12.5
6.25
75
100
Daffodil International University Page 27
What is your general attitude towards smoking?
With to stop
Hate to smoke
Like to smoke
Total
70
4
6
80
87.5
5
7.5
100
Do you belief that smoking is harmful?
Yes
No
Total
74
6
80
92.5
7.5
100
The most of patients were Never smokers 35(43.75), second level were Current smokers 24 (30)
while 21 (26.25) of them were Ex-smokers
Most of patients were none smoke people which are 35(43.75) while 20 (25) started at age of 20
years. 11(13.75) were stared at age of 40 years and 14 (17.5) Were started ages of 50 years and
above.
The general attitude of most patients was Wish to stop smoke 70 (87.5), while 6 (7.5) were like
to smoke and 4 (5) were hate to smoke.
Most patients belief that Smoking is harmful 74 (92.5) while 6 (7.5) belief that smoke in not
harmful.
The majority of patients are never drink alcohol 75(93.75), 1(1.25) are current drink alcohol and
4 (5) are Ex-drink alcohol.
Table 4.3 Dietary Behavior of Respondents
variables Frequency percentage
In a typical week, how many days do you eat fruit?
One day
Two days
40 50
Daffodil International University Page 28
Three days
Four days
Total
12
17
11
80
15
21.25
13.75
100
In a typical week, on how many days do you eat Vegetables?
One day
Two days
Three days
Four days
Total
34
16
21
9
80
40.25
20
26.25
11.25
100
What type of oils or fat is most often used for meal preparation
in your household?
Vegetable oil
Lard
Butter
Margarine
Peanut butter
Total
46
12
14
8
80
57
15
17.5
10
100
Which of the following best describes your salt intake ability?
Low
Moderate
High
Total
21
20
39
80
26.25
25
48.75
100
On average, how many spoonful of salt is taken per meal/day
One
Two
Three
Four
18
46
14
2
22.5
57.5
17.5
2.5
Daffodil International University Page 29
Total 80 100
On the average, how many kilos of sugar is consumed per
week?
One kg
Two kg
Three kg
Four kg
Total
24
6
38
12
80
30
7.5
47.5
15
100
The most patients were eat fruits only one day in week 40(50) and 17(21.25) use three days in
week,12(15) while 11 (13.75).
The most patients were eat Vegetables one day in week 34 (40.25),26(26.25) were eat
Vegetables three days in week,16(20) were eat Vegetables two days in week and 9(11.25) were
Vegetables four days in week.
The majority patients 46 (57.5) are uses Vegetable oil in their meal preparation, 14 (17.5) are
use Margarine in their meal preparation, 12(15) were use Butter in their meal preparation.
The Salt in take Ability of most patients are high 39(48.75),moderate of Salt in take Ability
21(26.25),low of Salt in take Ability 20 (25)
Most of patients 46(57.5) were taken two Spoons meal per day, 18(22.5) were taken one Spoons
meal per day,14(17.5) were taken three Spoons meal per day.
Most of patients consumed Three kg per week 38(47.5), some of them consumed One kg 24 (30)
and 6(7.5) consumed two kilo per week.
Daffodil International University Page 30
Table 4.4 Physical Activity Of Respondents
Variables Frequency percentage
Does your work involve mostly sitting or standing,
with walking for not more than 30 minutes at a time?
Yes
No
Total
34
46
80
42.5
47.5
100
Does your work involve vigorous-intensity activity
that causes large increase in breathing or heart rate for
at least 10 minutes continuously?
Yes
No
Total
39
41
80
48.75
51.25
100
In a typical week, on how many days do you do
moderate intensity activities as part of your work?
One day
Two days
Three days
Four days
Five days
Total
10
10
11
4
42
80
12.5
12.5
13.75
8.75
50.25
100
How long is your typical working day?
Whole day
8 hours
6 hours
3 hours
Total
44
16
14
6
80
55
20
17.7
7.5
100
Do you walk or use a bicycle (pedal cycle) for at least
10 minutes continuously to get to and from places?
Yes
Daffodil International University Page 31
No
Total
36
44
80
45
55
100
The most of patients were no Standing and Walking For not more than 30 minutes 46(57.5)
while 34(42.5) Standing and Walking For more than 30 minute.
The most o patients not Increase in breathing or heart rate for at least 10mnute continuously
41(51.25) and Increase in breathing or heart rate for at least 10mnute continuously 39 (48.75).
The majority of patients were woken five days 42(50.25),11(13.75) were woken three days and
10(12.5) were two groups which were woken one day and two days while 7(8.75) were worked
four days.
Majority of patients 44(55)were working whole of the day,16(20) were working 8hrs,14 (177)
were working 6hrs and the 6(7.5) were working 3hrs.
Most of patients not Walking or Uses of bicycle For at least 10minutes 60(75) while 20 (25)
Walking or Uses of bicycle For at least 10minutes.
Most of patients were not Eat or drink other than water during past 12hours 44 (55) while 36
(45) Eat or drink other than water during past 12hours according time of hospital arrives.
4.5 Body Mass Index (BMI)
Category BMI-Kg/m2
Frequency Percentage
Starvation less than 14.9 5 6.2
Underweight from 15 to 18.4 20 25.0
Normal from 18.5 to 22.9 29 36.2
Overweight from 23 to 27.5 14 17.5
Obese from 27.6 to 40 10 12.5
Morbidly Obese greater than 40 2 2.5
Total 80 100
Daffodil International University Page 32
This is a measure of nutritional status whereby the body weight in Kilogram is divided to the square
meters for height. It is expressed mathematically as:
BMI =
Body weight (Kg)
Height (m2)
Table 4.6 Biochemical Measurements Of Respondents
Variables Frequency Percentage
During the past 12 hours have
you had anything to eat or
drink, other than water?
Yes
No
Total
36
44
80
45
55
100
Fasting blood glucose
Choose accordingly: mmol/l
or mg/dl
Low
High
Total
34
46
80
42.5
57.5
100
Total cholesterol
Choose accordingly: mmol/l
or mg/dl
Low
High
Total
32
48
80
40
60
100
Daffodil International University Page 33
HDL Cholesterol
Choose accordingly: mmol/l
or mg/dl
Low
High
Unable
Total
30
40
10
80
37.5
50
12.5
100
Majority of patients 46(57.5) their Fasting blood glucose :Choose accordingly: mmol/l or mg/dl
were high while 34(42.5) their Fasting blood glucose :Choose accordingly: mmol/l or mg/dl were
low.
Majority of patients 46(57.75) their Total cholesterol Choose accordingly: mmol/l or mg/dl were
low and 30(37.5) their Total cholesterol Choose accordingly: mmol/l or mg/dl were high. while
4(5) Total cholesterol Choose accordingly: mmol/l or mg/dl were unable.
Most of patients 48(60) their Triglycerides Choose accordingly: mmol/l or mg/dl were high and
32(40) their Triglycerides Choose accordingly: mmol/l or mg/dl were low.
In most of patients level of HDL Cholesterol Choose accordingly: mmol/l or mg/dl were high
40(50) and 30 (37.5) HDL Cholesterol Choose accordingly: mmol/l or mg/dl were low while
10(12.5) their Cholesterol Choose accordingly: mmol/l or mg/dl were unable.
Table 4.7 summaries of Biochemical Measurements Of Respondents
Biochemical tests Frequency Percentage
Fasting blood glucose Choose
accordingly: mmol/l or mg/dl
Low
High
34
46
14.16
19.16
Total cholesterol Choose
Daffodil International University Page 34
accordingly: mmol/l or mg/dl
Low
High
32
48
13.33
20.00
HDL Cholesterol Choose
accordingly: mmol/l or mg/dl
Low
High
Unable
Total
30
40
10
240
12.50
16.66
4.16
100
The above table summaries all tests of biochemical tests in the study Total cholesterol when it is
high 48(20%) and it is low 32(13.33%).Fasting blood glucose when it is high 46(19.16%) and it
is low 34(14.16%). HDL Cholesterol when it is high 40(16.66%), low HDL Cholesterol is 30
(12.50) and when it is Unable 10(4.16).
Table 4.8 Association association between General Attitude To Ward Smoking and Level
of education
Level of education General Attitude To Ward Smoking Total χ2
=85.2
Wish
to
stop
Like to smoke Like to smoke
Never 10 4 5 19
p-value =0.001
primary 11 2 3 16
secondary 12 6 7 25
diploma 10 4 1 15
Bachelor degree and
above
2 1 2 5
Daffodil International University Page 35
Total 49 16 15 80
In this study there was association between General Attitude To Ward Smoking and Level of
education of participant, there was significantly association, as showed by the above table. 85.2
while P-value is 0.001. If P-value is less than or equal 0.005 it means statistical significantly.
Therefore relationship between General Attitude To Ward Smoking and Level of education in
this study is strong significant.
Table 4.9 Association between Gender and Belief that Smoking is harmful
Gender Belief that Smoking is harmful Total χ2
=1.49
Yes No
male 30 0 30
p-value =0.005Female 44 6 50
Total 74 6 80
In this study there was association between Gender and Belief that Smoking is harmful of
participant, there was significantly association, as showed by the above table. 1.49 while P-value
is 0.004. If P-value is less than or equal 0.005 it means statistical significantly. Therefore
relationship between Gender and Belief that Smoking is harmful in this study is significant.
Daffodil International University Page 36
Figure 4.1 Age distribution of participants
The above figure 4.1 indicate that the majority number of age in distribution is (60-80) In
percentage of 33.75 and frequency of 27 which total is 80. Also this figure indicates that lowest
number of age in distribution is (≤20-40) in percentage of 8.75 and frequency of 15 which total is
80.
Figure 4.2 marital status distributions of participants
15
25
27
13
8.75
31.25
33.75
16.25
≤20-40 40-60 60-80 80 and above
Frequency Percentage
Daffodil International University Page 37
The above figure 4.2 indicate that the majority number of marital status in distribution is
(married) In percentage of 36 off 100%. Also this figure indicates that lowest number of marital
staatus in distribution is (single) in In percentage of 14 off 100%.
14%
36%
34%
16%
Single Married Widow Divorced
Daffodil International University Page 38
Figure 4.3 Body mass index (BMI)
Figure 4.4 Biochemical test when is high.
The above figure indicates that is Total cholesterol is highest48(60) all the tests in the study
when tests are high and HDL cholesterol is lowest 40(50)
less than
14.9
from 15 to
18.4
from 18.5
to 22.9
from 23 to
27.5
from 27.6
to 40
greater
than 40
Starvation Underweight Normal Overweight Obese Morbidly Obese
5
20
29
14 10
2
6.2
25
36.2
17.5
12.5
2.5
BMI
Frequency Percentage
46
48
40
57.5
60
50
Fasting blood glucose Total cholesterol Choose HDL Cholesterol
Frequency Percentage
Daffodil International University Page 39
Figure: 4.5 Biochemical test when is Low:
The above figure indicates that is fasting blood glucose is highest 34(14.16) all the test when test
are Low and HDL is lowest when tests are Low.
Fasting blood glucose Total cholesterol HDL Cholesterol
34
32
30
14.16 13.33 12.5
Frequency Percentage
Daffodil International University Page 40
CHAPTER FIVE
DISCUSSION
5.1DISCUSSION
This study enrolled Non-communicable Diseases (Ncds) UN equal number of males to females
within the age classes between 20 to 80 years and above. Age- majority of the respondent’s age
were 27 (60-80) comprising (27 N=80),25(31.25) their age was 40-60,15(8.75) were age 20-40
and also 80 years and above while 13 (16.25) Religion all respondents are muslim N=80 (100).
The study revealed that most of the respondents (31.25%) were married while the remaining
were considered widow (30%), divorce (13.75%) and single (12.5%). The high proportion of
married people among the respondents could have a significant impact on non communicable
diseases occurrence especially high blood pressure since some marital issues such as social,
financial and nutritional obligations on the part of married couples has an associated effect on
blood pressure. This assertion supports the research hypothesis stated that socioeconomic factors
are key determinants of non-communicable diseases. Education also plays a very significant role
in the development, management and control of non communicable diseases. Existing literatures
support the fact that in an environment where illiteracy is high, NCD is said to be high as
compared to high literacy environment.
The majority respondents are secondary school education, 25(31.25) while of the respondent,
reported to have attained are never go to school education 19(23.75).16(20 ) were primary.
15(18.75)had Diploma. While 5(6.25) was Bachelor degree and above education.
According the occupation the Majority of the respondents were house wife of number 30
(37.5),while Civil society and Self employee ware same respondents 20(25) and Health workers
and students were also same number 5 (6.25).
Monthly income .The respondents in this study were asked their monthly family income. It was
observed that the income of the participants was different according to their occupational status.
Most of the respondents 31 (38.75)their income was (3500000-5000000sh.so)Some of the
families their income was between (lessorequal3000000) with proportion of 20(25)Some of the
Daffodil International University Page 41
families their income (5500000-6000000sh.so) with proportion 19(23.75) according to rich
people with above than 6000000sh.so 10(12.5).
Regarding Smoking status.The most of patients were Never smokers 35(43.75), second level
were Current smokers 24 (30) while 21 (26.25) of them were Ex-smokers .Most of patients were
none smoke people which are 35(43.75) while 20 (25) started at age of 20 years. 11(13.75) were
stared at age of 40 years and 14 (17.5) Were started ages of 50 years and above.
The general attitude of most patients was Wish to stop smoke 70 (87.5), while 6 (7.5) were like
to smoke and 4 (5) were hate to smoke. Most patients belief that Smoking is harmful 74 (92.5)
while 6 (7.5) belief that smoke in not harmful.
Regarding the daily or weekly uses of vegetables, the most patients were eat Vegetables one day
in week 34 (40.25),26(26.25) were eat Vegetables three days in week,16(20) were eat Vegetables
two days in week and 9(11.25) were Vegetables four days in week.The majority patients 46
(57.5) are uses Vegetable oil in their meal preparation, 14 (17.5) are use Margarine in their meal
preparation, 12(15) were use Butter in their meal preparation.The Salt intake Ability of most
patients are high 39(48.75),moderate of Salt intake Ability 21(26.25),low of Salt intake Ability
20 (25) some of patients 46(57.5) were taken two Spoons meal per day, 18(22.5) were taken one
Spoons meal per day,14(17.5) were taken three Spoons meal per day. Some of patients
consumed Three kg per week 38(47.5), some of them consumed One kg 24 (30) and 6(7.5)
consumed two kilo per week.
According the Physical Activity Of RespondentsThe most of patients were no Standing and
Walking For not more than 30 minutes 46(57.5) while 34(42.5) Standing and Walking For more
than 30 minute. some patients not Increase in breathing or heart rate for at least 10mnute
continuously 41(51.25) and Increase in breathing or heart rate for at least 10mnute continuously
39 (48.75).anothers of patients were woken five days 42(50.25),11(13.75) were woken three
days and 10(12.5) were two groups which were woken one day and two days while 7(8.75) were
worked four days. Regarding their working Majority of patients 44(55)were working whole of
the day,16(20) were working 8hrs,14 (177) were working 6hrs and the 6(7.5) were working 3hrs.
According Biochemical Measurements Of Respondents Majority of patients 46(57.5) their
Fasting blood glucose :Choose accordingly: mmol/l or mg/dl were high while 34(42.5) their
Fasting blood glucose :Choose accordingly: mmol/l or mg/dl were low. Regarding Majority of
Daffodil International University Page 42
patients 46(57.75) their Total cholesterol Choose accordingly: mmol/l or mg/dl were low and
30(37.5) their Total cholesterol Choose accordingly: mmol/l or mg/dl were high. while 4(5)
Total cholesterol Choose accordingly: mmol/l or mg/dl were unable.
Some of patients 48(60) their Triglycerides Choose accordingly: mmol/l or mg/dl were high and
32(40) their Triglycerides Choose accordingly: mmol/l or mg/dl were low. In others of patients
level of HDL Cholesterol Choose accordingly: mmol/l or mg/dl were high 40(50) and 30 (37.5)
HDL Cholesterol Choose accordingly: mmol/l or mg/dl were low while 10(12.5) their
Cholesterol Choose accordingly: mmol/l or mg/dl were unable.
5.2 Limitation
1. The study was health facility based therefore we missed people with NCDs symptoms but
not have attended health facilities whom might have different characteristics.
2. The results were based on self reports by the use of exit interviews to capture information
from respondents. This might lead to the under or over reporting of the responses or
giving a continuous response for the following statements which may lead to information
bias. This was minimized by structuring the statements of the interview schedule so that
some of them had different polarities (positive and negative statements) to keep the
respondents from repetitively giving the same response for all subsequent statements.
3. Since the sample size was small (80 respondents) due to limitation of time so, the finding
may not reflect the prevailing situation of all country as whole.
4. During the interview some of respondents where hesitated to answer the personal
questions.
Daffodil International University Page 43
CHAPTER -6
CONCLUSION AND RECOMMENDATIONS
6.2 Conclusions
This study attempts to assess the prevalence, levels of risk and major risk factors for developing
non communicable diseases in the Howlwagad district of Mogadishu Somalia.
The study answered specific research questions and hypotheses on issues relating to sedentary
lifestyles, nutritional behaviours, knowledge on NCDs risk factors, and distribution of risk
factors of non communicable diseases among the population.
The prevalence rate of the behavioural risk factors documented by the study reflect the interplay
of the underlying social, economic and cultural driving forces such as low education,
unemployment and low incomes. Poor consumption of fruits and vegetables, high consumption
of fat, low level of moderate physical activity and others may have also contributed to high
obesity, hypertension and hyper-glycaemia prevalent in the community.
Males were found to be at high risk on most of the study variables measured compared to
females. This empirical evidence has clearly justified the basis of the study objective by the
falsification of one of the key research hypotheses that ‘NCDs and their risk factors are equally
associated with males and females’.
The depth of knowledge and information provided on the magnitude of risk factors for NCDs in
the community, which to a very large extent is representative of the entire district, should be
relevant for policy formulation and intervention in areas which share similar socio- economic
and geophysical characteristics, if not across the entire county as a whole.
Daffodil International University Page 44
6.2 Recommendations:
Drawing from key findings of the study, the following recommendations are made for consideration
and implementation by Health Policy-makers, institutions and all stakeholders.
6.2.1 Government
 Strengthening integration of chronic NCD care into Public Health Care services
 Establishment of a health facility-based screening programs in the District and Sub-
District Hospitals and clinics for early detection of asymptomatic hypertension and
diabetic conditions.
 Formulation and strengthening of policies to control the incidence of tobacco use in
schools, workplaces and other public places to minimize the effects of smoking on
passive smokers or the general public as a whole
6.2.2 District Health Management Team (DHMT):
 Embarking on community based health education programs on the risk factors for NCDs
and its preventive strategies
 Strengthening action to promote healthy diet and physical activity in schools.
 Strengthening the initiation of home-based programs on healthy diet and indoor and
outdoor physical exercises with the female and the elderly as specific targets.
 Routine public education on awareness through educational campaigns for promoting
healthy life styles.
 Establishment and strengthening of a stepwise surveillance system for NCDs to monitor
the trend of the diseases over time.
 Formation of keep-fit clubs should be encouraged within the communities.
6.2.3 DistrictAssembly
 Provision of funds for research into NCDs in the district
Daffodil International University Page 45
 Assisting the DHMT to establish community clinics for NCDs screening programs.
 Multi-cultural activities to tackle chronic non-communicable diseases in the district.
REFERENCES
1. Adamson, S., Muula, L. M. (2007).Cigarette Smoking Prevalence among School-going
Adolescents in Two African Capital Cities: Kampala Uganda and Lilongwe Malawi,
2007
2. Addae, S. (1996). History of Western Medicine in Ghana, 1880 – 1960. 1996. Durham:
Durham Academic Press.
3. Adubofuor, K.O.M., Ofei, F., Mensah-Adubofour, J., Owusu, S.K. (1993). Diabetes in
Ghana: A Morbidity and Mortality Analysis. International Diabetes Digest 1993; 4(3),
90-92.
4. Adubofour, K.O.M., Ofei, F., Mensah-Adubufour J, Owusu SK. (1997) Diabetes in
Ghana. In Gill G, Mbanya J-C, Alberti G (Eds), Diabetes in Africa. 1997; FSG
Communications Ltd, Reach, Cambridge, UK. (Pp. 83-88)
5. Agyemang, C. and Owusu-Dabo E. (2006). Prehypertension in the Ashanti Region of
Ghana, West Africa: An Opportunity For Early Prevention Of Clinical Hypertension
6. Ahluwalia, I.B., Mack K.A., Murphy, W., Mokdad A.H., Bales, V.S. (2003). State-
Specific Prevalence of Selected Chronic Disease-Related Characteristics—Behavioral
Risk Factor Surveillance System, 2001. MMWR (Surreal. Summ.) 52:1–80
7. Allied Dunbar National Fitness Survey (1992). Health Education Authority and Sports
Council, London.
8. Amoah, A.G.B., Owusu, K.O. And Adjei, S. (2002).Diabetes in Ghana: A Community
Prevalence Study in Greater Accra. Diabetes Research and Clinical Practice, 2002; 56:
197-205.
9. Amoah, A.G. B. (2003). Obesity in Adult Residents of Accra, Ghana. Ethn Dis. 2003
13(2 Supp 12):S97–S101.Summer; [Pubmed]
Daffodil International University Page 46
10. Baridalyne, N., Anita A., Lakshmy R., Ritvik, K. A. And Bela S.(2003). Profile of
Biochemical Risk Factors for Non Communicable Diseases in Urban, Rural and
Periurban Haryana, India
11. Bela S., Prashant M., (2005): Risk Factor Surveillance for Non-Communicable Diseases
(NCDs): The Multi-Site ICMR-WHO Collaborative Initiative
12. Betre, M., Kebede D. And Kassaye, M (1997). Modifiable Risk Factors for Coronary
Heart Disease among Young People in Addis Ababa. East Afr Med J 1997, 74(6):376-81.
Abstract
13. Baridalyne, N., Anita A., Lakshmy R., Ritvik, K. A. And Bela S.(2003). Profile of
Biochemical Risk Factors for Non Communicable Diseases in Urban, Rural and
Periurban Haryana, India
14. Bela S., Prashant M., (2005): Risk Factor Surveillance for Non-Communicable Diseases
(NCDs): The Multi-Site ICMR-WHO Collaborative Initiative
15. Betre, M., Kebede D. And Kassaye, M (1997). Modifiable Risk Factors for Coronary
Heart Disease among Young People in Addis Ababa. East Afr Med J 1997, 74(6):376-81.
Abstract
16. Biritwum, R. B., Gyapong, J. And Mensah, G. (2005).The Epidemiology of Obesity in
Ghana. Ghana Medical Journal, 2005; 39(3): 82-85.
17. Birth to Twenty Study (2002). Physical Activity and South African Children –Some
Shocking Findings. March 2002. Study Updates.
18. Bosu, W.K. (2007). Ghana’s National NCD Programme: History, Prospects And
Challenges. Paper Resented At The 1st Annual Workshop,
19. British Academy UK-Africa Academic Partnership On Chronic Disease In Africa,
Noguchi Memorial Institute For Medical Research. (12th April 2007)
20. Canadian Fitness And Lifestyle Research Institute (1998). Physical Inactivity Crisis Of
Children And Youth Continues to Worsen. February 2, 1998.
21. Cappuccio, F.P., Micah, F.B., Emmett, L., Kerry, S.M., Antwi, S., Martin-Peprah, R.,
Phillips, R.O., Plange-Rhule, J. And Eastwood, J.B. (2004). Prevalence, Detection,
Management, and Control of Hypertension In Ashanti, West Africa. Hypertension.
43(5):1017-22.
Daffodil International University Page 47
22. Cappuccio, F.P., Macgregor, G.A. (1991). Does Potassium Supplementation Lower
Blood Pressure? A Meta-Analysis of Published Trials. Journal of Hypertension: 466, Vol
9 No 5
23. Cent. D. (2005). Control Prev. 2005. Racial/Ethnic Disparities In Prevalence, Treatment,
and Control of Hypertension—United States, 1999–2002. MMWR. 54:7–9
24. Center for Disease Control and Prevention (2001). Increasing Physical Activity: A Report
on Recommendations of the Task Force on Community Preventive Services. Morbidity
And Mortality Weekly Report 50:1-16. Cutler, J., Macmahon, S., Peto, R., Collins, R.,
25. Cutler, J., Macmahon, S., Peto, R., Collins, R., Sorlie, P. (1990). Blood Pressure, Stroke
and Coronary Heart Disease. I, Prolonged Differences in Blood Pressure. Lancet (British
Edition)
26. Dekkers, J.C., Treiber, F.A., Kapuku, G., Snieder, H. (2003). Differential Influence of
Family History of Hypertension and Premature Myocardial Infarction on Systolic Blood
Pressure and Left Ventricular Mass Trajectories In Youth. Pediatrics 111:1387–93
27. Dodu, S.R.A. And De Heer, N. (1964).Ghana Medical Journal, 1964; 3:75.
28. Emmanuel, R., Abdurahman A., Adamson, S. M. ( 2007). Prevalence And Determinants
of Adolescent Tobacco Smoking In Addis Ababa, Ethiopia, BMC Public Health 2007,
7:176doi
29. Elliott, R.B., Pilcher, C.C., Fergusson, D.M., Stewart, A.W. (1996). A Population based
strategy to prevent Insulin-Dependent Diabetes Using Nicotinamide. J. Pediatr.
Endocrinol. Metab. 9 (5): 501–9. 8961125.
30. Ezzati, M., and Lopez, A.D. (2000). Measuring The Accumulated Hazards of Smoking:
Global and Regional Estimates For 2000 460. Tob Control 2003 Mar;12(1):79-85.
31. Fava, C., Burri, P., Almgren, P., Groop, L., Hulthen. U.L. And Melander, O. (2004).
Heritability of Ambulatory and Office Blood Pressure Phenotypes in Swedish Families.
J. Hypertens. 22:1717–21
32. Franklin, M., Jagoe, K., Edwards, R., Whiting, D., Unwin, N. (1990). Tobacco Smoking
in Tanzania, East Africa: Population Based Smoking Prevalence Using Expired Alveolar
Carbon Monoxide as a Validation Tool
33. Flegal, K.M., Carroll, M.D., Ogden, C.L., Johnson, C.L. (2002) - Prevalence And Trends
In Obesity Among US Adults, 1999-2000.American Medical Assoc.
Daffodil International University Page 48
34. Frantz, J., Phillips, J. And Amosun, S. (2003). Promotion Of Physical Activity In South
African Youth - Is It The Answer to the Public Health Burden Of Chronic Disease?
African Journal for Physical, Health Education, Recreation And Dance 9(2): 200-207.
35. Garrow, J.S. (1988). Obesity And Related Diseases. London: Churchill Livingstone;
1988. Pp. 1–16.
36. Galderisi, M., Benjamin, E.J., Evans, J.C., D’Agostino, R.B. (1993). Impact of Heart
Rate and PR Interval On Doppler Indexes Of Left Ventricular Diastolic Filling. The
American Journal of Cardiology, Ncbi.Nlm.Nih.Gov
37. Ghana Statistical Service (GSS).(2004). Noguchi Memorial Institute For Medical
Research (NMIMR)And ORC Macro. 2004.
38. Ghana Demographic and Health Survey, 2003. Ghana Statistical Service: Accra, Ghana,
2004.
39. Global Youth Tobacco Survey Collaborating Group (2003). Differences in Worldwide
Tobacco Use By Gender: Findings From The Global Youth Tobacco Survey. J Sch
Health 2003, 73:207-15. Abstract
40. Hajjar, I., Kotchen, T.A. (2003). Trends In Prevalence, Awareness, Treatment, And
Control Of Hypertension In The United States, 1988–2000. JAMA 290:199–206
41. Hajjar, I., Jane, M. K., Theodore A. K. (2006). Hypertension: Trends in Prevalence,
Incidence, and Control .Annual Review Of Public Health. Vol. 27: 465-490
42. Han, T.S., Seidell, J.C., Currall, J.E., Morrison, C.E., Deurenberg, P. (1997). Lean ME.
The Influences of Height and Age on Waist Circumferences as an Index of Adiposity in
Adults. Int J Obes Relat Metab Disord. 1997;21:83–89. []
43. Hublet, A., De Bacquer, D., Valimaa, R., Godeau, E., Schmid, H., Rehav, G. (2006)
Smoking Trends Among Adolescents from 1990 to 2002 In Ten European Countries And
Canada. BMC Public Health. 2006;6:280. []
44. Juliet, A., Liam, S. and David, A. L. (2006): Smoking Patterns In Ghanaian Civil
Servants: Changes Over Three Decades
45. Kaur, J. And Bains, K.(2006). A Study Of The Risk Factor Profile Of Cardiovascular
Diseases In Rural Punjabi Male Patients. Indian J Public Health 2006, 50(2):97-100.
Abstract.
Daffodil International University Page 49
46. Kearney, P.M., Whelton, M., Reynolds, K., Muntner, P., Whelton, P.K., He, J. (2005).
Global Burden of Hypertension: Analysis Of Worldwide Data. Lancet 365:217–23
47. Khaw, K.T., Barrett-Connor, E. (1988). Endogenous Sex Hormones and Cardiovascular
Disease in Men. A Prospective Population-Based Study. American Heart Assoc.
48. Kirstie, J., Edwards, R., Mugusi, F., Whiting, D., Unwin, N.(2001). Tobacco Smoking In
Tanzania, East Africa: Population Based Smoking Prevalence Using Expired Alveolar
Carbon Monoxide As A Validation Tool.
49. Lean, M.E.J., Han, T.S., Morrison, C.E. (1995). Waist Circumference as A Measure For
Indicating Need For Weight Management. Bri Med J. 1995;311:158–161.
50. Lopez, A.D., Matters, C.D.(2006). Measuring The Global Burden Of Disease And
Epidemiological Transitions: 2002–2030. Ann Trop Med Parasitol. 2006;100:481–499.
51. Mehan, M.B., Kantharia, N.B., Surabhi, S.(2007). Risk Factor Profile of Non-
Communicable Diseases In An Industrial Productive (25-59 Years) Population Of
Baroda. Int J Diab Dev Ctries 2007;27:116-21
52. Must, A., Spadano, J., Coakley, E.H., Field, A.E., Colditz, G., Dietz, W.H.(1999) The
Disease Burden Associated With Overweight And Obesity. JAMA 1999; 282: 1523-1529,
53. Murray, C.J.L., Lopez, A.D., (1996). Eds. Global Burden of Disease. Harvard, MA:
Harvard School of Public Health, 1996. (Vol 1 Of Global Burden Of Disease And Injury
Series.)
54. Nawi, N., Hans, St., Ruth, B., Mohammad, H., Stig, W., Lars, W. (2006): Preventable
Risk Factors For Non Communicable Diseases In Rural Indonesia:
55. Nieto, F.J., Alonso, J., Chambless, L.E., Zhong, M., Ceraso, M. (1995). Population
Awareness and Control Of Hypertension And Hypercholesterolemia. The Atherosclerosis
Risk in Communities Study. Arch. Intern. Med. 155:677–84
56. Owusu-Dabo, E., Lewis, S., McNeill, A., Gilmore, A., Bril, J.(2009). Smoking Uptake and
Prevalence in Ghana.
57. Pampel, F.C.(2002). Patterns Of Tobacco Use In The Early Epidemic Stages: Malawi And
Zambia, 2000–2002. Am J Pub Health. 2002;95:1009–1015.
58. Paffenbarger, R. S., Wing, A. L., Hyde, R. T. And Jung, D. L.(1983). Physical Activity And
Incidence Of Hypertension In College Alumni. Am J Epidemiol 1983; 117: 245–57.
Daffodil International University Page 50
59. Pesut, D.And Basara, H.Z.(2006).Cigarette Smoking And Lung Cancer Trends In Serbia – A
Ten Year Analysis. Med Pregl 2006, 59(5–6):225-9. Pubmed Abstract
60. Peto, R. And Lopez, A.D. (2004). The Future Worldwide Health Effects of Current Smoking
Patterns. In Tobacco: Science, Policy And Public Health. New York: Oxford University Press;
2004.
61. Pobee, J.O.M. (2006). The Heart Of The Matter. Community Profile of Cardiovascular
Diseases Of A Sub- Saharan African Country. 2006. Accra: Commercial Associates Ltd
62. Popkin, B.M. (1999). Urbanization, Lifestyle Changes and the Nutrition Transition. World
Development, 27(11): 1905-1999.
63. Roberts, D. E., Meakem, T. D., Dalton, C. E., Haverstick, D. M and Lynch, C. (2007).
Prevalence of Hyperglycemia in a Pre-Surgical Population . The Internet Journal of
Anesthesiology. 2007
64. Sugathan, T.N., Soman , C.R., Sankaranarayanann, K. (2006). Behavioural Risk Factors for
Non Communicable Diseases Amongadults In Kerala, India
65. Summerfield, L. (1998). Promoting Physical Activity and Exercise Among Children. Http://
Www. Kidssource.Com/
66. Toustad, S., Andrew-Johnston J. (2006). Cardiovascular Risks Associated With Smoking: A
Review For Clinicians. Eur J Cardiovasc Prev Rehabil 2006, 13(4):507-14. Pubmed Abstract
67. Townsend, L., Flisher, A.J., Gilreath, T., King G.(2006). A Systematic Review of Tobacco Use
Among Sub-Saharan Africa Youth. Journal of Substance Use 2006, 11(4):245-269.
68. Van, I.T. (1985). Health Implications of Overweight and Obesity In The United States. Ann
Intern Med. 1985;103:983–988.
69. Vorster, H.H. (2000). An Epidemiological Study of Hypertension and Its Determinants in a
Population in Transition: The THUSA Study. Journal of Human Hypertension, 14: 779-787.
70. Vasan, R.S., Larson, M.G., Leip, E.P., Evans, J.C. (2001). Impact Of High-Normal Blood
Pressure On The Risk Of Cardiovascular Disease. New England Journal Of Medicine.
Content.Nejm.Org
71. Wassertheil-Smoller, S., Anderson, G., Psaty, B.M., Black, H.R., Manson, J. (2000).
Hypertension And Its Treatment In Postmenopausal Women: Baseline Data From The
Women's Health Initiative. Hypertension 36:780–89
Daffodil International University Page 51
72. Wellington, E.(2002). Global Youth Tobacco Survey Fact Sheet, Ghana. Global Youth Tobacco
Survey Collaborative Group 2002 Mar 6.
73. Winkvist, A., Barcos, A., Berglund, G., Mulligan, A. (2007). -Public Health Nutrition,
Cambridge Univ Press Page 1. Diversity Of Dietary Patterns Observed In The European
Prospective
74. Wolf, H.K., Tuomilehto, J., Kuulasmaa, K., Domarkiene, S., Cepaitis, Z., Molarius, A., Sans, S.,
Dobson, A., Keil, U. Rywik, S.,(1997) . WHO MONICA Project. Blood Pressure Levels in The 41
Populations of the WHO MONICA Project. J Hum Hypertens 1997; 11:733-42. [Pubmed]
75. World Health Organization (2006). The WHO Stepwise Approach To Chronic Diseases Risk
Factor Surveillance. Chronic Non-Communicable Diseases Risk Factors Survey in Iraq2006
76. World Health Organisation, (2002). Obesity: Preventing and Managing the Global Epidemic:
Report of a WHO Consultation, Geneva. 2000. WHO Technical Report Series 894.
77. World Health Organisation (2001). Physical Activity. Department of Non-Communicable
Disease Prevention And Health Promotion.
78. World Health Organisation: Geneva. World Health Report (2001). Mental Health: New
Understanding New Hope. World Health Organisation, Geneva.
79. WHO/FAO. (2003). Diet, Nutrition and the Prevention of Chronic Diseases: Report of a Joint
WHO/FAO Expert Consultation. 2003. Geneva: WHO.
Daffodil International University Page 52
STEP 1: SELF REPORTED. DEMOGRAPHIC CHARACTERISTICS
No Questions Coding categories Code
1 What is your age? a) 20-40
b) 40-60
c) 60-80
d) 80 and above
2 What is your Sex? a) Male
b) Female
3 What is you Marital Status? a) Single
b) Married
c) Widowed
d) Divorced
4 What is your level of education? a) Never
b) Primary
c) Secondary
d) diploma
e) Bachelor degree and above
5 What is your current profession? a) House wife
b) civil society
c) self employee
d) Health worker
Daffodil International University Page 53
SECTION B: BEHAVIOURAL MEASUREMENTS
Tobacco Use
8 Which of the following best describes your smoking
status ?
a) Never smoke
b) Current smoker
c) Ex-smoker
9 At what age did you started smoking? a) 20 years
b) 40 years
c) 50 years and above
d) Non
10 Do you smoke any of the tobacco products? such as
pipes or cigarettes daily?
a) Yes
b) No
11 How many time in a day do you smoke? a) One time a day
b) Two times a day
c) Three times aday
d) None
12 What is your general attitude towards smoking? a) Wish to stop
b) Good for my use 3.
c) Like to smoke
6 What is your House hold size? a) One
b) Two
c) Three
d) Four
e) Greater than four
7 What is your family’s total income in
each month? (In sh.so)?
a) ≤ 3000000
b) 3500000-5000000
c) 5000000-5500000
d) 6000000 and above
Daffodil International University Page 54
13 Do you belief that smoking is harmful? a) Yes
b) No
Dietary Behaviour
14 In a typical week, how many days do you
eat fruit?
a) One day
b) Two days
c) Three days
d) Four days
15 In a typical week, on how many days do you eat
Vegetables?
a) One day
b) two days
c) Three days
d) Four days
17 What type of oils or fat is most often used for meal
preparation in your household?
a) Vegetable oil
b) Lard 3. Butter
c) Margarine
d) Peanut butter
18 Which of the following best describes your salt intake
ability.
a) Low
b) Moderate
c) 3. High
19 On average, how many spoonful of salt is taken per
meal/day?
a) One
b) Two
c) Three
d) four
20 On the average, how many kilos of sugar is consumed
per week?
a) One kg
b) Two kg
c) Three kg
d) Four kg
Physical activity
21 Does your work involve mostly sitting or standing,
with walking for not more than 30 minutes at a
time?
a) Yes
b) No
22 Does your work involve vigorous-intensity activity a) Yes
Daffodil International University Page 55
that causes large increase in breathing or heart rate
for at least 10 minutes continuously?
b) No
23 In a typical week, on how many days do you do
moderate intensity activities as part of your work?
a) One day
b) Two days
c) Three days
d) Four days
e) Five days
24 How long is your typical working day? a) Whole day
b) 8 hours
c) 6 hours
d) 3 hours
25 Do you walk or use a bicycle (pedal cycle) for at least
10 minutes continuously to get to and from places?
a) Yes
b) No
SECTION C: BODY MASS INDEX
Question Category code
26 What is your body mass
index?
BM1(BMI-Kg/m2
a) less than 14.9
b) from 15 to 18.4
c) from 18.5 to 22.9
d) from 23 to 27.5
e) from 27.6 to 40
f) greater than 40
SECTION D: BIOCHEMICAL MEASUREMENTS
Blood Glucose
Daffodil International University Page 56
27 During the past 12 hours have you had anything to eat or
drink, other than water?
a) Yes
b) No
28 Fasting blood glucose
Choose accordingly: mmol/l or mg/dl
a) Low
b) High
Blood Lipids
29 Total cholesterol
Choose accordingly: mmol/l or mg/dl
a) Low
b) High
30 HDL Cholesterol
Choose accordingly: mmol/l or mg/dl
a) Low
b) High
c) Unable
Daffodil International University Page 57

Más contenido relacionado

La actualidad más candente

PREVALENCE OF NON-COMMUNICABLE DISEASE
PREVALENCE OF NON-COMMUNICABLE DISEASEPREVALENCE OF NON-COMMUNICABLE DISEASE
PREVALENCE OF NON-COMMUNICABLE DISEASEPublic Health Update
 
Non Communicable Disease: Prevention and Mangement
Non Communicable Disease: Prevention and Mangement Non Communicable Disease: Prevention and Mangement
Non Communicable Disease: Prevention and Mangement Dr. Nizam Uddin Ahmed
 
NCD presentation.pptx
NCD presentation.pptxNCD presentation.pptx
NCD presentation.pptxPoojakarki10
 
Human life expectancy
Human life expectancyHuman life expectancy
Human life expectancyOther Mother
 
Non communicable diseases
Non communicable diseasesNon communicable diseases
Non communicable diseasesJohny Wilbert
 
Prevention of Non-Communicable Diseases in Malaysia
Prevention of Non-Communicable Diseases in MalaysiaPrevention of Non-Communicable Diseases in Malaysia
Prevention of Non-Communicable Diseases in MalaysiaAzmi Mohd Tamil
 
NCDs Risk Assessment and Vision Screening
NCDs Risk Assessment and Vision ScreeningNCDs Risk Assessment and Vision Screening
NCDs Risk Assessment and Vision ScreeningMohammad Aslam Shaiekh
 
COMMUNICABLE AND NON COMMUNICABLE DISEASES
COMMUNICABLE AND NON COMMUNICABLE DISEASESCOMMUNICABLE AND NON COMMUNICABLE DISEASES
COMMUNICABLE AND NON COMMUNICABLE DISEASESAAYUSHI SAHA
 
Ncd non communicable diseases presentation
Ncd non communicable diseases presentationNcd non communicable diseases presentation
Ncd non communicable diseases presentationMohan Bastola
 
Health, life expectancy and cost of living
Health, life expectancy and cost of livingHealth, life expectancy and cost of living
Health, life expectancy and cost of livingHamzat Zaheed Adekunle
 
Health in sustainable development goals
Health in sustainable development goalsHealth in sustainable development goals
Health in sustainable development goalsTahani Bashir
 
Health transition
Health transitionHealth transition
Health transitionZakiul Alam
 
Non communicable diseases
Non communicable diseasesNon communicable diseases
Non communicable diseasesAdam Bentley
 
NON COMMUNICABLE DISEASE komal
NON COMMUNICABLE DISEASE komalNON COMMUNICABLE DISEASE komal
NON COMMUNICABLE DISEASE komalDr.Rani Komal Lata
 
Strategies for promoting health
Strategies for promoting healthStrategies for promoting health
Strategies for promoting healthG Masso
 
Triple burden of disease
Triple burden of diseaseTriple burden of disease
Triple burden of diseaseSushantLuitel1
 

La actualidad más candente (20)

Environmental health
Environmental healthEnvironmental health
Environmental health
 
PREVALENCE OF NON-COMMUNICABLE DISEASE
PREVALENCE OF NON-COMMUNICABLE DISEASEPREVALENCE OF NON-COMMUNICABLE DISEASE
PREVALENCE OF NON-COMMUNICABLE DISEASE
 
Non Communicable Disease: Prevention and Mangement
Non Communicable Disease: Prevention and Mangement Non Communicable Disease: Prevention and Mangement
Non Communicable Disease: Prevention and Mangement
 
NCD presentation.pptx
NCD presentation.pptxNCD presentation.pptx
NCD presentation.pptx
 
Human life expectancy
Human life expectancyHuman life expectancy
Human life expectancy
 
Non communicable diseases
Non communicable diseasesNon communicable diseases
Non communicable diseases
 
Prevention of Non-Communicable Diseases in Malaysia
Prevention of Non-Communicable Diseases in MalaysiaPrevention of Non-Communicable Diseases in Malaysia
Prevention of Non-Communicable Diseases in Malaysia
 
NCDs Risk Assessment and Vision Screening
NCDs Risk Assessment and Vision ScreeningNCDs Risk Assessment and Vision Screening
NCDs Risk Assessment and Vision Screening
 
COMMUNICABLE AND NON COMMUNICABLE DISEASES
COMMUNICABLE AND NON COMMUNICABLE DISEASESCOMMUNICABLE AND NON COMMUNICABLE DISEASES
COMMUNICABLE AND NON COMMUNICABLE DISEASES
 
Ncd non communicable diseases presentation
Ncd non communicable diseases presentationNcd non communicable diseases presentation
Ncd non communicable diseases presentation
 
Health, life expectancy and cost of living
Health, life expectancy and cost of livingHealth, life expectancy and cost of living
Health, life expectancy and cost of living
 
32311
3231132311
32311
 
Health in sustainable development goals
Health in sustainable development goalsHealth in sustainable development goals
Health in sustainable development goals
 
Health transition
Health transitionHealth transition
Health transition
 
Non communicable diseases
Non communicable diseasesNon communicable diseases
Non communicable diseases
 
NON COMMUNICABLE DISEASE komal
NON COMMUNICABLE DISEASE komalNON COMMUNICABLE DISEASE komal
NON COMMUNICABLE DISEASE komal
 
Management of NCDs in PHC setting
Management of NCDs in PHC setting Management of NCDs in PHC setting
Management of NCDs in PHC setting
 
Strategies for promoting health
Strategies for promoting healthStrategies for promoting health
Strategies for promoting health
 
NCDs Burden in Bangladesh
NCDs Burden in BangladeshNCDs Burden in Bangladesh
NCDs Burden in Bangladesh
 
Triple burden of disease
Triple burden of diseaseTriple burden of disease
Triple burden of disease
 

Similar a foctors of non-communicable dideases

Running head ASSIGNMENT 3 1ASSIGNMENT 3 4
Running head ASSIGNMENT 3 1ASSIGNMENT 3 4Running head ASSIGNMENT 3 1ASSIGNMENT 3 4
Running head ASSIGNMENT 3 1ASSIGNMENT 3 4MalikPinckney86
 
Non communicable diseases and oral health
Non communicable diseases and oral healthNon communicable diseases and oral health
Non communicable diseases and oral healthDrRipika Sharma
 
GLOBAL HEALTH AND DISEASEChapter 2Chapter 2 OverviewI
GLOBAL HEALTH AND DISEASEChapter 2Chapter 2 OverviewIGLOBAL HEALTH AND DISEASEChapter 2Chapter 2 OverviewI
GLOBAL HEALTH AND DISEASEChapter 2Chapter 2 OverviewIMatthewTennant613
 
Epidemiological Approach to Disease and Intervention
Epidemiological Approach to Disease and InterventionEpidemiological Approach to Disease and Intervention
Epidemiological Approach to Disease and InterventionMuhammad Rafique
 
NCD Prevention and Control as a Health System Strengthening Intervention
NCD Prevention and Control as a Health System Strengthening InterventionNCD Prevention and Control as a Health System Strengthening Intervention
NCD Prevention and Control as a Health System Strengthening InterventionAlbert Domingo
 
The Challenges of Global Health
The Challenges of Global HealthThe Challenges of Global Health
The Challenges of Global HealthPuneetKour8
 
Assessment of the level of awareness on AIDS/HIV in Johor, Malaysia
Assessment of the level of awareness on AIDS/HIV in Johor, MalaysiaAssessment of the level of awareness on AIDS/HIV in Johor, Malaysia
Assessment of the level of awareness on AIDS/HIV in Johor, MalaysiaSriramNagarajan17
 
Burden of depressive disorders by country, sex, age, and year findings from t...
Burden of depressive disorders by country, sex, age, and year findings from t...Burden of depressive disorders by country, sex, age, and year findings from t...
Burden of depressive disorders by country, sex, age, and year findings from t...Lilin Rosyanti Poltekkes kemenkes kendari
 
12-public_health_non_communicable_disease_0.pptx
12-public_health_non_communicable_disease_0.pptx12-public_health_non_communicable_disease_0.pptx
12-public_health_non_communicable_disease_0.pptxkprudhviraj5
 
Noncommunicable diseases (NCDs) account for 71% of the deaths worldwide
   Noncommunicable diseases (NCDs) account for 71% of the deaths worldwide   Noncommunicable diseases (NCDs) account for 71% of the deaths worldwide
Noncommunicable diseases (NCDs) account for 71% of the deaths worldwideΔρ. Γιώργος K. Κασάπης
 
10088 Final.docx
10088 Final.docx10088 Final.docx
10088 Final.docxwarisha22
 
Running head CHRONIC KIDNEY DISEASE 1 .docx
Running head CHRONIC KIDNEY DISEASE 1 .docxRunning head CHRONIC KIDNEY DISEASE 1 .docx
Running head CHRONIC KIDNEY DISEASE 1 .docxtodd271
 
A Study of the Prevalence of Cardio-Vascular Diseases and Its Risk Factors (B...
A Study of the Prevalence of Cardio-Vascular Diseases and Its Risk Factors (B...A Study of the Prevalence of Cardio-Vascular Diseases and Its Risk Factors (B...
A Study of the Prevalence of Cardio-Vascular Diseases and Its Risk Factors (B...inventionjournals
 
Philippine Perspectives: Noncommunicable Diseases, Risk Factors and Health In...
Philippine Perspectives: Noncommunicable Diseases, Risk Factors and Health In...Philippine Perspectives: Noncommunicable Diseases, Risk Factors and Health In...
Philippine Perspectives: Noncommunicable Diseases, Risk Factors and Health In...Albert Domingo
 
Analysis for the global burden of disease study 2016 lancet 2017
Analysis for the global burden of disease study 2016   lancet 2017Analysis for the global burden of disease study 2016   lancet 2017
Analysis for the global burden of disease study 2016 lancet 2017Luis Sales
 

Similar a foctors of non-communicable dideases (20)

Running head ASSIGNMENT 3 1ASSIGNMENT 3 4
Running head ASSIGNMENT 3 1ASSIGNMENT 3 4Running head ASSIGNMENT 3 1ASSIGNMENT 3 4
Running head ASSIGNMENT 3 1ASSIGNMENT 3 4
 
Non communicable diseases and oral health
Non communicable diseases and oral healthNon communicable diseases and oral health
Non communicable diseases and oral health
 
Rjpbcs volume 4 issue 1
Rjpbcs volume 4 issue 1Rjpbcs volume 4 issue 1
Rjpbcs volume 4 issue 1
 
GLOBAL HEALTH AND DISEASEChapter 2Chapter 2 OverviewI
GLOBAL HEALTH AND DISEASEChapter 2Chapter 2 OverviewIGLOBAL HEALTH AND DISEASEChapter 2Chapter 2 OverviewI
GLOBAL HEALTH AND DISEASEChapter 2Chapter 2 OverviewI
 
Epidemiological Approach to Disease and Intervention
Epidemiological Approach to Disease and InterventionEpidemiological Approach to Disease and Intervention
Epidemiological Approach to Disease and Intervention
 
NCD Prevention and Control as a Health System Strengthening Intervention
NCD Prevention and Control as a Health System Strengthening InterventionNCD Prevention and Control as a Health System Strengthening Intervention
NCD Prevention and Control as a Health System Strengthening Intervention
 
The Challenges of Global Health
The Challenges of Global HealthThe Challenges of Global Health
The Challenges of Global Health
 
Assessment of the level of awareness on AIDS/HIV in Johor, Malaysia
Assessment of the level of awareness on AIDS/HIV in Johor, MalaysiaAssessment of the level of awareness on AIDS/HIV in Johor, Malaysia
Assessment of the level of awareness on AIDS/HIV in Johor, Malaysia
 
Burden of depressive disorders by country, sex, age, and year findings from t...
Burden of depressive disorders by country, sex, age, and year findings from t...Burden of depressive disorders by country, sex, age, and year findings from t...
Burden of depressive disorders by country, sex, age, and year findings from t...
 
12-public_health_non_communicable_disease_0.pptx
12-public_health_non_communicable_disease_0.pptx12-public_health_non_communicable_disease_0.pptx
12-public_health_non_communicable_disease_0.pptx
 
One
OneOne
One
 
Noncommunicable diseases (NCDs) account for 71% of the deaths worldwide
   Noncommunicable diseases (NCDs) account for 71% of the deaths worldwide   Noncommunicable diseases (NCDs) account for 71% of the deaths worldwide
Noncommunicable diseases (NCDs) account for 71% of the deaths worldwide
 
2021 p los-one-open-access
2021 p los-one-open-access2021 p los-one-open-access
2021 p los-one-open-access
 
10088 Final.docx
10088 Final.docx10088 Final.docx
10088 Final.docx
 
Running head CHRONIC KIDNEY DISEASE 1 .docx
Running head CHRONIC KIDNEY DISEASE 1 .docxRunning head CHRONIC KIDNEY DISEASE 1 .docx
Running head CHRONIC KIDNEY DISEASE 1 .docx
 
MATERI 1 introduction CD NCD.pptx
MATERI 1 introduction CD  NCD.pptxMATERI 1 introduction CD  NCD.pptx
MATERI 1 introduction CD NCD.pptx
 
Jiom december, 2012; 343
Jiom december, 2012; 343Jiom december, 2012; 343
Jiom december, 2012; 343
 
A Study of the Prevalence of Cardio-Vascular Diseases and Its Risk Factors (B...
A Study of the Prevalence of Cardio-Vascular Diseases and Its Risk Factors (B...A Study of the Prevalence of Cardio-Vascular Diseases and Its Risk Factors (B...
A Study of the Prevalence of Cardio-Vascular Diseases and Its Risk Factors (B...
 
Philippine Perspectives: Noncommunicable Diseases, Risk Factors and Health In...
Philippine Perspectives: Noncommunicable Diseases, Risk Factors and Health In...Philippine Perspectives: Noncommunicable Diseases, Risk Factors and Health In...
Philippine Perspectives: Noncommunicable Diseases, Risk Factors and Health In...
 
Analysis for the global burden of disease study 2016 lancet 2017
Analysis for the global burden of disease study 2016   lancet 2017Analysis for the global burden of disease study 2016   lancet 2017
Analysis for the global burden of disease study 2016 lancet 2017
 

Más de said warsame

Delay in a seeking care among tuberculosis patients attending tuberculosis cl...
Delay in a seeking care among tuberculosis patients attending tuberculosis cl...Delay in a seeking care among tuberculosis patients attending tuberculosis cl...
Delay in a seeking care among tuberculosis patients attending tuberculosis cl...said warsame
 
Questionnare omplete
Questionnare ompleteQuestionnare omplete
Questionnare ompletesaid warsame
 
Lecture 12-laboratory and field investigation
Lecture 12-laboratory and field investigation Lecture 12-laboratory and field investigation
Lecture 12-laboratory and field investigation said warsame
 
Lecture 11-qualitycontrolinserology-110711110534-phpapp01
Lecture 11-qualitycontrolinserology-110711110534-phpapp01Lecture 11-qualitycontrolinserology-110711110534-phpapp01
Lecture 11-qualitycontrolinserology-110711110534-phpapp01said warsame
 
Lecture11 and 12qualitycontrolinserology-110711110534-phpapp01
Lecture11 and 12qualitycontrolinserology-110711110534-phpapp01Lecture11 and 12qualitycontrolinserology-110711110534-phpapp01
Lecture11 and 12qualitycontrolinserology-110711110534-phpapp01said warsame
 
Lecture 10 toxoplasmosis
Lecture 10 toxoplasmosisLecture 10 toxoplasmosis
Lecture 10 toxoplasmosissaid warsame
 
Lecture 9-rheumatoid factor
Lecture 9-rheumatoid factorLecture 9-rheumatoid factor
Lecture 9-rheumatoid factorsaid warsame
 
Lecture 8-streptolysin o
Lecture 8-streptolysin oLecture 8-streptolysin o
Lecture 8-streptolysin osaid warsame
 
Lecture 7-c-reactive protein
Lecture 7-c-reactive proteinLecture 7-c-reactive protein
Lecture 7-c-reactive proteinsaid warsame
 
Lecture 5-human immunodeficiency
Lecture 5-human immunodeficiencyLecture 5-human immunodeficiency
Lecture 5-human immunodeficiencysaid warsame
 
Lecture 4-human chorionic
Lecture 4-human chorionicLecture 4-human chorionic
Lecture 4-human chorionicsaid warsame
 
Lecture 3- agglutination test for
Lecture 3- agglutination test forLecture 3- agglutination test for
Lecture 3- agglutination test forsaid warsame
 
Lecture 2-syphilis serology
Lecture 2-syphilis serologyLecture 2-syphilis serology
Lecture 2-syphilis serologysaid warsame
 
Lecture 1- nitoduction to clinical serology
Lecture 1- nitoduction to clinical serology  Lecture 1- nitoduction to clinical serology
Lecture 1- nitoduction to clinical serology said warsame
 
Lecture 6-hepatitis
Lecture  6-hepatitis            Lecture  6-hepatitis
Lecture 6-hepatitis said warsame
 
Lecture 10-sterilization and
Lecture 10-sterilization andLecture 10-sterilization and
Lecture 10-sterilization andsaid warsame
 
Lecture 8-laboratory accidents and
Lecture 8-laboratory accidents andLecture 8-laboratory accidents and
Lecture 8-laboratory accidents andsaid warsame
 
Lecture 1- nitoduction to clinical serology
Lecture 1- nitoduction to clinical serologyLecture 1- nitoduction to clinical serology
Lecture 1- nitoduction to clinical serologysaid warsame
 

Más de said warsame (18)

Delay in a seeking care among tuberculosis patients attending tuberculosis cl...
Delay in a seeking care among tuberculosis patients attending tuberculosis cl...Delay in a seeking care among tuberculosis patients attending tuberculosis cl...
Delay in a seeking care among tuberculosis patients attending tuberculosis cl...
 
Questionnare omplete
Questionnare ompleteQuestionnare omplete
Questionnare omplete
 
Lecture 12-laboratory and field investigation
Lecture 12-laboratory and field investigation Lecture 12-laboratory and field investigation
Lecture 12-laboratory and field investigation
 
Lecture 11-qualitycontrolinserology-110711110534-phpapp01
Lecture 11-qualitycontrolinserology-110711110534-phpapp01Lecture 11-qualitycontrolinserology-110711110534-phpapp01
Lecture 11-qualitycontrolinserology-110711110534-phpapp01
 
Lecture11 and 12qualitycontrolinserology-110711110534-phpapp01
Lecture11 and 12qualitycontrolinserology-110711110534-phpapp01Lecture11 and 12qualitycontrolinserology-110711110534-phpapp01
Lecture11 and 12qualitycontrolinserology-110711110534-phpapp01
 
Lecture 10 toxoplasmosis
Lecture 10 toxoplasmosisLecture 10 toxoplasmosis
Lecture 10 toxoplasmosis
 
Lecture 9-rheumatoid factor
Lecture 9-rheumatoid factorLecture 9-rheumatoid factor
Lecture 9-rheumatoid factor
 
Lecture 8-streptolysin o
Lecture 8-streptolysin oLecture 8-streptolysin o
Lecture 8-streptolysin o
 
Lecture 7-c-reactive protein
Lecture 7-c-reactive proteinLecture 7-c-reactive protein
Lecture 7-c-reactive protein
 
Lecture 5-human immunodeficiency
Lecture 5-human immunodeficiencyLecture 5-human immunodeficiency
Lecture 5-human immunodeficiency
 
Lecture 4-human chorionic
Lecture 4-human chorionicLecture 4-human chorionic
Lecture 4-human chorionic
 
Lecture 3- agglutination test for
Lecture 3- agglutination test forLecture 3- agglutination test for
Lecture 3- agglutination test for
 
Lecture 2-syphilis serology
Lecture 2-syphilis serologyLecture 2-syphilis serology
Lecture 2-syphilis serology
 
Lecture 1- nitoduction to clinical serology
Lecture 1- nitoduction to clinical serology  Lecture 1- nitoduction to clinical serology
Lecture 1- nitoduction to clinical serology
 
Lecture 6-hepatitis
Lecture  6-hepatitis            Lecture  6-hepatitis
Lecture 6-hepatitis
 
Lecture 10-sterilization and
Lecture 10-sterilization andLecture 10-sterilization and
Lecture 10-sterilization and
 
Lecture 8-laboratory accidents and
Lecture 8-laboratory accidents andLecture 8-laboratory accidents and
Lecture 8-laboratory accidents and
 
Lecture 1- nitoduction to clinical serology
Lecture 1- nitoduction to clinical serologyLecture 1- nitoduction to clinical serology
Lecture 1- nitoduction to clinical serology
 

Último

bhubaneswar Call Girls 👙 6297143586 👙 Genuine WhatsApp Number for Real Meet
bhubaneswar Call Girls 👙 6297143586 👙 Genuine WhatsApp Number for Real Meetbhubaneswar Call Girls 👙 6297143586 👙 Genuine WhatsApp Number for Real Meet
bhubaneswar Call Girls 👙 6297143586 👙 Genuine WhatsApp Number for Real MeetCall Girls Service
 
palanpur Call Girls 👙 6297143586 👙 Genuine WhatsApp Number for Real Meet
palanpur Call Girls 👙 6297143586 👙 Genuine WhatsApp Number for Real Meetpalanpur Call Girls 👙 6297143586 👙 Genuine WhatsApp Number for Real Meet
palanpur Call Girls 👙 6297143586 👙 Genuine WhatsApp Number for Real MeetCall Girls Service
 
Krishnagiri call girls Tamil aunty 7877702510
Krishnagiri call girls Tamil aunty 7877702510Krishnagiri call girls Tamil aunty 7877702510
Krishnagiri call girls Tamil aunty 7877702510Vipesco
 
Mathura Call Girls 👙 6297143586 👙 Genuine WhatsApp Number for Real Meet
Mathura Call Girls 👙 6297143586 👙 Genuine WhatsApp Number for Real MeetMathura Call Girls 👙 6297143586 👙 Genuine WhatsApp Number for Real Meet
Mathura Call Girls 👙 6297143586 👙 Genuine WhatsApp Number for Real MeetCall Girls Service
 
Call Girls Thane Just Call 9907093804 Top Class Call Girl Service Available
Call Girls Thane Just Call 9907093804 Top Class Call Girl Service AvailableCall Girls Thane Just Call 9907093804 Top Class Call Girl Service Available
Call Girls Thane Just Call 9907093804 Top Class Call Girl Service AvailableDipal Arora
 
neemuch Call Girls 👙 6297143586 👙 Genuine WhatsApp Number for Real Meet
neemuch Call Girls 👙 6297143586 👙 Genuine WhatsApp Number for Real Meetneemuch Call Girls 👙 6297143586 👙 Genuine WhatsApp Number for Real Meet
neemuch Call Girls 👙 6297143586 👙 Genuine WhatsApp Number for Real MeetCall Girls Service
 
Muzaffarpur Call Girls 👙 6297143586 👙 Genuine WhatsApp Number for Real Meet
Muzaffarpur Call Girls 👙 6297143586 👙 Genuine WhatsApp Number for Real MeetMuzaffarpur Call Girls 👙 6297143586 👙 Genuine WhatsApp Number for Real Meet
Muzaffarpur Call Girls 👙 6297143586 👙 Genuine WhatsApp Number for Real MeetCall Girls Service
 
Call Girls Service Anantapur 📲 6297143586 Book Now VIP Call Girls in Anantapur
Call Girls Service Anantapur 📲 6297143586 Book Now VIP Call Girls in AnantapurCall Girls Service Anantapur 📲 6297143586 Book Now VIP Call Girls in Anantapur
Call Girls Service Anantapur 📲 6297143586 Book Now VIP Call Girls in Anantapurgragmanisha42
 
Bhagalpur Call Girls 👙 6297143586 👙 Genuine WhatsApp Number for Real Meet
Bhagalpur Call Girls 👙 6297143586 👙 Genuine WhatsApp Number for Real MeetBhagalpur Call Girls 👙 6297143586 👙 Genuine WhatsApp Number for Real Meet
Bhagalpur Call Girls 👙 6297143586 👙 Genuine WhatsApp Number for Real MeetCall Girls Service
 
Mangalore Call Girls 👙 6297143586 👙 Genuine WhatsApp Number for Real Meet
Mangalore Call Girls 👙 6297143586 👙 Genuine WhatsApp Number for Real MeetMangalore Call Girls 👙 6297143586 👙 Genuine WhatsApp Number for Real Meet
Mangalore Call Girls 👙 6297143586 👙 Genuine WhatsApp Number for Real MeetCall Girls Service
 
Ozhukarai Call Girls 👙 6297143586 👙 Genuine WhatsApp Number for Real Meet
Ozhukarai Call Girls 👙 6297143586 👙 Genuine WhatsApp Number for Real MeetOzhukarai Call Girls 👙 6297143586 👙 Genuine WhatsApp Number for Real Meet
Ozhukarai Call Girls 👙 6297143586 👙 Genuine WhatsApp Number for Real MeetCall Girls Service
 
Jaipur Call Girls 9257276172 Call Girl in Jaipur Rajasthan
Jaipur Call Girls 9257276172 Call Girl in Jaipur RajasthanJaipur Call Girls 9257276172 Call Girl in Jaipur Rajasthan
Jaipur Call Girls 9257276172 Call Girl in Jaipur Rajasthanindiancallgirl4rent
 
Nanded Call Girls 👙 6297143586 👙 Genuine WhatsApp Number for Real Meet
Nanded Call Girls 👙 6297143586 👙 Genuine WhatsApp Number for Real MeetNanded Call Girls 👙 6297143586 👙 Genuine WhatsApp Number for Real Meet
Nanded Call Girls 👙 6297143586 👙 Genuine WhatsApp Number for Real MeetCall Girls Service
 
Hubli Call Girls 👙 6297143586 👙 Genuine WhatsApp Number for Real Meet
Hubli Call Girls 👙 6297143586 👙 Genuine WhatsApp Number for Real MeetHubli Call Girls 👙 6297143586 👙 Genuine WhatsApp Number for Real Meet
Hubli Call Girls 👙 6297143586 👙 Genuine WhatsApp Number for Real MeetCall Girls Service
 
Patna Call Girls 👙 6297143586 👙 Genuine WhatsApp Number for Real Meet
Patna Call Girls 👙 6297143586 👙 Genuine WhatsApp Number for Real MeetPatna Call Girls 👙 6297143586 👙 Genuine WhatsApp Number for Real Meet
Patna Call Girls 👙 6297143586 👙 Genuine WhatsApp Number for Real MeetCall Girls Service
 
Call Girls Hyderabad Just Call 9907093804 Top Class Call Girl Service Available
Call Girls Hyderabad Just Call 9907093804 Top Class Call Girl Service AvailableCall Girls Hyderabad Just Call 9907093804 Top Class Call Girl Service Available
Call Girls Hyderabad Just Call 9907093804 Top Class Call Girl Service AvailableDipal Arora
 
ooty Call Girls 👙 6297143586 👙 Genuine WhatsApp Number for Real Meet
ooty Call Girls 👙 6297143586 👙 Genuine WhatsApp Number for Real Meetooty Call Girls 👙 6297143586 👙 Genuine WhatsApp Number for Real Meet
ooty Call Girls 👙 6297143586 👙 Genuine WhatsApp Number for Real MeetCall Girls Service
 
dhanbad Call Girls 👙 6297143586 👙 Genuine WhatsApp Number for Real Meet
dhanbad Call Girls 👙 6297143586 👙 Genuine WhatsApp Number for Real Meetdhanbad Call Girls 👙 6297143586 👙 Genuine WhatsApp Number for Real Meet
dhanbad Call Girls 👙 6297143586 👙 Genuine WhatsApp Number for Real MeetCall Girls Service
 
Call Girls Service In Goa 💋 9316020077💋 Goa Call Girls By Russian Call Girl...
Call Girls Service In Goa  💋 9316020077💋 Goa Call Girls  By Russian Call Girl...Call Girls Service In Goa  💋 9316020077💋 Goa Call Girls  By Russian Call Girl...
Call Girls Service In Goa 💋 9316020077💋 Goa Call Girls By Russian Call Girl...russian goa call girl and escorts service
 
Vip Call Girls Makarba 👙 6367187148 👙 Genuine WhatsApp Number for Real Meet
Vip Call Girls Makarba 👙 6367187148 👙 Genuine WhatsApp Number for Real MeetVip Call Girls Makarba 👙 6367187148 👙 Genuine WhatsApp Number for Real Meet
Vip Call Girls Makarba 👙 6367187148 👙 Genuine WhatsApp Number for Real MeetAhmedabad Call Girls
 

Último (20)

bhubaneswar Call Girls 👙 6297143586 👙 Genuine WhatsApp Number for Real Meet
bhubaneswar Call Girls 👙 6297143586 👙 Genuine WhatsApp Number for Real Meetbhubaneswar Call Girls 👙 6297143586 👙 Genuine WhatsApp Number for Real Meet
bhubaneswar Call Girls 👙 6297143586 👙 Genuine WhatsApp Number for Real Meet
 
palanpur Call Girls 👙 6297143586 👙 Genuine WhatsApp Number for Real Meet
palanpur Call Girls 👙 6297143586 👙 Genuine WhatsApp Number for Real Meetpalanpur Call Girls 👙 6297143586 👙 Genuine WhatsApp Number for Real Meet
palanpur Call Girls 👙 6297143586 👙 Genuine WhatsApp Number for Real Meet
 
Krishnagiri call girls Tamil aunty 7877702510
Krishnagiri call girls Tamil aunty 7877702510Krishnagiri call girls Tamil aunty 7877702510
Krishnagiri call girls Tamil aunty 7877702510
 
Mathura Call Girls 👙 6297143586 👙 Genuine WhatsApp Number for Real Meet
Mathura Call Girls 👙 6297143586 👙 Genuine WhatsApp Number for Real MeetMathura Call Girls 👙 6297143586 👙 Genuine WhatsApp Number for Real Meet
Mathura Call Girls 👙 6297143586 👙 Genuine WhatsApp Number for Real Meet
 
Call Girls Thane Just Call 9907093804 Top Class Call Girl Service Available
Call Girls Thane Just Call 9907093804 Top Class Call Girl Service AvailableCall Girls Thane Just Call 9907093804 Top Class Call Girl Service Available
Call Girls Thane Just Call 9907093804 Top Class Call Girl Service Available
 
neemuch Call Girls 👙 6297143586 👙 Genuine WhatsApp Number for Real Meet
neemuch Call Girls 👙 6297143586 👙 Genuine WhatsApp Number for Real Meetneemuch Call Girls 👙 6297143586 👙 Genuine WhatsApp Number for Real Meet
neemuch Call Girls 👙 6297143586 👙 Genuine WhatsApp Number for Real Meet
 
Muzaffarpur Call Girls 👙 6297143586 👙 Genuine WhatsApp Number for Real Meet
Muzaffarpur Call Girls 👙 6297143586 👙 Genuine WhatsApp Number for Real MeetMuzaffarpur Call Girls 👙 6297143586 👙 Genuine WhatsApp Number for Real Meet
Muzaffarpur Call Girls 👙 6297143586 👙 Genuine WhatsApp Number for Real Meet
 
Call Girls Service Anantapur 📲 6297143586 Book Now VIP Call Girls in Anantapur
Call Girls Service Anantapur 📲 6297143586 Book Now VIP Call Girls in AnantapurCall Girls Service Anantapur 📲 6297143586 Book Now VIP Call Girls in Anantapur
Call Girls Service Anantapur 📲 6297143586 Book Now VIP Call Girls in Anantapur
 
Bhagalpur Call Girls 👙 6297143586 👙 Genuine WhatsApp Number for Real Meet
Bhagalpur Call Girls 👙 6297143586 👙 Genuine WhatsApp Number for Real MeetBhagalpur Call Girls 👙 6297143586 👙 Genuine WhatsApp Number for Real Meet
Bhagalpur Call Girls 👙 6297143586 👙 Genuine WhatsApp Number for Real Meet
 
Mangalore Call Girls 👙 6297143586 👙 Genuine WhatsApp Number for Real Meet
Mangalore Call Girls 👙 6297143586 👙 Genuine WhatsApp Number for Real MeetMangalore Call Girls 👙 6297143586 👙 Genuine WhatsApp Number for Real Meet
Mangalore Call Girls 👙 6297143586 👙 Genuine WhatsApp Number for Real Meet
 
Ozhukarai Call Girls 👙 6297143586 👙 Genuine WhatsApp Number for Real Meet
Ozhukarai Call Girls 👙 6297143586 👙 Genuine WhatsApp Number for Real MeetOzhukarai Call Girls 👙 6297143586 👙 Genuine WhatsApp Number for Real Meet
Ozhukarai Call Girls 👙 6297143586 👙 Genuine WhatsApp Number for Real Meet
 
Jaipur Call Girls 9257276172 Call Girl in Jaipur Rajasthan
Jaipur Call Girls 9257276172 Call Girl in Jaipur RajasthanJaipur Call Girls 9257276172 Call Girl in Jaipur Rajasthan
Jaipur Call Girls 9257276172 Call Girl in Jaipur Rajasthan
 
Nanded Call Girls 👙 6297143586 👙 Genuine WhatsApp Number for Real Meet
Nanded Call Girls 👙 6297143586 👙 Genuine WhatsApp Number for Real MeetNanded Call Girls 👙 6297143586 👙 Genuine WhatsApp Number for Real Meet
Nanded Call Girls 👙 6297143586 👙 Genuine WhatsApp Number for Real Meet
 
Hubli Call Girls 👙 6297143586 👙 Genuine WhatsApp Number for Real Meet
Hubli Call Girls 👙 6297143586 👙 Genuine WhatsApp Number for Real MeetHubli Call Girls 👙 6297143586 👙 Genuine WhatsApp Number for Real Meet
Hubli Call Girls 👙 6297143586 👙 Genuine WhatsApp Number for Real Meet
 
Patna Call Girls 👙 6297143586 👙 Genuine WhatsApp Number for Real Meet
Patna Call Girls 👙 6297143586 👙 Genuine WhatsApp Number for Real MeetPatna Call Girls 👙 6297143586 👙 Genuine WhatsApp Number for Real Meet
Patna Call Girls 👙 6297143586 👙 Genuine WhatsApp Number for Real Meet
 
Call Girls Hyderabad Just Call 9907093804 Top Class Call Girl Service Available
Call Girls Hyderabad Just Call 9907093804 Top Class Call Girl Service AvailableCall Girls Hyderabad Just Call 9907093804 Top Class Call Girl Service Available
Call Girls Hyderabad Just Call 9907093804 Top Class Call Girl Service Available
 
ooty Call Girls 👙 6297143586 👙 Genuine WhatsApp Number for Real Meet
ooty Call Girls 👙 6297143586 👙 Genuine WhatsApp Number for Real Meetooty Call Girls 👙 6297143586 👙 Genuine WhatsApp Number for Real Meet
ooty Call Girls 👙 6297143586 👙 Genuine WhatsApp Number for Real Meet
 
dhanbad Call Girls 👙 6297143586 👙 Genuine WhatsApp Number for Real Meet
dhanbad Call Girls 👙 6297143586 👙 Genuine WhatsApp Number for Real Meetdhanbad Call Girls 👙 6297143586 👙 Genuine WhatsApp Number for Real Meet
dhanbad Call Girls 👙 6297143586 👙 Genuine WhatsApp Number for Real Meet
 
Call Girls Service In Goa 💋 9316020077💋 Goa Call Girls By Russian Call Girl...
Call Girls Service In Goa  💋 9316020077💋 Goa Call Girls  By Russian Call Girl...Call Girls Service In Goa  💋 9316020077💋 Goa Call Girls  By Russian Call Girl...
Call Girls Service In Goa 💋 9316020077💋 Goa Call Girls By Russian Call Girl...
 
Vip Call Girls Makarba 👙 6367187148 👙 Genuine WhatsApp Number for Real Meet
Vip Call Girls Makarba 👙 6367187148 👙 Genuine WhatsApp Number for Real MeetVip Call Girls Makarba 👙 6367187148 👙 Genuine WhatsApp Number for Real Meet
Vip Call Girls Makarba 👙 6367187148 👙 Genuine WhatsApp Number for Real Meet
 

foctors of non-communicable dideases

  • 1. Daffodil International University Page 1 CHAPTER ONE 1.1 Background of study Non-communicable diseases (NCDs) refer to non-infectious diseases or illnesses that are caused by something other than pathogens. The term is used to imply a variety of conditions including cancer, cardiovascular diseases, diabetes mellitus, chronic respiratory diseases, musculoskeletal disorders and other conditions. Globally, about 25 million or one half of all deaths are from NCDs, and this proportion keeps rising. Non-communicable diseases (NCDs) are responsible for a high proportion of deaths and disabilities. World Health Organization (WHO) estimated that, in 2000, NCDs and mental disorders caused 59% of deaths and 46% of the global burden of disease (WHO, 2002). Based on available trends, by 2020 NCDs are predicted to account for 73% of deaths and 60% of disease burden worldwide (Murray, 1996). According to the WHO African Regional Consultation Meeting Report on Global Strategy on Diet, Physical Activity and Health (Harare, 2003), “the risk for non communicable diseases is gaining importance in Africa with a prevalence of high blood pressure estimated at 30- 40 % although prevalence data from national surveys are generally inadequate.” The World Health Report 2001 indicates that NCDs, in 1998, accounted for almost 60% of all deaths and 43% of global burden of diseases. Seventy-five percent of total deaths resulting from NCDs occur in the developing countries. The treatment of NCDs is known to be expensive, labour-intensive and needs technological sophistication which most countries are lacking. Identification of major risk factors, their prevention and control form the basis of the prevention of NCDs. Risk factors of today eventually become the diseases and the public burden in the days after. Population measurements of these risk factors are used to describe the distribution of future disease rather than predicting the health of specific individuals. Knowledge of risk factors can then be applied to shift population distribution of these risk factors. Risk factors are measurable under field conditions and amenable to intervention. Identification of risk factors and their quantification is of great importance in order to calculate the avoidable burden of disease and framing of cost-effective strategies for prevention.
  • 2. Daffodil International University Page 2 1.2 Problem statement The problem of non-communicable diseases remains an area of public health focus globally. It is estimated that, globally, 25 million or one half of all deaths and most of the physical disabilities are attributable to NCDs, and this is still on the increase year after year. WHO estimated that in 2000, NCDs and mental disorders caused 59% of deaths and 46% of the global burden of disease (WHO, 2002). Recently, non-communicable diseases have gained popularity in the Sekyere West District due to its overwhelming burden in the district. According to the 2008 Annual Report of the District Health Directorate, ‘all the non-communicable diseases had increased compared to the previous years and is a source of worry for the municipality’. There is therefore the likelihood of future increase of non communicable disease burden in the district if no intervention is implemented. Among the top-10 causes of institutional death in the district, Cardio-Vascular Diseases (CVDs) mainly hypertension, diabetes and stroke ranked 1st in 2004 representing 11.3 % of total causes of deaths in that year and 2.9 % in 2005, ranking 7th. In 2006 and 2007, CVA still accounted for 8.94 % and 7.4 % of causes of death respectively. Similarly, with diabetes mellitus, an increasing trend of cases year after year was observed with 34 and 63 cases of diabetes recorded in 2003 and 2004 respectively. A continuum of increases occurred from 215 cases in 2005 to 258 cases in 2007 and 666 cases in 2008. The picture of non communicable diseases in the district from the previous years to date makes this study so critical for the documentation of the distribution of risk factors among the population. 1.3 Rationale of the study Non-communicable diseases remain an area of high public health concern as well as health services providers. Until recently, non-communicable diseases were not given much attention as the diseases were noted to be confined to the wealthy people. The growing middle class and ever changing lifestyle in developing countries have led to the rapid increase in the burden of NCD; the epidemiological trend has caught up with Somalia. With the current increase in trend of the diseases among all the different social categories of people, attention has begun to rise about major determinants of the diseases and risk factors for NCDs.
  • 3. Daffodil International University Page 3 In the Howlwadag District of the Banadir region, NCDs are among the leading causes of deaths. This and others necessitate this recent study into assessing the level of prevalence, risk and risk factors, and other determinants of the diseases such that tentative interventions can be put in place at a minimum cost before the situation gets out of control. In order to take effective prevention measures, identification of the risk factors is an essential prerequisite. Little is known about the prevalence of the risk factor coupled with little data available on the dietary habits, physical activity and other life-style associated factors in the District. It is with these concerns, that an assessment of risk factors is the focus of this study and has been given priority attention in the District. The WHO STEPs Approach on NCDs risk factor surveillance is considered an efficient tool to be used for assessing the risk factor situation in the District. In view of the burden of NCDs highlighted above, there is the need to have systematic data to determine the magnitude of the problem of NCDs so as to influence policy and resource allocation between prevention and care, this been one of the core relevance of the study. 1.4 Research questions The study investigated these general research questions:  Do you have an idea about the risk factors of non-communicable diseases?  What factors contribute to the risk of non-communicable diseases?  How is non-communicable disease distributed in the Howlwadag District in Somalia  Who is highly affected with NCDs and their risk factors?
  • 4. Daffodil International University Page 4 1.5 Objectives 1.5.1 Generalobjective: The main objective of the study was to assess the prevalence, levels of risk and the major risk factors for non-communicable diseases in the Howlwadag Destrict- Mogadishu Somalia 1.5.2 Specific objectives: Specifically, the study was intended to: 1. Assess the level of awareness/knowledge in the Howlwadag Destrict- Mogadishu Somalia on NCDs. 2. Identify the individual age groups that are mostly at risk of NCDs 3. Identify the determinants (physical, environmental, socio-economical, biological, behavioral and nutritional factors) of non-communicable disease in the Mogadishu. 4. Assess the trend and distribution of non-communicable diseases as well as their risk factors in the district. 5. Generate a baseline documentation to contribute to the existing literature for further research interventions 1.6 Research hypothesis The study investigated the following specific hypotheses:  Sedentary lifestyles such as smoking, drinking, physical inactivity among individuals are strong risk factors for developing NCDs.  Low consumption of fresh fruits and vegetables and their nutrient biomarkers are associated with increased risk of NCDs.  Poor dietary/nutritional behaviors contribute to increased risk of NCDs.
  • 5. Daffodil International University Page 5  Socio-economic factors are key determinants of non-communicable diseases such as hypertension and diabetes.  NCDs and their risk factors are equally associated with males and females  Advanced age is a risk factor for developing NCDs 1.7 Variables. 1.7.1 Dependent variable: The non-communicable diseases among people living with non communicable diseases: This will be obtained by asking patients the time, place and his/her occupation when he/she fell the disease, when diagnosed sing and symptoms. 1.7.2 Independent variables The prevalence of risk factors Independent variables include: Stigma, Religious, Traditional beliefs, Education level and Occupation 1.8 Scope of the study The study focuses basically on the assessment of the extent of prevalence, levels of risk and the major risk factors for non-communicable diseases among residents in the Howl-wadaag District in Mogadishu - Somalia.The study focuses basically on the assessment of the extent of prevalence, levels of risk and the major risk factors for non-communicable diseases among residents in the Howl-wadaag District in Mogadishu - Somalia. 1.9 Definition of terms Chronic non- communicable diseases (CNCDs):CNCDs are defined as diseases or conditions which affect individuals over an extended period of time and for which there are no known causative agents that could be transmitted from one affected individual to another (Daar et al, 2007). Risk factors: A risk factor refers to any attribute, characteristic or exposure of an individual which increases the likelihood of his or her developing a non-communicable disease (WHO, 2005a).
  • 6. Daffodil International University Page 6 Lifestyle:The way in which a person or a group lives (Hornby, 2000). Chronic diseases of lifestyle (CDLs):This is a group of diseases which affect people who share similar risk factors as a result of exposure, over many decades, to unhealthy diets, smoking, lack of exercise and possibly stress. The major risk factors include high blood pressure, tobacco addiction, high blood cholesterol and diabetes. These are also called non-communicable diseases or degenerative diseases (Fourie, 2001). Health promotion:This is defined as the process of enabling people to increase control over, and to improve, their health, to reach a state of complete physical, mental and social well-being (Coulson, Goldstein & Ntuli, 2002). Public health:This is the science and art of promoting, protecting and improving health and well-being through the organized efforts of society (McPherson, 2001). 1.10 Aim of the study The purpose of this study was to determine the prevalence of risk factors for noncommunicable diseases among men and women aged between 15 and 70 years living in Howkwadag Mogadishu Somalia. 1.11 Significance of the study Most developing countries of sub-saharan Africa, including Somalia, are faced with a double burden of infectious diseases and the emerging non-communicable disease pandemic. This is a concern for public health since it poses a great threat to already overstretched and poorly structured health care systems. Statistics show that non-communicable disease morbidity and mortality are rapidly increasing, especially among the poorest of the poor. WHO member countries resolved that surveillance of the major common risk factors would form a comprehensive baseline starting point for the legislation, planning and execution of health promotion interventions. Results in this study would complement the scarce knowledge on the existing interactions between socio-demographic characteristics, behavior and non-communicable diseases among residents of Mombasa. This information will facilitate the training and practice of health care workers, including medical doctors, physiotherapists, environmental health officers and nurses
  • 7. Daffodil International University Page 7 CHAPTER TWO: LITERATURE REVIEW 2.1 Introduction There are various definitions for a literature review as indicated by many researchers and institutions. A literature review is both a summary and explanation of the complete and current state of knowledge on a specific topic (University of Guelph 2013:1). The University of Wisconsin (2013:1) defined literature review as a critical analysis of a segment of a published body of knowledge through summary, classification, and comparison of prior research studies, review of literature and theoretical articles. Similarly, a literature review is an objective, thorough summary and critical analysis of the relevant available research and non-research literature on the topic being studied (Hart 1998:28). This chapter presents a review of the relevant literature on the global evolution and epidemiology of chronic non-communicable diseases. The current trends in behavioral health risk factors are observed within and between different populations. Studies focusing on the associations between health risk factors and populations’ socio-demographic characteristics are reviewed, as well as theories underlying risk factors patterns among populations. The chapter also looks at the health and socioeconomic impact of non-communicable diseases upon individuals, societies and governments. Finally, global and regional models of evidence based cost-effective preventive and control programs are presented. 2.2 Global Level of Awareness on Non-Communicable Diseases Non-communicable diseases (NCDs) and mental health are the leading causes of death worldwide, causing 60% of the global deaths and 46% of the global burden of disease (WHO 2001, Murray, et al., 1996). NCDs include Cardio-Vascular Diseases (CVDs) such as stroke, heart attacks, diabetes, chronic lung diseases, cancer, diseases of bones and joints and mental illness (Nigel, 2001a).The biggest single killer is coronary heart diseases, followed by other CVDs, cancer and chronic lung disease in that order. Diabetes is a major contributor to deaths from CVDs, but also causes its own unique complications. Common risk factors of these NCDs
  • 8. Daffodil International University Page 8 include smoking, physical inactivity, obesity, and diets high in saturated fats and sodium and low in fruit and vegetables intake (Nigel, 2001a). Many developing countries are affected by a double burden of disease; the combination of long established infectious diseases with a rapidly growing new epidemic of chronic NCDs (WHO 2000). Until recently, risk factors such as high blood pressure, cholesterol, tobacco use, excess alcohol consumption, obesity, and the diseases linked to them were associated with developed countries. Studies from some African countries suggest that in predominantly urban settings, the prevalence of diabetes and hypertension increased markedly over the last ten years to the year 2000 ( Nigel, 2001b). 2.3 Non-communicable diseases: The global situation According to WHO (2005a), non-communicable diseases, including heart diseases and stroke, cancer, chronic obstructive pulmonary diseases and type 2 diabetes, are the major causes of death and disability worldwide, including many young people and those in middle age. This drastic shift in the leading global cause of death, from infectious diseases and malnutrition to non- communicable diseases, poses a great public health concern. As noted in the global burden of disease survey by Murray and Lopez (1996), most of the non-communicable disease cases are detected in the low- and middle-income developing countries where the majority of the world’s population lives. The increasing impact of non-communicable diseases in these countries threatens to overwhelm already stretched health care systems. The Murray and Lopez analysis also revealed that the total global disease burden, including non-communicable diseases, is unequally distributed, with nearly 90% occurring in the developing countries, yet only 10% of the total global expenditure is allocated to those countries. This disparity presents a major public health inequity, one worthy of urgent address by the international health organizations if a desirable outcome is to be expected in the prevention and control of non-communicable diseases in the developing countries, which contribute substantially towards the global morbidity and mortality rates. Table 2.1 below shows the WHO estimates for non-communicable diseases in different world regions.
  • 9. Daffodil International University Page 9 Table 2.1: The common non-communicable diseases estimates (100,000) per WHO, World region NCDs Africa Europe America Cardiovascular diseases (heart diseases & stroke) 4214 6078 6006 Cancer 1064 1045 1307 Diabetes mellitus 113 264 421 Chronic respiratory conditions 1199 1088 980 2.3.1 Non-communicable diseases in developed countries Statistics by the World Health Organization (2008) indicate that deaths worldwide from non- communicable diseases exceed those from infectious diseases. It was also revealed that a relatively smaller proportion of approximately 20% of deaths from non-communicable diseases occur in the developed countries, where major advancements in primary health care and public health infrastructure have been achieved. However, as revealed lately in the United States of America by Gregg et al (2008), this status is currently being challenged by the declining rates in the eradication of non-communicable diseases as well as marked disparities in prevalence across racial and ethnic boundaries. With reference to the Omran model on the global epidemiologic transition, various populations face different health status transformations, depending on their underlying socioeconomic determinants. Developed countries are in this respect essentially classified in the age of delayed degenerative diseases characterized by fully advanced primary health care systems and technological advancements (Levenson et al, 2003). In a study to evaluate the cause-specific mortality rate in the United States, Europe and Australia by Unal, Critchley and Capewell (2005), it was revealed that cardiovascular diseases are the largest cause of death. In line with the findings of the global burden of disease study, the authors also reported a reduction in the mortality rate in Britain and most of the industrialized countries. This is
  • 10. Daffodil International University Page 10 likely due to the impact of an improved primary health care system and advanced medical technology, as seen for example in New Zealand where Capewell, Beaglehole, Seddon and McMurray (2000) reported a 50–75% reduction in cardiac deaths following a population-wide prevention program and modernized cardiological treatments. 2.3.2 Non-communicable diseases in middle-income economies The profile and impact of non-communicable diseases across different economies is well recognized. In Latin America and the Caribbean countries, which form part of the middle income group of countries, this emerging epidemic is no exception. A study by Perel, Casas, Ortiz and Miranda (2006) indicated a 73% prevalence of mortality from non-communicable diseases and a 76% prevalence of disability-adjusted life years (DALYs), with the major contribution being from cardiovascular diseases. This dominance is projected to rise significantly by 2020. In line with the Yusuf et al (2001) findings, this study identified urbanization, globalization and population aging as the major driving forces underlying the dynamics of a population’s health. Likewise, in Asia and the Pacific region, a report by Sen (1998) suggested that advances in socioeconomic development and changes in demographics had altered the profile of the major causes of mortality and morbidity, with indications that infectious and parasitic diseases were no longer the major causes of death in the region. These findings collectively underline the transitions in global disease profiles and health facing different populations under the adopted negative effects of urbanization. In an African cause-specific mortality rate study using data from demographic surveillance sites, Adjuik et al (2006) found that South Africa registered more deaths due to noncommunicable diseases when compared to most other African countries. According to the authors, this is attributable to the country’s socioeconomic and demographic status, supporting similar associations observed in related studies in the field of non-communicable disease epidemiology. 2.3.3 Non-communicable diseases in low-income countries The low-income developing countries are composed of most Asian and sub-saharan African countries. They host the majority of the world’s population and are characterized by poor health
  • 11. Daffodil International University Page 11 care systems and under-developed public health infrastructures (Mathers and Loncar, 2006). This status puts the developing countries in a challenging position in dealing with existing infectious diseases and emerging non-communicable diseases. A comparative international survey on the burden of non-communicable diseases by Boutayeb and Boutayeb (2005) highlighted a global concern with increasing trends in developing countries, where the transition imposes more constraints in dealing with the double burden of both infectious and non-communicable diseases. The Boutayeb and Boutayeb study also observed an accelerating trend in noncommunicable disease mortality rates, from 47% to 56% between 1990 and 2000, reaching a projected 69% in 2020. Though relatively lower than the 80% mortality toll reported by Ezzati et al (2002), the increasing trend poses a great public health challenge in those developing countries which are characterized by poor health care systems. In the oft-cited burden of disease study by Murray and Lopez (1996), it was revealed that more people died of non-communicable diseases in the developing countries compared to the developed countries. Kenya, as one of the low-income countries of the sub-saharan African region, is no exception to this emerging public health threat. 2.4 Age Specific Prevalence Rate of Non-Communicable Disease While malnutrition and infection persist as the major nutritional problems affecting mostly children, chronic diseases are the main cause of premature deaths in adults even in the poorest countries. Immunizations and antibiotics are having a major impact on infectious diseases, but progress is much slower in combating non-communicable chronic diseases (NCDs).In Britain, death before middle age has been largely avoided, but death in middle age is still common, though it is largely avoidable. 80% of such deaths involve vascular or neoplastic diseases, for many of which better treatment and more effective preventive measures can be foreseen. In 1980 there were about 50 million deaths in the world, half in people under 35 years of age. Indeed, 15 million were under five. In early childhood, about four million deaths a year were due to diarrhea, about four million to acute respiratory infections, and about four million to diseases that can largely be prevented by vaccination. (Anon, 2008)
  • 12. Daffodil International University Page 12 A study involving 4,733 subjects indicated that Diabetes, IGT and combined IFG and IGT increase with age, as the oldest age group (64+ years) has the highest diabetes prevalence (13.6%). The age-adjusted prevalence of diabetes, IFG and IGT, were 6.4, 6.0 and 10.7%, respectively. Diabetes is also known to be common among males than females (7.7% vs. 5.5%) with a probability of [P<0.05] in the same study. Worsening glycaemic status is associated with increase in age, body mass index, systolic and diastolic blood pressures. (Amoah, 2003) 2.5 Risk Factors ofNon-Communicable Diseases 2.5.1 High Blood Pressure Blood pressure is considerably lower in children than in adults and increases steadily throughout the first two decades of life. In adults, cross-sectional and longitudinal surveys have shown that systolic and diastolic blood pressure increase progressively with age. For example, in the WHO MONICA survey, systolic blood pressure increased by about 0.29 to 0.91 mm Hg per year in men and 0.6–1.31 per year in women (Wolf et all., 1997). This increase remains stable and possibly declines after age 50 for diastolic but not for systolic blood pressure, leading to a steep increase in pulse pressure; a key risk factor for cardiovascular outcome (Franklin et all., 1999). These trends have been demonstrated in both genders and most ethnic groups (Hajjar et al., 2003). 2.5.2 Anthropometric Indexes Body mass index (BMI) is an important correlate of blood pressure and hypertension prevalence. By the current World Health Organization (WHO,2000) criteria, a BMI <18.5kg/m2 is considered underweight, 18.5–24.9 kg/m2 ideal weight and 25–29.9kg/m2 overweight or pre- obese. The obese category is sub-divided into obese class I (30–34.9kg/m2), obese class II (35– 39.9kg/m2) and obese class III (≥40kg/m2). A BMI greater than 28kg/m2 in adults is associated with a three to four-fold greater risk of morbidity due to T2DM and CVDs than in the general population (Van Itallie, 1985).
  • 13. Daffodil International University Page 13 The recent increase in overweight and obesity in the United States (Flegal et al., 2002) both in adults and children may explain, in part, the associated increase in hypertension prevalence over the past decade. In the NHANES-III data, obese men and women had a hypertension prevalence ranging from 49% to 64% with increasing degrees of obesity in men and from 39% to 63% with increasing obesity in women versus 27% in normal-weight men and 23% in normal-weight women (Must et al., 1999). According to Paffenbarger et al., 1983, weight gain is also associated with an increase in hypertension incidence and the age-related rise in systolic blood pressure. In an analysis of four Chicago epidemiological studies, weight gain was associated with an increase in pulse pressure. In the Framingham Heart Study, a 5% weight gain was associated with a 20% to 30% increase in hypertension incidence (Vasan et al., 2001). A study by Winkvist et al., 1997 in Indonesia indicated 11.6% and 14.3% in their studies in the years 1996 and 1997 respectively as being a rate of overweight or obese among their study subjects Obesity which is defined as a condition of abnormal or excessive fat accumulation in adipose tissue, to the extent that health is impaired (Garrow, 1988) in absolute terms, and its distribution in the body - either around the waist and trunk (abdominal, central or android obesity) or peripherally around the body (gynoid obesity) - has important health implications. A central distribution of body fat is associated with a higher risk of morbidity and mortality than a more peripheral distribution (Kissebah et al., 1994). 2.5.3 Nutritional/Dietary Behavior Measures Results of observational studies and clinical trials document an association between sodium chloride (NaCl) intake and blood pressure (Kotchen et al., 1994). The effect of NaCl on blood pressure increases with age, with the height of the blood pressure, and in persons with a family history of hypertension. Among population groups, age-related increments of blood pressure and the prevalence of hypertension are related to NaCl intake (Elliott et al., 1996). Excess blood glucose levels predispose in a way to the development of diabetes, which is basically influence by lifestyle. A study by Baridalyne et al., 2003 into Profile of Biochemical
  • 14. Daffodil International University Page 14 Risk Factors for non communicable diseases in Urban, Rural and Peri-urban Haryana, India documented 11.4% of men in urban areas having fasting blood glucose above the cut off. 2.5.4 Sedentary lifestyle Sedentary life style and low educational attainment have each been linked to the rise in blood pressure with age, low socio-economic status, low occupational class, psycho-social factors such as hostility and time urgency/impatience, job strain, depression (Davidson et al., 2000). 2.5.5 Tobacco Smoking Smoking, which is believed to be the number one major single known cause of non-communicable diseases (Toustad et al., 2006), is widespread around the world. Estimate of the World Health Organization (WHO) indicates that roughly about 30% of the global adult male populations are smokers. It is estimated that tobacco-related deaths exceed 4 million annually. It has been estimated that by 2030, diarrhoeal diseases and lower respiratory infections will have been surpassed by chronic obstructive airways diseases as causes of mortality (Murray and Lopez 1990; Lopez et al, 2006).While the prevalence of tobacco use in many industrialized nations is reducing, there is a growing epidemic of smoking in the developing world. In many African countries, there is paucity of data on the epidemiology of tobacco and smoking. Based on the available data however, in African countries, it appears smoking among adults is more common among males and the poor (Pampel, 2002). In sub-Sahara Africa, data on national smoking prevalence ranges from 20% to 60% among men. Rate of smoking among certain sub-Saharan African youth has been documented. A prevalence rate of 1.4% in Zimbabwe, 1.5% in Nigeria, 34.4% in Cape Town, South Africa which exhibit a steadily increase and that must need an attended (Townsend et al, 2006). In Kenya, a study into a Global Youth Tobacco Survey document a rate of 7.2% cigarette smoking among school-going children and 8.5% of other tobacco related products (Global Youth Tobacco Survey, 2001).
  • 15. Daffodil International University Page 15 Various categories of smoking exist which must be considered in estimating an extent of smoking related infections. A study into Prevalence and determinants of adolescent tobacco smoking in Addis Ababa, Ethiopia indicate an overall prevalence of 2.9% of which 4.5% males and 1% females were current smokers. The same study also reports an estimated 15.1% males and 5.7% females ex- smoking status among the population (Emmanuel et al; 2007). 2.5.6 Physical Inactivity Physical inactivity is known to be a major public health problem of concern in 2000 as physical activity levels of people of all ages tended to decrease (CDC 2001). The Centres for Disease and Control (CDC 2001) reported that, among the youth in America aged 12 and 13 years, 69% were regularly active. However, the number dropped to 38% for young people between the ages of 18- 21 years. A physically inactive child is more likely to become a physically inactive adult, which could lead to chronic diseases of lifestyle (Frantz et al., 2003). Among the United Kingdom, London Health Observatory reported that both adults and children in Britain are less active and less fit than previously. The Allied Dunbar National Fitness Survey (1992) identified UK adult population groups who were sedentary as women aged 16-24 years, middle-aged men and people aged 50 years and over. In the Health Survey in England 1997, 22% boys and 30% girls were reported as being physically inactive between age 10 and 15. In the 16-24 year age group, 39% of the males were reported as inactive and 62% of the females were reported as inactive. In some Sub-Saharan countries, prevalence of physical inactivity has been recorded. A study in South Africa report from Birth to Twenty (BTT) 2002, indicates that more than 40% of young people do not participate in regular physical activity. The BTT study found that physical activity was less common among girls than boys and among those with lower income and less education. 2.5.7 Environmental Factors Urbanization is an important factor in the aetiology of obesity, and a major risk factor for NCDs. It accelerates the changes in diet, physical inactivity and increases access to tobacco products
  • 16. Daffodil International University Page 16 and high fat foods which are all risk factors of NCDs (Vorster 2000). Diet and physical inactivity are modifiable risk factors associated with changes in lifestyle. Diets of the African population tend to differ between rural and urban dwellers. Studies have shown that rural dwellers diets are low in fat and sugar but high in carbohydrates and fibre (Steyn et al., 2001), while their urban counterparts show high fat and low fibre and carbohydrate intake (Bourne et al., 2002) which is typical of a Western diet. Popkin (1999) suggests that the shift from an agricultural economy to industrialization is one of the major economic changes that are associated with nutrition transition. 2.6 Epidemiological Trend of Non-Communicable Diseases In United States, Estimates of hypertension (generally defined as systolic blood pressure ≥140 mm Hg and/or diastolic blood pressure ≥90 mm Hg, or taking antihypertensive medications) prevalence in the United States varies somehow. A study conducted with a total population of 15,739, aged between 45–64 years, revealed a prevalence rate of 35% (Nieto et al., 1995) in the years 1987–1989. A similar study by the Woman's Health Initiative in U.S in the years between 1993 and 1997 of a total population of 90,755 women aged 50–79 years also revealed a prevalence rate of hypertension of 37.8% (Wassertheil et al., 2000). In the Behavioural Risk Factor Surveillance System (BRFSS) in U.S, self-reported hypertension prevalence increased from 21.2% in 1991 to 25.7% in 2001 (Ahluwalia et. al., 2001). In developing countries, the trend is for a rapid increase in hypertension prevalence, and in developed countries, the previous trend of a decrease in hypertension prevalence is actually reversing (Cent., 2005; Gupta, 2004; Hajjar et al., 2003). Generally, the worldwide burden of hypertension in 2000 was estimated to be 972 million persons or 26.4% of the adult world population, with 333 million in developed and 639 million in developing countries (Kearney et al., 2005). It has been estimated that by 2025 1.56 billion individuals will have hypertension, an increase of 60% from 2000 (Kearney et al., 2005).
  • 17. Daffodil International University Page 17 Between the 1920s and the 1960s, data gathered from Korle-Bu hospital showed a steady increase of stroke and cardiovascular diseases (Pobee, 2006). Hospital-based and community- based studies conducted since the 1950s provide important information on prevalence and morbidity trends for hypertension, diabetes and other chronic non communicable disease such as cancers and sickle cell disease. In the 1970s, the World Health Organisation (WHO) sponsored research in Mamprobi on Cardiovascular Disease (CVD) recorded hypertension prevalence of 13% in the community (Pobee, 2006). A non-communicable disease survey conducted in 1998 recorded a national prevalence of 27.8% for hypertension (Bosu, 2007). Studies conducted after the national survey show higher prevalence rates across different groups in different regions: 28.7% in Kumasi in the Ashanti Region; 32% prevalence in Bawku/Zebilla in the Upper East Region; 36.9% in Keta- Dzelukope in the Volta Region; and 47.8% among a cohort of women in Accra (Pobee, 2006; Cappuccio et al., 2004; Hill et al., 2005). Reported facility cases of hypertension increased by 67 per cent, from 58,677 in 1989 to 97,980 in 1998 (Amoah et al.,2002). In 2005, national out- patient hypertension cases totalled 250,000 (Bosu, 2007). During the same period (1950s to present) major causes of death have shifted from solely communicable diseases to a combination of communicable and chronic non-communicable diseases. 2.7 Determinants of non-communicable diseases:The role of health risk factors A “risk factor” refers to any attribute, characteristic or exposure of an individual which increases the likelihood of developing non- communicable disease. In the public health context, risk factor measurement is used to describe the distribution pattern of future diseases in a population. (WHO, 2001). According to the findings of an American national health survey by Mokdad, Marks, Stroup and Gerberding (2004), a large body of epidemiologic studies has clearly demonstrated that behavioral factors such as cigarette smoking, risky drinking of alcoholic beverages, physical inactivity and unhealthy dietary practices contribute significantly to preventable chronic noncommunicable disease morbidity and mortality. In line with observations made by WHO
  • 18. Daffodil International University Page 18 (2005a), the authors also found extensive evidence for a multi-factorial interaction between a population’s underlying socioeconomic determinants and the risk factors. These analyses, together with many other studies conducted in this discipline, attempt to present noncommunicable diseases as a consequence of the negative effects of modern lifestyles, especially among developing populations. Figure 2.2 below illustrates the multi-factorial determinants underlying the development of chronic non-communicable diseases. Figure 2.1 Causes of chronic non-communicable diseases (WHO, 2005a). 2.8 The impact of chronic non-communicable diseasesandtheir risk factors 2.8.1 Health impact. The lives of far too many people are being blighted or cut short by chronic diseases such as heart disease, stroke, cancer, chronic respiratory diseases and diabetes. This is no longer only happening in the high income countries. This is a very serious situation to individuals, societies, public health and economies affected. (Jong-Wook,2005). In 2000, the 53rd World Health Assembly reported that public health advocacy, especially in the developing countries, had been traditionally devoted to infectious diseases. In contrast, it became clear that the impact and profile of non-communicable diseases had generally been insufficiently appreciated. Main chronic non- communicable diseases Heart diseases, stroke, cancer, chronic respiratory diseases, type 2 diabetes. Intermediate risk factors Raised blood pressure, raised blood glucose, abnormal blood lipids, overweight/obesity. Common modifiable risk factors Unhealthy diet, physical inactivity, smoking, risky alcohol consumption. Underlying socioeconomic determinants Urbanization, globalization, population ageing.
  • 19. Daffodil International University Page 19 2.8.2 Socioeconomic impact Chronic diseases and poverty are interconnected in a vicious cycle. The poorest quintile in almost all countries is more vulnerable to chronic diseases for several reasons, including greater exposure to health-risk living conditions and decreased access to good-quality health care services (Sachs, 2005). Chronic diseases represent a major cost and a profound economic burden to individuals, families, health systems and societies. According to Marmot (2004), chronic diseases may cause poverty or worsen already existing poverty by ruining a family’s economic prospects through direct catastrophic expenditure on health care services and prolonged loss of income. This argument is supported by the findings of a case study in Jamaica by Henry-Lee and Yearwood (1999) who found that approximately 59% of people with chronic diseases reported financial difficulties caused by their illness. 2.9 Models of best practice in the controland prevention of non communicable diseases In 2000, the 53rd World Health Assembly passed a resolution on the prevention and control of non-communicable diseases among member states in their efforts to reduce the toll of morbidity, mortality and premature mortality related to non-communicable diseases (WHO, 2005a). The main objective of this global strategy was to map the emerging epidemic and analyze its social, economic and behavioural determinants in order to provide guidance for policy making and public health action. It was proposed in the assembly that comprehensive and integrated surveillance of non-communicable disease risk factors would be part of the wider health information system recommended by the World Health Organization as an essential national public health function. The means of preventing and controlling most non-communicable diseases through comprehensive and integrated action are already established, and have proved applicable and cost-effective even in resource-constrained settings (Jong-Wook, 2005).
  • 20. Daffodil International University Page 20 Chapter Three Methodology 3.1 Introduction This chapter describes the study setting and the rationale for its selection, the research design employed, and the sampling techniques utilized. Tools of data collection and methods of data analysis are outlined, as well as a description of the pilot study. The protocol observed to ensure ethical considerations is also stated. 3.2 Study type and design A cross-sectional study design was adapted to assess the prevalence, levels of risk and the major risk factors for developing non communicable disease (Hypertension and Diabetes) among a representative sample in the Howl-wadaag district in Mogadishu - Somalia with the use of structured questionnaire on formal interview basis as well as direct physical measurements and biochemical analysis. 3.3 Study Area This study was undertaken Howl-wadag District, one of the largest districts in Benadir region Somalia. 3.4 Study Period: The time scope that the study will cover is from May to December 2015 3.5 Study population: The study population comprised of individuals with or without indications of risk for NCDs within the District. The target population for the study was selected among individuals of not less than 18 years of age in both sexes as at the time of the study and who had been resident in the district for a period of more than three months. It was assumed that people aged 20 or above stood a chance of risk of contacting NCDs if not genetically acquired. Exclusion criteria included physical disability,
  • 21. Daffodil International University Page 21 mental disability and the presence of communication barriers, those who agreed to participate only in Step 1 and those who refused to participate in the study. 3.6 Sample Size The sample size of this study was 80. The sample size was selected from the target population 100 pateints by using Slovene's formula Slovene’s formula: n = 𝑵 𝟏+𝑵∗𝒆 N= sample n= sample size e=0.05 (constant) n= 100 1+100 ∗0.052 = 80. 3.7 Sampling Technique Study participants will be selected from the district hospital, one health centre and two dispensaries. These health facilities were purposely selected because they had large number of Non-communicable diseases patients. 3.8 Data collection procedures A questionnaire was used to collect the data. The questionnaire was written in English, and translated into Somali language since most of Somali elderly they don’t know English language. The questioner was distributed by local representatives from howl-wadag districts hospital in Banadir region Somalia. The researcher explained the purpose of the study to the participants and get reliable data. The choice of the instrument is because a questionnaire as a research instrument is a quick method to collect data. However, the technique is less time consuming and adequately covered the entire sample within the proposed time framework. 3.9 Data analysis After the collection of data, the researcher verified and checked the data and then entered in to the computer. Data was analyzed by the researcher by using a software package used for
  • 22. Daffodil International University Page 22 statistical analysis i.e. Statistical Package for Social Sciences (SPSS) version 6.1 according to key variables. 3.10 Ethical implication The study was conducted after getting permission and an introductory letter from the Faculty of Allied Health Science, Department of Public Health Daffodil International University. Introductory letter was also obtained from leadership or mayor of Banadir region. In addition Inform Consent of the respondents were obtained from the study participants to confirm their willingness to participate in the study after explaining to them the objectives of the study. The respondents were notified of their right to refuse or terminate at any point of the interview. The information provided by each respondent was kept confidential. No names of any respondent were discovered to anybody. Responses was coded and reported in a generalized manner, without mentioning who said what. Works of other people used in this study were correctly be referenced and authors were duly recognized.
  • 23. Daffodil International University Page 23 CHAPTER FOUR RESULTS OF THE STUDY This chapter presents results of analysis based on data collected on The prevalence of risk factors for non-communicable diseases among people living in Howlwadag Destrict - Mogadishu Somalia. The local representatives of the researcher distributed samples of 80 records. All the 80 questionnaires were returned and were found to be useful for data analysis hence100 response rate. The following table summarizes the characteristics of the respondents. Table 4.1 Distribution of Study Participants by Socio Demographics Variable Frequency Percentage Age 20-40 40-60 60-80 80 and above Total MEAN±54 SD±2.31 15 25 27 13 80 8.75 31.25 33.75 16.25 100 Sex Male Female Total 30 50 80 37.5 62.5 100 Marital Status Single Married Widow Divorced Total 10 25 24 11 80 12.5 31.25 30 13.75 100
  • 24. Daffodil International University Page 24 Education Never Primary Secondary Diploma Bachelor degree and above Total 19 16 25 15 5 80 23.75 20 31.25 18.75 6.25 100 Occupation House wife Civil society Self employee Health workers Total 30 20 20 5 80 37.5 25 25 6.25 100 House hold size One Two Three Four Greater than four Total 2 5 15 28 30 80 2.5 6.25 18.75 35 37.5 100
  • 25. Daffodil International University Page 25 Monthly family income in sh. Som Less or equal 3000000 3500000-5000000 5500000-6000000 6000000 and above Total 20 31 19 10 80 25 38.75 23.75 12.5 100 Age- majority of the respondent’s age were 27 (60-80) comprising (27 N=80),25(31.25) their age was 40-60,15(8.75) were age 20-40 and also 80 years and above while 13 (16.25) Religion all respondents are muslim N=80 (100) Table shows the characteristics of study participants stratified by their GENDER. Of 80 NCD patients, 30 (37.5) were males and 50 (62.5) were females. This table shows that most of the participants were married while few numbers were windowed and divorced. 10 Were single (12.5), 35 were Married (43.75),24 were widow (30) and 11 were divorced (13.75). The majority respondents are secondary school education, 25(31.25) while of the respondent, reported to have attained are never go to school education 19(23.75).16(20 ) were primary. 15(18.75)had Diploma. While 5(6.25) was Bachelor degree and above education. Majority of the respondents were house wife of number 30 (37.5),while Civil society and Self employee ware same respondents 20(25) and Health workers and students were also same number 5 (6.25). The above tabel indicates the distribution of the respondents by their income. The respondents in this study were asked their monthly family income. It was observed that the income of the participants was different according to their occupational status. Most of the respondents 31 (38.75)their income was (3500000-5000000sh.so)Some of the families their income was between (lessorequal3000000) with proportion of 20(25)Some of the families their income (5500000- 6000000sh.so) with proportion 19(23.75) according to rich people with above than 6000000sh.so 10(12.5).
  • 26. Daffodil International University Page 26 Table 4.2: Smoking Status of Respondents. Variables Frequency Percentage Smoking status Never smoke Current smokers Ex-smoker Total 35 24 21 80 43.75 30 26.25 100 At what age did you started smoking? 20 years 40 years 50 years and above None smoke Total 20 11 14 35 80 25 13.75 17.5 43.75 100 Do you smoke any of the tobacco products? Yes No Total 20 60 80 25 75 100 How many times in a day do you smoke? One a day Two times a day Three times a day None smoke Total 5 10 5 60 80 6.25 12.5 6.25 75 100
  • 27. Daffodil International University Page 27 What is your general attitude towards smoking? With to stop Hate to smoke Like to smoke Total 70 4 6 80 87.5 5 7.5 100 Do you belief that smoking is harmful? Yes No Total 74 6 80 92.5 7.5 100 The most of patients were Never smokers 35(43.75), second level were Current smokers 24 (30) while 21 (26.25) of them were Ex-smokers Most of patients were none smoke people which are 35(43.75) while 20 (25) started at age of 20 years. 11(13.75) were stared at age of 40 years and 14 (17.5) Were started ages of 50 years and above. The general attitude of most patients was Wish to stop smoke 70 (87.5), while 6 (7.5) were like to smoke and 4 (5) were hate to smoke. Most patients belief that Smoking is harmful 74 (92.5) while 6 (7.5) belief that smoke in not harmful. The majority of patients are never drink alcohol 75(93.75), 1(1.25) are current drink alcohol and 4 (5) are Ex-drink alcohol. Table 4.3 Dietary Behavior of Respondents variables Frequency percentage In a typical week, how many days do you eat fruit? One day Two days 40 50
  • 28. Daffodil International University Page 28 Three days Four days Total 12 17 11 80 15 21.25 13.75 100 In a typical week, on how many days do you eat Vegetables? One day Two days Three days Four days Total 34 16 21 9 80 40.25 20 26.25 11.25 100 What type of oils or fat is most often used for meal preparation in your household? Vegetable oil Lard Butter Margarine Peanut butter Total 46 12 14 8 80 57 15 17.5 10 100 Which of the following best describes your salt intake ability? Low Moderate High Total 21 20 39 80 26.25 25 48.75 100 On average, how many spoonful of salt is taken per meal/day One Two Three Four 18 46 14 2 22.5 57.5 17.5 2.5
  • 29. Daffodil International University Page 29 Total 80 100 On the average, how many kilos of sugar is consumed per week? One kg Two kg Three kg Four kg Total 24 6 38 12 80 30 7.5 47.5 15 100 The most patients were eat fruits only one day in week 40(50) and 17(21.25) use three days in week,12(15) while 11 (13.75). The most patients were eat Vegetables one day in week 34 (40.25),26(26.25) were eat Vegetables three days in week,16(20) were eat Vegetables two days in week and 9(11.25) were Vegetables four days in week. The majority patients 46 (57.5) are uses Vegetable oil in their meal preparation, 14 (17.5) are use Margarine in their meal preparation, 12(15) were use Butter in their meal preparation. The Salt in take Ability of most patients are high 39(48.75),moderate of Salt in take Ability 21(26.25),low of Salt in take Ability 20 (25) Most of patients 46(57.5) were taken two Spoons meal per day, 18(22.5) were taken one Spoons meal per day,14(17.5) were taken three Spoons meal per day. Most of patients consumed Three kg per week 38(47.5), some of them consumed One kg 24 (30) and 6(7.5) consumed two kilo per week.
  • 30. Daffodil International University Page 30 Table 4.4 Physical Activity Of Respondents Variables Frequency percentage Does your work involve mostly sitting or standing, with walking for not more than 30 minutes at a time? Yes No Total 34 46 80 42.5 47.5 100 Does your work involve vigorous-intensity activity that causes large increase in breathing or heart rate for at least 10 minutes continuously? Yes No Total 39 41 80 48.75 51.25 100 In a typical week, on how many days do you do moderate intensity activities as part of your work? One day Two days Three days Four days Five days Total 10 10 11 4 42 80 12.5 12.5 13.75 8.75 50.25 100 How long is your typical working day? Whole day 8 hours 6 hours 3 hours Total 44 16 14 6 80 55 20 17.7 7.5 100 Do you walk or use a bicycle (pedal cycle) for at least 10 minutes continuously to get to and from places? Yes
  • 31. Daffodil International University Page 31 No Total 36 44 80 45 55 100 The most of patients were no Standing and Walking For not more than 30 minutes 46(57.5) while 34(42.5) Standing and Walking For more than 30 minute. The most o patients not Increase in breathing or heart rate for at least 10mnute continuously 41(51.25) and Increase in breathing or heart rate for at least 10mnute continuously 39 (48.75). The majority of patients were woken five days 42(50.25),11(13.75) were woken three days and 10(12.5) were two groups which were woken one day and two days while 7(8.75) were worked four days. Majority of patients 44(55)were working whole of the day,16(20) were working 8hrs,14 (177) were working 6hrs and the 6(7.5) were working 3hrs. Most of patients not Walking or Uses of bicycle For at least 10minutes 60(75) while 20 (25) Walking or Uses of bicycle For at least 10minutes. Most of patients were not Eat or drink other than water during past 12hours 44 (55) while 36 (45) Eat or drink other than water during past 12hours according time of hospital arrives. 4.5 Body Mass Index (BMI) Category BMI-Kg/m2 Frequency Percentage Starvation less than 14.9 5 6.2 Underweight from 15 to 18.4 20 25.0 Normal from 18.5 to 22.9 29 36.2 Overweight from 23 to 27.5 14 17.5 Obese from 27.6 to 40 10 12.5 Morbidly Obese greater than 40 2 2.5 Total 80 100
  • 32. Daffodil International University Page 32 This is a measure of nutritional status whereby the body weight in Kilogram is divided to the square meters for height. It is expressed mathematically as: BMI = Body weight (Kg) Height (m2) Table 4.6 Biochemical Measurements Of Respondents Variables Frequency Percentage During the past 12 hours have you had anything to eat or drink, other than water? Yes No Total 36 44 80 45 55 100 Fasting blood glucose Choose accordingly: mmol/l or mg/dl Low High Total 34 46 80 42.5 57.5 100 Total cholesterol Choose accordingly: mmol/l or mg/dl Low High Total 32 48 80 40 60 100
  • 33. Daffodil International University Page 33 HDL Cholesterol Choose accordingly: mmol/l or mg/dl Low High Unable Total 30 40 10 80 37.5 50 12.5 100 Majority of patients 46(57.5) their Fasting blood glucose :Choose accordingly: mmol/l or mg/dl were high while 34(42.5) their Fasting blood glucose :Choose accordingly: mmol/l or mg/dl were low. Majority of patients 46(57.75) their Total cholesterol Choose accordingly: mmol/l or mg/dl were low and 30(37.5) their Total cholesterol Choose accordingly: mmol/l or mg/dl were high. while 4(5) Total cholesterol Choose accordingly: mmol/l or mg/dl were unable. Most of patients 48(60) their Triglycerides Choose accordingly: mmol/l or mg/dl were high and 32(40) their Triglycerides Choose accordingly: mmol/l or mg/dl were low. In most of patients level of HDL Cholesterol Choose accordingly: mmol/l or mg/dl were high 40(50) and 30 (37.5) HDL Cholesterol Choose accordingly: mmol/l or mg/dl were low while 10(12.5) their Cholesterol Choose accordingly: mmol/l or mg/dl were unable. Table 4.7 summaries of Biochemical Measurements Of Respondents Biochemical tests Frequency Percentage Fasting blood glucose Choose accordingly: mmol/l or mg/dl Low High 34 46 14.16 19.16 Total cholesterol Choose
  • 34. Daffodil International University Page 34 accordingly: mmol/l or mg/dl Low High 32 48 13.33 20.00 HDL Cholesterol Choose accordingly: mmol/l or mg/dl Low High Unable Total 30 40 10 240 12.50 16.66 4.16 100 The above table summaries all tests of biochemical tests in the study Total cholesterol when it is high 48(20%) and it is low 32(13.33%).Fasting blood glucose when it is high 46(19.16%) and it is low 34(14.16%). HDL Cholesterol when it is high 40(16.66%), low HDL Cholesterol is 30 (12.50) and when it is Unable 10(4.16). Table 4.8 Association association between General Attitude To Ward Smoking and Level of education Level of education General Attitude To Ward Smoking Total χ2 =85.2 Wish to stop Like to smoke Like to smoke Never 10 4 5 19 p-value =0.001 primary 11 2 3 16 secondary 12 6 7 25 diploma 10 4 1 15 Bachelor degree and above 2 1 2 5
  • 35. Daffodil International University Page 35 Total 49 16 15 80 In this study there was association between General Attitude To Ward Smoking and Level of education of participant, there was significantly association, as showed by the above table. 85.2 while P-value is 0.001. If P-value is less than or equal 0.005 it means statistical significantly. Therefore relationship between General Attitude To Ward Smoking and Level of education in this study is strong significant. Table 4.9 Association between Gender and Belief that Smoking is harmful Gender Belief that Smoking is harmful Total χ2 =1.49 Yes No male 30 0 30 p-value =0.005Female 44 6 50 Total 74 6 80 In this study there was association between Gender and Belief that Smoking is harmful of participant, there was significantly association, as showed by the above table. 1.49 while P-value is 0.004. If P-value is less than or equal 0.005 it means statistical significantly. Therefore relationship between Gender and Belief that Smoking is harmful in this study is significant.
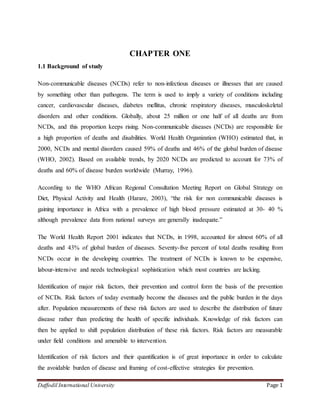
  • 36. Daffodil International University Page 36 Figure 4.1 Age distribution of participants The above figure 4.1 indicate that the majority number of age in distribution is (60-80) In percentage of 33.75 and frequency of 27 which total is 80. Also this figure indicates that lowest number of age in distribution is (≤20-40) in percentage of 8.75 and frequency of 15 which total is 80. Figure 4.2 marital status distributions of participants 15 25 27 13 8.75 31.25 33.75 16.25 ≤20-40 40-60 60-80 80 and above Frequency Percentage
  • 37. Daffodil International University Page 37 The above figure 4.2 indicate that the majority number of marital status in distribution is (married) In percentage of 36 off 100%. Also this figure indicates that lowest number of marital staatus in distribution is (single) in In percentage of 14 off 100%. 14% 36% 34% 16% Single Married Widow Divorced
  • 38. Daffodil International University Page 38 Figure 4.3 Body mass index (BMI) Figure 4.4 Biochemical test when is high. The above figure indicates that is Total cholesterol is highest48(60) all the tests in the study when tests are high and HDL cholesterol is lowest 40(50) less than 14.9 from 15 to 18.4 from 18.5 to 22.9 from 23 to 27.5 from 27.6 to 40 greater than 40 Starvation Underweight Normal Overweight Obese Morbidly Obese 5 20 29 14 10 2 6.2 25 36.2 17.5 12.5 2.5 BMI Frequency Percentage 46 48 40 57.5 60 50 Fasting blood glucose Total cholesterol Choose HDL Cholesterol Frequency Percentage
  • 39. Daffodil International University Page 39 Figure: 4.5 Biochemical test when is Low: The above figure indicates that is fasting blood glucose is highest 34(14.16) all the test when test are Low and HDL is lowest when tests are Low. Fasting blood glucose Total cholesterol HDL Cholesterol 34 32 30 14.16 13.33 12.5 Frequency Percentage
  • 40. Daffodil International University Page 40 CHAPTER FIVE DISCUSSION 5.1DISCUSSION This study enrolled Non-communicable Diseases (Ncds) UN equal number of males to females within the age classes between 20 to 80 years and above. Age- majority of the respondent’s age were 27 (60-80) comprising (27 N=80),25(31.25) their age was 40-60,15(8.75) were age 20-40 and also 80 years and above while 13 (16.25) Religion all respondents are muslim N=80 (100). The study revealed that most of the respondents (31.25%) were married while the remaining were considered widow (30%), divorce (13.75%) and single (12.5%). The high proportion of married people among the respondents could have a significant impact on non communicable diseases occurrence especially high blood pressure since some marital issues such as social, financial and nutritional obligations on the part of married couples has an associated effect on blood pressure. This assertion supports the research hypothesis stated that socioeconomic factors are key determinants of non-communicable diseases. Education also plays a very significant role in the development, management and control of non communicable diseases. Existing literatures support the fact that in an environment where illiteracy is high, NCD is said to be high as compared to high literacy environment. The majority respondents are secondary school education, 25(31.25) while of the respondent, reported to have attained are never go to school education 19(23.75).16(20 ) were primary. 15(18.75)had Diploma. While 5(6.25) was Bachelor degree and above education. According the occupation the Majority of the respondents were house wife of number 30 (37.5),while Civil society and Self employee ware same respondents 20(25) and Health workers and students were also same number 5 (6.25). Monthly income .The respondents in this study were asked their monthly family income. It was observed that the income of the participants was different according to their occupational status. Most of the respondents 31 (38.75)their income was (3500000-5000000sh.so)Some of the families their income was between (lessorequal3000000) with proportion of 20(25)Some of the
  • 41. Daffodil International University Page 41 families their income (5500000-6000000sh.so) with proportion 19(23.75) according to rich people with above than 6000000sh.so 10(12.5). Regarding Smoking status.The most of patients were Never smokers 35(43.75), second level were Current smokers 24 (30) while 21 (26.25) of them were Ex-smokers .Most of patients were none smoke people which are 35(43.75) while 20 (25) started at age of 20 years. 11(13.75) were stared at age of 40 years and 14 (17.5) Were started ages of 50 years and above. The general attitude of most patients was Wish to stop smoke 70 (87.5), while 6 (7.5) were like to smoke and 4 (5) were hate to smoke. Most patients belief that Smoking is harmful 74 (92.5) while 6 (7.5) belief that smoke in not harmful. Regarding the daily or weekly uses of vegetables, the most patients were eat Vegetables one day in week 34 (40.25),26(26.25) were eat Vegetables three days in week,16(20) were eat Vegetables two days in week and 9(11.25) were Vegetables four days in week.The majority patients 46 (57.5) are uses Vegetable oil in their meal preparation, 14 (17.5) are use Margarine in their meal preparation, 12(15) were use Butter in their meal preparation.The Salt intake Ability of most patients are high 39(48.75),moderate of Salt intake Ability 21(26.25),low of Salt intake Ability 20 (25) some of patients 46(57.5) were taken two Spoons meal per day, 18(22.5) were taken one Spoons meal per day,14(17.5) were taken three Spoons meal per day. Some of patients consumed Three kg per week 38(47.5), some of them consumed One kg 24 (30) and 6(7.5) consumed two kilo per week. According the Physical Activity Of RespondentsThe most of patients were no Standing and Walking For not more than 30 minutes 46(57.5) while 34(42.5) Standing and Walking For more than 30 minute. some patients not Increase in breathing or heart rate for at least 10mnute continuously 41(51.25) and Increase in breathing or heart rate for at least 10mnute continuously 39 (48.75).anothers of patients were woken five days 42(50.25),11(13.75) were woken three days and 10(12.5) were two groups which were woken one day and two days while 7(8.75) were worked four days. Regarding their working Majority of patients 44(55)were working whole of the day,16(20) were working 8hrs,14 (177) were working 6hrs and the 6(7.5) were working 3hrs. According Biochemical Measurements Of Respondents Majority of patients 46(57.5) their Fasting blood glucose :Choose accordingly: mmol/l or mg/dl were high while 34(42.5) their Fasting blood glucose :Choose accordingly: mmol/l or mg/dl were low. Regarding Majority of
  • 42. Daffodil International University Page 42 patients 46(57.75) their Total cholesterol Choose accordingly: mmol/l or mg/dl were low and 30(37.5) their Total cholesterol Choose accordingly: mmol/l or mg/dl were high. while 4(5) Total cholesterol Choose accordingly: mmol/l or mg/dl were unable. Some of patients 48(60) their Triglycerides Choose accordingly: mmol/l or mg/dl were high and 32(40) their Triglycerides Choose accordingly: mmol/l or mg/dl were low. In others of patients level of HDL Cholesterol Choose accordingly: mmol/l or mg/dl were high 40(50) and 30 (37.5) HDL Cholesterol Choose accordingly: mmol/l or mg/dl were low while 10(12.5) their Cholesterol Choose accordingly: mmol/l or mg/dl were unable. 5.2 Limitation 1. The study was health facility based therefore we missed people with NCDs symptoms but not have attended health facilities whom might have different characteristics. 2. The results were based on self reports by the use of exit interviews to capture information from respondents. This might lead to the under or over reporting of the responses or giving a continuous response for the following statements which may lead to information bias. This was minimized by structuring the statements of the interview schedule so that some of them had different polarities (positive and negative statements) to keep the respondents from repetitively giving the same response for all subsequent statements. 3. Since the sample size was small (80 respondents) due to limitation of time so, the finding may not reflect the prevailing situation of all country as whole. 4. During the interview some of respondents where hesitated to answer the personal questions.
  • 43. Daffodil International University Page 43 CHAPTER -6 CONCLUSION AND RECOMMENDATIONS 6.2 Conclusions This study attempts to assess the prevalence, levels of risk and major risk factors for developing non communicable diseases in the Howlwagad district of Mogadishu Somalia. The study answered specific research questions and hypotheses on issues relating to sedentary lifestyles, nutritional behaviours, knowledge on NCDs risk factors, and distribution of risk factors of non communicable diseases among the population. The prevalence rate of the behavioural risk factors documented by the study reflect the interplay of the underlying social, economic and cultural driving forces such as low education, unemployment and low incomes. Poor consumption of fruits and vegetables, high consumption of fat, low level of moderate physical activity and others may have also contributed to high obesity, hypertension and hyper-glycaemia prevalent in the community. Males were found to be at high risk on most of the study variables measured compared to females. This empirical evidence has clearly justified the basis of the study objective by the falsification of one of the key research hypotheses that ‘NCDs and their risk factors are equally associated with males and females’. The depth of knowledge and information provided on the magnitude of risk factors for NCDs in the community, which to a very large extent is representative of the entire district, should be relevant for policy formulation and intervention in areas which share similar socio- economic and geophysical characteristics, if not across the entire county as a whole.
  • 44. Daffodil International University Page 44 6.2 Recommendations: Drawing from key findings of the study, the following recommendations are made for consideration and implementation by Health Policy-makers, institutions and all stakeholders. 6.2.1 Government  Strengthening integration of chronic NCD care into Public Health Care services  Establishment of a health facility-based screening programs in the District and Sub- District Hospitals and clinics for early detection of asymptomatic hypertension and diabetic conditions.  Formulation and strengthening of policies to control the incidence of tobacco use in schools, workplaces and other public places to minimize the effects of smoking on passive smokers or the general public as a whole 6.2.2 District Health Management Team (DHMT):  Embarking on community based health education programs on the risk factors for NCDs and its preventive strategies  Strengthening action to promote healthy diet and physical activity in schools.  Strengthening the initiation of home-based programs on healthy diet and indoor and outdoor physical exercises with the female and the elderly as specific targets.  Routine public education on awareness through educational campaigns for promoting healthy life styles.  Establishment and strengthening of a stepwise surveillance system for NCDs to monitor the trend of the diseases over time.  Formation of keep-fit clubs should be encouraged within the communities. 6.2.3 DistrictAssembly  Provision of funds for research into NCDs in the district
  • 45. Daffodil International University Page 45  Assisting the DHMT to establish community clinics for NCDs screening programs.  Multi-cultural activities to tackle chronic non-communicable diseases in the district. REFERENCES 1. Adamson, S., Muula, L. M. (2007).Cigarette Smoking Prevalence among School-going Adolescents in Two African Capital Cities: Kampala Uganda and Lilongwe Malawi, 2007 2. Addae, S. (1996). History of Western Medicine in Ghana, 1880 – 1960. 1996. Durham: Durham Academic Press. 3. Adubofuor, K.O.M., Ofei, F., Mensah-Adubofour, J., Owusu, S.K. (1993). Diabetes in Ghana: A Morbidity and Mortality Analysis. International Diabetes Digest 1993; 4(3), 90-92. 4. Adubofour, K.O.M., Ofei, F., Mensah-Adubufour J, Owusu SK. (1997) Diabetes in Ghana. In Gill G, Mbanya J-C, Alberti G (Eds), Diabetes in Africa. 1997; FSG Communications Ltd, Reach, Cambridge, UK. (Pp. 83-88) 5. Agyemang, C. and Owusu-Dabo E. (2006). Prehypertension in the Ashanti Region of Ghana, West Africa: An Opportunity For Early Prevention Of Clinical Hypertension 6. Ahluwalia, I.B., Mack K.A., Murphy, W., Mokdad A.H., Bales, V.S. (2003). State- Specific Prevalence of Selected Chronic Disease-Related Characteristics—Behavioral Risk Factor Surveillance System, 2001. MMWR (Surreal. Summ.) 52:1–80 7. Allied Dunbar National Fitness Survey (1992). Health Education Authority and Sports Council, London. 8. Amoah, A.G.B., Owusu, K.O. And Adjei, S. (2002).Diabetes in Ghana: A Community Prevalence Study in Greater Accra. Diabetes Research and Clinical Practice, 2002; 56: 197-205. 9. Amoah, A.G. B. (2003). Obesity in Adult Residents of Accra, Ghana. Ethn Dis. 2003 13(2 Supp 12):S97–S101.Summer; [Pubmed]
  • 46. Daffodil International University Page 46 10. Baridalyne, N., Anita A., Lakshmy R., Ritvik, K. A. And Bela S.(2003). Profile of Biochemical Risk Factors for Non Communicable Diseases in Urban, Rural and Periurban Haryana, India 11. Bela S., Prashant M., (2005): Risk Factor Surveillance for Non-Communicable Diseases (NCDs): The Multi-Site ICMR-WHO Collaborative Initiative 12. Betre, M., Kebede D. And Kassaye, M (1997). Modifiable Risk Factors for Coronary Heart Disease among Young People in Addis Ababa. East Afr Med J 1997, 74(6):376-81. Abstract 13. Baridalyne, N., Anita A., Lakshmy R., Ritvik, K. A. And Bela S.(2003). Profile of Biochemical Risk Factors for Non Communicable Diseases in Urban, Rural and Periurban Haryana, India 14. Bela S., Prashant M., (2005): Risk Factor Surveillance for Non-Communicable Diseases (NCDs): The Multi-Site ICMR-WHO Collaborative Initiative 15. Betre, M., Kebede D. And Kassaye, M (1997). Modifiable Risk Factors for Coronary Heart Disease among Young People in Addis Ababa. East Afr Med J 1997, 74(6):376-81. Abstract 16. Biritwum, R. B., Gyapong, J. And Mensah, G. (2005).The Epidemiology of Obesity in Ghana. Ghana Medical Journal, 2005; 39(3): 82-85. 17. Birth to Twenty Study (2002). Physical Activity and South African Children –Some Shocking Findings. March 2002. Study Updates. 18. Bosu, W.K. (2007). Ghana’s National NCD Programme: History, Prospects And Challenges. Paper Resented At The 1st Annual Workshop, 19. British Academy UK-Africa Academic Partnership On Chronic Disease In Africa, Noguchi Memorial Institute For Medical Research. (12th April 2007) 20. Canadian Fitness And Lifestyle Research Institute (1998). Physical Inactivity Crisis Of Children And Youth Continues to Worsen. February 2, 1998. 21. Cappuccio, F.P., Micah, F.B., Emmett, L., Kerry, S.M., Antwi, S., Martin-Peprah, R., Phillips, R.O., Plange-Rhule, J. And Eastwood, J.B. (2004). Prevalence, Detection, Management, and Control of Hypertension In Ashanti, West Africa. Hypertension. 43(5):1017-22.
  • 47. Daffodil International University Page 47 22. Cappuccio, F.P., Macgregor, G.A. (1991). Does Potassium Supplementation Lower Blood Pressure? A Meta-Analysis of Published Trials. Journal of Hypertension: 466, Vol 9 No 5 23. Cent. D. (2005). Control Prev. 2005. Racial/Ethnic Disparities In Prevalence, Treatment, and Control of Hypertension—United States, 1999–2002. MMWR. 54:7–9 24. Center for Disease Control and Prevention (2001). Increasing Physical Activity: A Report on Recommendations of the Task Force on Community Preventive Services. Morbidity And Mortality Weekly Report 50:1-16. Cutler, J., Macmahon, S., Peto, R., Collins, R., 25. Cutler, J., Macmahon, S., Peto, R., Collins, R., Sorlie, P. (1990). Blood Pressure, Stroke and Coronary Heart Disease. I, Prolonged Differences in Blood Pressure. Lancet (British Edition) 26. Dekkers, J.C., Treiber, F.A., Kapuku, G., Snieder, H. (2003). Differential Influence of Family History of Hypertension and Premature Myocardial Infarction on Systolic Blood Pressure and Left Ventricular Mass Trajectories In Youth. Pediatrics 111:1387–93 27. Dodu, S.R.A. And De Heer, N. (1964).Ghana Medical Journal, 1964; 3:75. 28. Emmanuel, R., Abdurahman A., Adamson, S. M. ( 2007). Prevalence And Determinants of Adolescent Tobacco Smoking In Addis Ababa, Ethiopia, BMC Public Health 2007, 7:176doi 29. Elliott, R.B., Pilcher, C.C., Fergusson, D.M., Stewart, A.W. (1996). A Population based strategy to prevent Insulin-Dependent Diabetes Using Nicotinamide. J. Pediatr. Endocrinol. Metab. 9 (5): 501–9. 8961125. 30. Ezzati, M., and Lopez, A.D. (2000). Measuring The Accumulated Hazards of Smoking: Global and Regional Estimates For 2000 460. Tob Control 2003 Mar;12(1):79-85. 31. Fava, C., Burri, P., Almgren, P., Groop, L., Hulthen. U.L. And Melander, O. (2004). Heritability of Ambulatory and Office Blood Pressure Phenotypes in Swedish Families. J. Hypertens. 22:1717–21 32. Franklin, M., Jagoe, K., Edwards, R., Whiting, D., Unwin, N. (1990). Tobacco Smoking in Tanzania, East Africa: Population Based Smoking Prevalence Using Expired Alveolar Carbon Monoxide as a Validation Tool 33. Flegal, K.M., Carroll, M.D., Ogden, C.L., Johnson, C.L. (2002) - Prevalence And Trends In Obesity Among US Adults, 1999-2000.American Medical Assoc.
  • 48. Daffodil International University Page 48 34. Frantz, J., Phillips, J. And Amosun, S. (2003). Promotion Of Physical Activity In South African Youth - Is It The Answer to the Public Health Burden Of Chronic Disease? African Journal for Physical, Health Education, Recreation And Dance 9(2): 200-207. 35. Garrow, J.S. (1988). Obesity And Related Diseases. London: Churchill Livingstone; 1988. Pp. 1–16. 36. Galderisi, M., Benjamin, E.J., Evans, J.C., D’Agostino, R.B. (1993). Impact of Heart Rate and PR Interval On Doppler Indexes Of Left Ventricular Diastolic Filling. The American Journal of Cardiology, Ncbi.Nlm.Nih.Gov 37. Ghana Statistical Service (GSS).(2004). Noguchi Memorial Institute For Medical Research (NMIMR)And ORC Macro. 2004. 38. Ghana Demographic and Health Survey, 2003. Ghana Statistical Service: Accra, Ghana, 2004. 39. Global Youth Tobacco Survey Collaborating Group (2003). Differences in Worldwide Tobacco Use By Gender: Findings From The Global Youth Tobacco Survey. J Sch Health 2003, 73:207-15. Abstract 40. Hajjar, I., Kotchen, T.A. (2003). Trends In Prevalence, Awareness, Treatment, And Control Of Hypertension In The United States, 1988–2000. JAMA 290:199–206 41. Hajjar, I., Jane, M. K., Theodore A. K. (2006). Hypertension: Trends in Prevalence, Incidence, and Control .Annual Review Of Public Health. Vol. 27: 465-490 42. Han, T.S., Seidell, J.C., Currall, J.E., Morrison, C.E., Deurenberg, P. (1997). Lean ME. The Influences of Height and Age on Waist Circumferences as an Index of Adiposity in Adults. Int J Obes Relat Metab Disord. 1997;21:83–89. [] 43. Hublet, A., De Bacquer, D., Valimaa, R., Godeau, E., Schmid, H., Rehav, G. (2006) Smoking Trends Among Adolescents from 1990 to 2002 In Ten European Countries And Canada. BMC Public Health. 2006;6:280. [] 44. Juliet, A., Liam, S. and David, A. L. (2006): Smoking Patterns In Ghanaian Civil Servants: Changes Over Three Decades 45. Kaur, J. And Bains, K.(2006). A Study Of The Risk Factor Profile Of Cardiovascular Diseases In Rural Punjabi Male Patients. Indian J Public Health 2006, 50(2):97-100. Abstract.
  • 49. Daffodil International University Page 49 46. Kearney, P.M., Whelton, M., Reynolds, K., Muntner, P., Whelton, P.K., He, J. (2005). Global Burden of Hypertension: Analysis Of Worldwide Data. Lancet 365:217–23 47. Khaw, K.T., Barrett-Connor, E. (1988). Endogenous Sex Hormones and Cardiovascular Disease in Men. A Prospective Population-Based Study. American Heart Assoc. 48. Kirstie, J., Edwards, R., Mugusi, F., Whiting, D., Unwin, N.(2001). Tobacco Smoking In Tanzania, East Africa: Population Based Smoking Prevalence Using Expired Alveolar Carbon Monoxide As A Validation Tool. 49. Lean, M.E.J., Han, T.S., Morrison, C.E. (1995). Waist Circumference as A Measure For Indicating Need For Weight Management. Bri Med J. 1995;311:158–161. 50. Lopez, A.D., Matters, C.D.(2006). Measuring The Global Burden Of Disease And Epidemiological Transitions: 2002–2030. Ann Trop Med Parasitol. 2006;100:481–499. 51. Mehan, M.B., Kantharia, N.B., Surabhi, S.(2007). Risk Factor Profile of Non- Communicable Diseases In An Industrial Productive (25-59 Years) Population Of Baroda. Int J Diab Dev Ctries 2007;27:116-21 52. Must, A., Spadano, J., Coakley, E.H., Field, A.E., Colditz, G., Dietz, W.H.(1999) The Disease Burden Associated With Overweight And Obesity. JAMA 1999; 282: 1523-1529, 53. Murray, C.J.L., Lopez, A.D., (1996). Eds. Global Burden of Disease. Harvard, MA: Harvard School of Public Health, 1996. (Vol 1 Of Global Burden Of Disease And Injury Series.) 54. Nawi, N., Hans, St., Ruth, B., Mohammad, H., Stig, W., Lars, W. (2006): Preventable Risk Factors For Non Communicable Diseases In Rural Indonesia: 55. Nieto, F.J., Alonso, J., Chambless, L.E., Zhong, M., Ceraso, M. (1995). Population Awareness and Control Of Hypertension And Hypercholesterolemia. The Atherosclerosis Risk in Communities Study. Arch. Intern. Med. 155:677–84 56. Owusu-Dabo, E., Lewis, S., McNeill, A., Gilmore, A., Bril, J.(2009). Smoking Uptake and Prevalence in Ghana. 57. Pampel, F.C.(2002). Patterns Of Tobacco Use In The Early Epidemic Stages: Malawi And Zambia, 2000–2002. Am J Pub Health. 2002;95:1009–1015. 58. Paffenbarger, R. S., Wing, A. L., Hyde, R. T. And Jung, D. L.(1983). Physical Activity And Incidence Of Hypertension In College Alumni. Am J Epidemiol 1983; 117: 245–57.
  • 50. Daffodil International University Page 50 59. Pesut, D.And Basara, H.Z.(2006).Cigarette Smoking And Lung Cancer Trends In Serbia – A Ten Year Analysis. Med Pregl 2006, 59(5–6):225-9. Pubmed Abstract 60. Peto, R. And Lopez, A.D. (2004). The Future Worldwide Health Effects of Current Smoking Patterns. In Tobacco: Science, Policy And Public Health. New York: Oxford University Press; 2004. 61. Pobee, J.O.M. (2006). The Heart Of The Matter. Community Profile of Cardiovascular Diseases Of A Sub- Saharan African Country. 2006. Accra: Commercial Associates Ltd 62. Popkin, B.M. (1999). Urbanization, Lifestyle Changes and the Nutrition Transition. World Development, 27(11): 1905-1999. 63. Roberts, D. E., Meakem, T. D., Dalton, C. E., Haverstick, D. M and Lynch, C. (2007). Prevalence of Hyperglycemia in a Pre-Surgical Population . The Internet Journal of Anesthesiology. 2007 64. Sugathan, T.N., Soman , C.R., Sankaranarayanann, K. (2006). Behavioural Risk Factors for Non Communicable Diseases Amongadults In Kerala, India 65. Summerfield, L. (1998). Promoting Physical Activity and Exercise Among Children. Http:// Www. Kidssource.Com/ 66. Toustad, S., Andrew-Johnston J. (2006). Cardiovascular Risks Associated With Smoking: A Review For Clinicians. Eur J Cardiovasc Prev Rehabil 2006, 13(4):507-14. Pubmed Abstract 67. Townsend, L., Flisher, A.J., Gilreath, T., King G.(2006). A Systematic Review of Tobacco Use Among Sub-Saharan Africa Youth. Journal of Substance Use 2006, 11(4):245-269. 68. Van, I.T. (1985). Health Implications of Overweight and Obesity In The United States. Ann Intern Med. 1985;103:983–988. 69. Vorster, H.H. (2000). An Epidemiological Study of Hypertension and Its Determinants in a Population in Transition: The THUSA Study. Journal of Human Hypertension, 14: 779-787. 70. Vasan, R.S., Larson, M.G., Leip, E.P., Evans, J.C. (2001). Impact Of High-Normal Blood Pressure On The Risk Of Cardiovascular Disease. New England Journal Of Medicine. Content.Nejm.Org 71. Wassertheil-Smoller, S., Anderson, G., Psaty, B.M., Black, H.R., Manson, J. (2000). Hypertension And Its Treatment In Postmenopausal Women: Baseline Data From The Women's Health Initiative. Hypertension 36:780–89
  • 51. Daffodil International University Page 51 72. Wellington, E.(2002). Global Youth Tobacco Survey Fact Sheet, Ghana. Global Youth Tobacco Survey Collaborative Group 2002 Mar 6. 73. Winkvist, A., Barcos, A., Berglund, G., Mulligan, A. (2007). -Public Health Nutrition, Cambridge Univ Press Page 1. Diversity Of Dietary Patterns Observed In The European Prospective 74. Wolf, H.K., Tuomilehto, J., Kuulasmaa, K., Domarkiene, S., Cepaitis, Z., Molarius, A., Sans, S., Dobson, A., Keil, U. Rywik, S.,(1997) . WHO MONICA Project. Blood Pressure Levels in The 41 Populations of the WHO MONICA Project. J Hum Hypertens 1997; 11:733-42. [Pubmed] 75. World Health Organization (2006). The WHO Stepwise Approach To Chronic Diseases Risk Factor Surveillance. Chronic Non-Communicable Diseases Risk Factors Survey in Iraq2006 76. World Health Organisation, (2002). Obesity: Preventing and Managing the Global Epidemic: Report of a WHO Consultation, Geneva. 2000. WHO Technical Report Series 894. 77. World Health Organisation (2001). Physical Activity. Department of Non-Communicable Disease Prevention And Health Promotion. 78. World Health Organisation: Geneva. World Health Report (2001). Mental Health: New Understanding New Hope. World Health Organisation, Geneva. 79. WHO/FAO. (2003). Diet, Nutrition and the Prevention of Chronic Diseases: Report of a Joint WHO/FAO Expert Consultation. 2003. Geneva: WHO.
  • 52. Daffodil International University Page 52 STEP 1: SELF REPORTED. DEMOGRAPHIC CHARACTERISTICS No Questions Coding categories Code 1 What is your age? a) 20-40 b) 40-60 c) 60-80 d) 80 and above 2 What is your Sex? a) Male b) Female 3 What is you Marital Status? a) Single b) Married c) Widowed d) Divorced 4 What is your level of education? a) Never b) Primary c) Secondary d) diploma e) Bachelor degree and above 5 What is your current profession? a) House wife b) civil society c) self employee d) Health worker
  • 53. Daffodil International University Page 53 SECTION B: BEHAVIOURAL MEASUREMENTS Tobacco Use 8 Which of the following best describes your smoking status ? a) Never smoke b) Current smoker c) Ex-smoker 9 At what age did you started smoking? a) 20 years b) 40 years c) 50 years and above d) Non 10 Do you smoke any of the tobacco products? such as pipes or cigarettes daily? a) Yes b) No 11 How many time in a day do you smoke? a) One time a day b) Two times a day c) Three times aday d) None 12 What is your general attitude towards smoking? a) Wish to stop b) Good for my use 3. c) Like to smoke 6 What is your House hold size? a) One b) Two c) Three d) Four e) Greater than four 7 What is your family’s total income in each month? (In sh.so)? a) ≤ 3000000 b) 3500000-5000000 c) 5000000-5500000 d) 6000000 and above
  • 54. Daffodil International University Page 54 13 Do you belief that smoking is harmful? a) Yes b) No Dietary Behaviour 14 In a typical week, how many days do you eat fruit? a) One day b) Two days c) Three days d) Four days 15 In a typical week, on how many days do you eat Vegetables? a) One day b) two days c) Three days d) Four days 17 What type of oils or fat is most often used for meal preparation in your household? a) Vegetable oil b) Lard 3. Butter c) Margarine d) Peanut butter 18 Which of the following best describes your salt intake ability. a) Low b) Moderate c) 3. High 19 On average, how many spoonful of salt is taken per meal/day? a) One b) Two c) Three d) four 20 On the average, how many kilos of sugar is consumed per week? a) One kg b) Two kg c) Three kg d) Four kg Physical activity 21 Does your work involve mostly sitting or standing, with walking for not more than 30 minutes at a time? a) Yes b) No 22 Does your work involve vigorous-intensity activity a) Yes
  • 55. Daffodil International University Page 55 that causes large increase in breathing or heart rate for at least 10 minutes continuously? b) No 23 In a typical week, on how many days do you do moderate intensity activities as part of your work? a) One day b) Two days c) Three days d) Four days e) Five days 24 How long is your typical working day? a) Whole day b) 8 hours c) 6 hours d) 3 hours 25 Do you walk or use a bicycle (pedal cycle) for at least 10 minutes continuously to get to and from places? a) Yes b) No SECTION C: BODY MASS INDEX Question Category code 26 What is your body mass index? BM1(BMI-Kg/m2 a) less than 14.9 b) from 15 to 18.4 c) from 18.5 to 22.9 d) from 23 to 27.5 e) from 27.6 to 40 f) greater than 40 SECTION D: BIOCHEMICAL MEASUREMENTS Blood Glucose
  • 56. Daffodil International University Page 56 27 During the past 12 hours have you had anything to eat or drink, other than water? a) Yes b) No 28 Fasting blood glucose Choose accordingly: mmol/l or mg/dl a) Low b) High Blood Lipids 29 Total cholesterol Choose accordingly: mmol/l or mg/dl a) Low b) High 30 HDL Cholesterol Choose accordingly: mmol/l or mg/dl a) Low b) High c) Unable