Basic Civil Engineering first year Notes- Chapter 4 Building.pptx
PhD Symposium 2011
1. PhD Symposium 2011, Department of Chemical Engineering, Imperial College London
Fabrication of 3-D Scaffolds from poly(3-hydroxybutyric acid) (PHB) and poly(3-hydroxybutyric acid-co-3-hydroxyvalerate)
(PHBV) for Leukaemia Tissue Engineering Applications
Saiful Zubairi1, Alexander Bismarck1, Apostolis Koutinas2, Nicki Panoskaltsis3 and Athanasios Mantalaris1
1Department of Chemical Engineering, Imperial College London, 2Department of Food Science and Technology, Agricultural University of Athens, and 3Department of
Haematology, Northwick Park & St. Mark’s campus, Imperial College London. For additional information please contact: saiful.zubairi08@imperial.ac.uk
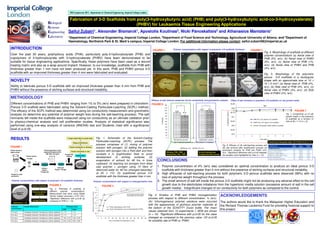
INTRODUCTION FIGURE 4 Polymer concentrations with respect to polymeric 3-D scaffolds thickness FIGURE 5
Fig. 4. Morphology of scaffolds at different
Over the past 30 years, polyhydroxy acids (PHA), particularly poly-3-hydroxybutyrate (PHB) and (a) (b) (a) (c)
polymer concentrations (a) Aerial view of
copolymers of 3-hydroxybutyrate with 3-hydroxyvalerate (PHBV) have been demonstrated to be PHB (5%, w/v), (b) Aerial view of PHBV
suitable for tissue engineering applications. Specifically, these polymers have been used as a wound PHB 5% (w/v) PHBV 5% (w/v)
PHB (4%, w/v)
PHBV (4%, w/v)
(5%, w/v), (c) Aerial view of PHB (1%,
healing matrix and also as a wrap-around implant. However, to our knowledge, scaffolds from PHB with w/v), (d) Aerial view of PHBV and PHB
thickness greater than 1 mm have not been produced yet. In this work, PHB and PHBV porous 3-D (3%, w/v).
scaffolds with an improved thickness greater than 4 mm were fabricated and evaluated. Fig. 5. Morphology of the polymeric
(c) (d) (b) (d)
INNER SIDE INNER SIDE
porous 3-D scaffolds in a rectangular
NOVELTY PHB (4%, w/v) PHBV (4%, w/v) shape with an approximate size of 10 ×
PHB 1% (w/v)
PHB 3% (w/v) PHBV 3% (w/v) ∼10 mm ∼10 mm
10 × 5 mm3: (a) Aerial view of PHB (4%,
Ability to fabricate porous 3-D scaffolds with an improved thickness greater than 4 mm from PHB and w/v), (b) Side view of PHB (4%, w/v), (c)
PHBV without the presence of etching surfaces and structural instability. ∼ 5 mm Aerial view of PHBV (4%, w/v), (d) Side
INNER SIDE
INNER SIDE view of PHBV (4%, w/v).
METHODOLOGY
Efficacy of salt removal measured via ion conductivity and gravimetric analysis Effect of salt remnants in polymeric 3-D scaffolds on cell growth media
Different concentrations of PHB and PHBV ranging from 1% to 5% (w/v) were prepared in chloroform. FIGURE 6 120 * *
20.85
NS
Porous 3-D scaffold were fabricated using the Solvent-Casting Particulate-Leaching (SCPL) method. 110 20.8
99.67 99.97
The efficacy of the SCPL method was determined using ion conductivity measurement and gravimetric 100 92.59 FIGURE 7
Conductivity (mS/cm)
90
82.20 20.75
analysis (to determine any potential of polymer weight loss during the salt-leaching process). The salt 80
Fig. 7. Conductivity ( κ) of cell
20.7 growth media in the presence
remnants left inside the scaffolds were measured using ion conductivity as an ultimate validation prior
% Efficacy
70 PHB (4%, w/v) porous 3-D scaffolds of scaffolds as a function of
to physico-chemical analysis and cell proliferation studies. Analysis of statistical significance was 60 20.65 time at 20 ± 1 oC (n = 3).
PHBV (4%, w/v) porous 3-D scaffolds
50
performed using one-way analysis of variance (ANOVA) test and Students t-test with a significance 40
20.6 Control: Cell growth media without a scaffold
level of p<0.05. 30 20.55
20
20.5
10
0 1 2 3 4 5 6 7
RESULTS Porogen residual effect Vs. growth media Fig. 1. Schematic of the Solvent-Casting 0
Salt-leaching process Lyophilization process Time (days)
Efficacy of Salt Removal
Particulate-Leaching (SCPL) process. The Type of polyhydroxyalkanoates (PHAs) porous 3-D scaffolds Conductivity of cell growth media = 20.77 mS/cm @ 20 ±1 oC
process comprises of (1) mixing of polymer Fig. 6. Efficacy of (A) salt-leaching process and
FIGURE 1 Polymer concentration vs. thickness
solution with porogen; (2) adding the polymer PHB (4%, w/v) PHBV (4%, w/v) (B) salt removal after lyophilization process via
Polymer solution in Solvent evaporation in fume
solution with porogen into a Petri-dish and then gravimetric analysis for PHB and PHBV (4%,
cupboard (Complied with UK- Polymer concentration vs. time Efficiency: PHB > PHBV → No lost of polymer mass
organic solvent w/v). *Significant difference with p<0.05 between
SED, 2002: <20 mg/m3) Porogen-DIW incubate it in lyophilization flask to avoid Hydrophilicity: PHB > PHBV throughout the SCPL process the samples were highlighted by lines (n = 10).
Polymer solution leaching FABRICATION
+ Porogen
development of etching surfaces; (3)
3
2
4 evaporation of solvent for 48 hrs in fume CONCLUSIONS
1 Porous 3-D 5 cupboard; (4) leaching out porogen from dried
Dried cast
scaffolds
cast polymer + porogen using 10 liters of 1. Polymer concentration of 4% (w/v) was considered an optimal concentration to produce an ideal porous 3-D
Polymer +
Solvent + Polymer + Porogen deionized water for 48 hrs (changed twice/day) scaffolds with thickness greater than 4 mm without the presence of etching surfaces and structural instability.
Porogen cast
Porogen (i.e., NaCl,
at 20 ± 1oC; (5) lyophilized porous 3-D 2. High efficacies of salt-leaching process for both polymeric 3-D porous scaffolds were observed (99%) with no
sucrose etc.) scaffolds with the thickness greater than 4 mm. loss of polymer weight throughout the process.
Polymer concentrations with respect to polymeric 3-D scaffolds thickness Polymer concentrations with respect to homogenization time 3. The small amount of salt left inside the porous 3-D scaffolds might not be producing any adverse effect to the cell
Cut into 10 sections FIGURE 2 FIGURE 3
growth due to the electrolytes imbalance from the hypertonic media solution (excessive amount of salt in the cell
5.5
Fig. 2. Thickness of scaffolds at 5 Ψ * *
growth media) - Insignificant changes of ion conductivity for both polymers as compared to the control.
Randomly selected different polymer concentrations.
Polymers concentration, % (w/v)
Porous 3-D 4.5
of 5 sections Measurement was done using Digital (A) Inhomogeneous polymer solutions
scaffolds
Vernier Caliper (accuracy ± 0.01 mm).
4
3.5
*Ψ
*
contain glutinous semi-solid residual Fig. 3. Kinetics of PHB and PHBV homogenization ACKNOWLEDGEMENTS
*Significant difference with p<0.05 as Ψ*
process with respect to different concentration, % (w/v).
Average thickness compared to PHB (n = 10). 3 *
Replication (n = 10) 2.5
(A): Inhomogeneous polymer solutions were occurred The authors would like to thank the Malaysian Higher Education and
2 * Ψ
*
with the appearances of glutinous polymer materials at the Richard Thomas Leukemia Fund for providing financial support to
Polymer General observation Thickness (mm) Poly(3-hydroxybutyric acid): PHB
concentration 1.5 the bottom of the SCHOTT Duran bottle. The mean
PHB PHBV Poly(3-hydroxybutyric acid-co-hydroxyvalerate): PHBV this project.
1% (w/v) Completely dissolved, homogenous solution appeared < 1.0 < 1.0
1 Ψ
values obtained from 10 experiments ± SEM are shown
0.5
2% (w/v) Completely dissolved, homogenous solution appeared < 1.0 < 1.0 (n = 10). *Significant difference with p<0.05 for the value
0
3% (w/v) Completely dissolved, homogenous solution appeared 1.80 ± 0.79 1.60 ± 0.79* 0 5 10 15 20 25 30 35 40 45 50 55 60 65 changed as compared to the previous value. (Ψ) p<0.05
4% (w/v) Completely dissolved, homogenous solution appeared 5.25 ± 0.36 4.40 ± 0.52* Time of complete homogenization (mins) for solubility rate of PHB vs. PHBV.