Más contenido relacionado
La actualidad más candente (20)
Similar a Excel creating pivot table (20)
Excel creating pivot table
- 1. Excel 2007
Creating Pivot Tables
Introduction
Pivot Table Reports
Watch the video! (10:41min) - Tips for watching our videos.
Download the example to work along with the video.
Why are They Named Pivot Tables?
You may be wondering why it is called a pivot table. Basically, pivot tables allow you to pivot, or move, data so
that you can produce answers to questions. Once you create a pivot table, you can very easily see what effect
pivoting the data has on the spreadsheet information.
To Create a Pivot Table Report (Part I):
Š Select the cells in your spreadsheet that you want to use in the pivot table report.
Š Select the Insert tab.
Š Click the PivotTable command.
Š Click PivotTable again. Excel selects cells in the actual spreadsheet and the Create PivotTable dialog
box opens.
» Select a table or range is already selected and the Table/Range field shows the range of the
selected data. New Worksheet is also selected by default as the place where the report will be
placed.
Page 1
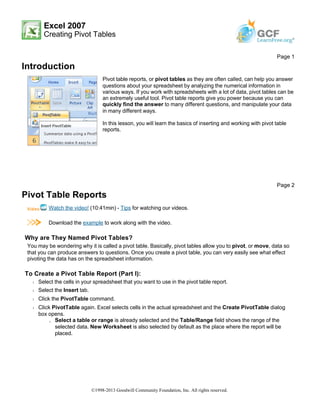
Pivot table reports, or pivot tables as they are often called, can help you answer
questions about your spreadsheet by analyzing the numerical information in
various ways. If you work with spreadsheets with a lot of data, pivot tables can be
an extremely useful tool. Pivot table reports give you power because you can
quickly find the answer to many different questions, and manipulate your data
in many different ways.
In this lesson, you will learn the basics of inserting and working with pivot table
reports.
Page 2
©1998-2013 Goodwill Community Foundation, Inc. All rights reserved.
- 2. Š Click Existing Worksheet and select a worksheet, if you do not want the pivot table to appear in a new
worksheet.
Š Click OK.
Creating a Pivot Table Report
If you use the sample spreadsheet to create a pivot table, you can see that the column headings are
salesperson, region, account, order amount, and month. When you create a pivot table, each column label
in your data becomes a field that can be used in the report. The Field List appears on the right side of the
report, while the layout area appears on the left.
Page 3
©1998-2013 Goodwill Community Foundation, Inc. All rights reserved.
- 3. To Create a Pivot Table Report (Part 2):
Š Determine what question you want your pivot table report to answer. For example, using the sample
spreadsheet, you might want to know which salesperson sold the greatest dollar amount.
Š Determine the fields that are necessary to answer this question. In this example, salesperson and order
amount.
Š Select the check box next to the Salesperson field in the PivotTable Field List. The field will appear in the
drag and drop area at the bottom of the field list and in the layout area. The order amount data appears on
the right. This is a default setting in Excel – data with numbers will always appear on the right.
Š Select the check box next to the Order Amount field in the PivotTable Field List. The field will appear in
the drag and drop area at the bottom of the field list and in the layout area. All of the salesperson data
appears on the left side as rows.
Š You can now see the answer to your question in the report on the left.
©1998-2013 Goodwill Community Foundation, Inc. All rights reserved.
- 4. To Add a Report Filter:
Š Select a field in the Field List. In this example, choose Region. By default, it will appear in the Row Labels
group.
Š Click and drag Region into the Report Filter section.
Š Release the mouse button. The region appears at the top of the report as a filter.
Š The arrow by the Region fields shows (All). To show just the data for a specific region, click the drop-down
arrow and select the region. To see multiple regions, click the Multiple Regions box, select the regions to
display, and then, click OK.
Moving, or Pivoting Data:
Š Click and drag a field from one area to another.
Š Release the mouse button to drop the field in the new area. In this example, we move Region from Report
Page 4
©1998-2013 Goodwill Community Foundation, Inc. All rights reserved.
- 5. Filter to Column Label. The pivot table report will change.
OR
Š Right-click one of the rows. A menu will appear.
Š Select Move and then select a move option.
To Create a PivotChart
Š Select the Pivot Chart command from the Options tab. The Insert Chart dialog box appears.
©1998-2013 Goodwill Community Foundation, Inc. All rights reserved.
- 6. Š Select the chart you’d like to insert.
Š Click OK. The chart will now appear on the same sheet as the Pivot Table.
The information in the chart includes the information in the pivot table, rather than all the original source data.
Challenge!
Use the Company Sales workbook to complete this challenge.
Page 5
Š Create a pivot table report that calculates the amount each salesperson sold.
Š Filter the report by region.
Š View the data for the salespeople in the North and West region.
Š Who sold the greatest dollar amount in those two regions?
©1998-2013 Goodwill Community Foundation, Inc. All rights reserved.