SlideShare una empresa de Scribd logo
1 de 11
Descargar para leer sin conexión
CREATING FREQUENCY DISTRIBUTION TABLES, HISTOGRAMS AND POLYGONS USING EXCEL ANALYSIS
TOOLPAK


Make sure that you have the Data Analysis TookPak loaded on your computer. If not, go to the document, How
to Load Excel Analysis ToolPak on Your Computer on the Course Website (on Excel Instructions Page).


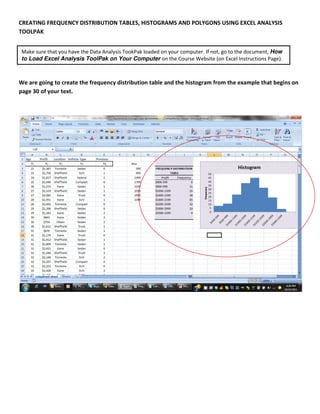
We are going to create the frequency distribution table and the histogram from the example that begins on
page 30 of your text.
Download the Applewood_Chicago.xls file that you will find on the Data Files page of the course website.


Once we have downloaded our data we need to determine the number of “classes” and the “interval” size for
our frequency table.

To determine the number of classes for our table we need to find the smallest number of classes that is
                                                                                                k
greater than the number of observations. The formula for determining the number of classes is 2 . In our
                                                       y
example there were 180 vehicles sold. We will use the x button on the calculator.
Type the following sequence into the calculator:     2,        , 7, =


The 128 we obtain with k=7 is less than 180. If we try k=8 we obtain 256. This is the smallest number of classes
that is greater than the observation of 180.


The formula to determine the size of the class interval is     ≥          where H = the largest value and L =
the lowest value. The largest value is $3,292 and the lowest value is $294.


                                           $3,292 − $294
                                       ≥                 = $374.75
                                                 8
We will round up to the $400 for a more meaningful interval.

Next we set up our intervals (remember the classes must not overlap)

                                                     Classes
                                              $200      to        $599
                                              $600      to        $999
                                             $1000      to       $1399
                                             $1400      to       $1799
                                             $1800      to       $2199
                                             $2200      to       $2599
                                             $2600      to       $2999
                                             $3000      to       $3399
The next step is to set up our Bins (the upper value in each class) in our Excel sheet


Now it’s time to create our frequency table and histogram for the profit variable.

Click on Data in the toolbar and then click Data Analysis.


Click Histogram and OK
Click on the Input Range and highlight all the Profit data.


Click on the Bin Range and then highlight the Bins you entered. Click on Output Range and click on cell I3.
Make sure Chart Output is checked. Click OK.
The following will appear.


Both the frequency table and Histogram need some formatting. Replace the Bin values by typing the full class
intervals. Add a title to the table and change “Bins” to “Profit”.
HISTOGRAMS

We need to remove the spaces between the classes in the Histogram. To reformat the Histogram, right click
on the chart and click Format Data Series…


Move the Gap Width to 0%.


Right click on Bin and Frequency on the chart. Click Delete.


                                                Histogram
                                         60
                             Frequency


                                         40
                                         20
                                          0
                                                                        Frequency


                                                    Bin
Finally, resize the chart by dragging on the corners. Your Histogram should look like this.


FREQUENCY POLYGON

We will use a different method to create a frequency polygon of our data.


                                                With a frequency polygon we need to have beginning and
                                                ending intervals that have no observations. We can copy
                                                our frequency distribution table and add an interval
                                                containing $0-399 and another containing $4000 and
                                                above to the new table.
Next, highlight the new table and then go to Insert on the tool bar and click Line and the first option with
markers.


The following graph will appear. Right click on Series1 and click delete.


Your graph should look like this.
CUMULATIVE FREQUENCY POLYGON

Click on Data in the toolbar and then click Data Analysis.


Click Histogram and OK


Click on the input range box and highlight the profit data. Click on the Bin Range box and highlight the bin
data. Click on Output Range box and click on a blank cell. Make sure that Cumulative Percentage and Chart
Output is checked.
A Cumulative Frequency Distribution Table and a combined histogram and a cumulative polygon will appear.


Reformat both the table and graph until they look like this.

Más contenido relacionado

La actualidad más candente

Construction of a frequency table
Construction of a frequency tableConstruction of a frequency table
Construction of a frequency tableMark Santos
 
2.1 frequency distributions, histograms, and related topics
2.1 frequency distributions, histograms, and related topics2.1 frequency distributions, histograms, and related topics
2.1 frequency distributions, histograms, and related topicsleblance
 
Probability and statistics (frequency distributions)
Probability and statistics (frequency distributions)Probability and statistics (frequency distributions)
Probability and statistics (frequency distributions)Don Bosco BSIT
 
Frequency distribution
Frequency distributionFrequency distribution
Frequency distributionAishwarya PT
 
Chapter 2 250110 083240
Chapter 2 250110 083240Chapter 2 250110 083240
Chapter 2 250110 083240guest25d353
 
Excel tutorial for frequency distribution
Excel tutorial for frequency distributionExcel tutorial for frequency distribution
Excel tutorial for frequency distributionS.c. Chopra
 
Frequency Tables, Frequency Distributions, and Graphic Presentation
Frequency Tables, Frequency Distributions, and Graphic PresentationFrequency Tables, Frequency Distributions, and Graphic Presentation
Frequency Tables, Frequency Distributions, and Graphic PresentationConflagratioNal Jahid
 
Frequency Distributions
Frequency DistributionsFrequency Distributions
Frequency Distributionsjasondroesch
 
Report frequency distribution table
Report frequency distribution tableReport frequency distribution table
Report frequency distribution tableMaTeresa Berondo
 
frequency distribution
 frequency distribution frequency distribution
frequency distributionUnsa Shakir
 
2.3 Histogram/Frequency Polygon/Ogives
2.3 Histogram/Frequency Polygon/Ogives2.3 Histogram/Frequency Polygon/Ogives
2.3 Histogram/Frequency Polygon/Ogivesmlong24
 
Chapter 3: Prsentation of Data
Chapter 3: Prsentation of DataChapter 3: Prsentation of Data
Chapter 3: Prsentation of DataAndrilyn Alcantara
 
Frequency Distribution
Frequency DistributionFrequency Distribution
Frequency DistributionTeacherMariza
 
Presentation of Data and Frequency Distribution
Presentation of Data and Frequency DistributionPresentation of Data and Frequency Distribution
Presentation of Data and Frequency DistributionElain Cruz
 
2.1 Part 1 - Frequency Distributions
2.1 Part 1 - Frequency Distributions2.1 Part 1 - Frequency Distributions
2.1 Part 1 - Frequency Distributionsleblance
 

La actualidad más candente (20)

Construction of a frequency table
Construction of a frequency tableConstruction of a frequency table
Construction of a frequency table
 
2.1 frequency distributions, histograms, and related topics
2.1 frequency distributions, histograms, and related topics2.1 frequency distributions, histograms, and related topics
2.1 frequency distributions, histograms, and related topics
 
Chapter 2
Chapter 2Chapter 2
Chapter 2
 
Probability and statistics (frequency distributions)
Probability and statistics (frequency distributions)Probability and statistics (frequency distributions)
Probability and statistics (frequency distributions)
 
Frequency distribution
Frequency distributionFrequency distribution
Frequency distribution
 
Chapter 2 250110 083240
Chapter 2 250110 083240Chapter 2 250110 083240
Chapter 2 250110 083240
 
Excel tutorial for frequency distribution
Excel tutorial for frequency distributionExcel tutorial for frequency distribution
Excel tutorial for frequency distribution
 
Frequency Tables, Frequency Distributions, and Graphic Presentation
Frequency Tables, Frequency Distributions, and Graphic PresentationFrequency Tables, Frequency Distributions, and Graphic Presentation
Frequency Tables, Frequency Distributions, and Graphic Presentation
 
Frequency Distributions
Frequency DistributionsFrequency Distributions
Frequency Distributions
 
Report frequency distribution table
Report frequency distribution tableReport frequency distribution table
Report frequency distribution table
 
Cumulative Frequency
Cumulative FrequencyCumulative Frequency
Cumulative Frequency
 
frequency distribution
 frequency distribution frequency distribution
frequency distribution
 
Frequency distribution & graph
Frequency distribution & graphFrequency distribution & graph
Frequency distribution & graph
 
2.3 Histogram/Frequency Polygon/Ogives
2.3 Histogram/Frequency Polygon/Ogives2.3 Histogram/Frequency Polygon/Ogives
2.3 Histogram/Frequency Polygon/Ogives
 
Chapter 3: Prsentation of Data
Chapter 3: Prsentation of DataChapter 3: Prsentation of Data
Chapter 3: Prsentation of Data
 
Frequency Distribution
Frequency DistributionFrequency Distribution
Frequency Distribution
 
Statistics and probability lesson5
Statistics and probability lesson5Statistics and probability lesson5
Statistics and probability lesson5
 
Presentation of Data and Frequency Distribution
Presentation of Data and Frequency DistributionPresentation of Data and Frequency Distribution
Presentation of Data and Frequency Distribution
 
Freq & Histo
Freq & HistoFreq & Histo
Freq & Histo
 
2.1 Part 1 - Frequency Distributions
2.1 Part 1 - Frequency Distributions2.1 Part 1 - Frequency Distributions
2.1 Part 1 - Frequency Distributions
 

Destacado

Multiple Response Questions - Allowing for chance in authentic assessments
Multiple Response Questions - Allowing for chance in authentic assessmentsMultiple Response Questions - Allowing for chance in authentic assessments
Multiple Response Questions - Allowing for chance in authentic assessmentsMhairi Mcalpine
 
Writing up your results – apa style guidelines
Writing up your results – apa style guidelinesWriting up your results – apa style guidelines
Writing up your results – apa style guidelinesMarialena Kostouli
 
Statistical Analysis of Sony and Samsung
Statistical Analysis of Sony and SamsungStatistical Analysis of Sony and Samsung
Statistical Analysis of Sony and SamsungTanmay Gattani
 
Membuat tabel distribusi frekuensi data statistik di microsoft excel
Membuat tabel distribusi frekuensi data statistik di microsoft excelMembuat tabel distribusi frekuensi data statistik di microsoft excel
Membuat tabel distribusi frekuensi data statistik di microsoft excelNursida Sidho
 
Data Analysis with Excel & TEST4U
Data Analysis with Excel & TEST4UData Analysis with Excel & TEST4U
Data Analysis with Excel & TEST4Uinfolearn - TEST4U
 
Questionnaire Results and Analysis
Questionnaire Results and AnalysisQuestionnaire Results and Analysis
Questionnaire Results and Analysisantonia-roberts
 
Business Research Methods. data collection preparation and analysis
Business Research Methods. data collection preparation and analysisBusiness Research Methods. data collection preparation and analysis
Business Research Methods. data collection preparation and analysisAhsan Khan Eco (Superior College)
 
Organisation wide incentive plans
Organisation wide  incentive plansOrganisation wide  incentive plans
Organisation wide incentive plansUjjwal 'Shanu'
 
Analysis of questionnaire answers
Analysis of questionnaire answersAnalysis of questionnaire answers
Analysis of questionnaire answersSean Walters
 
Data analysis powerpoint
Data analysis powerpointData analysis powerpoint
Data analysis powerpointSarah Hallum
 
Data analysis powerpoint
Data analysis powerpointData analysis powerpoint
Data analysis powerpointjamiebrandon
 
Teaching Excel
Teaching ExcelTeaching Excel
Teaching Excelsam ran
 
How to enter and analyze questionnaire (survey) data in SPSS
How to enter and analyze questionnaire (survey) data in SPSSHow to enter and analyze questionnaire (survey) data in SPSS
How to enter and analyze questionnaire (survey) data in SPSSquantitative_specialists
 
Commonly Used Statistics in Survey Research
Commonly Used Statistics in Survey ResearchCommonly Used Statistics in Survey Research
Commonly Used Statistics in Survey ResearchPat Barlow
 

Destacado (19)

Surveys
SurveysSurveys
Surveys
 
Multiple Response Questions - Allowing for chance in authentic assessments
Multiple Response Questions - Allowing for chance in authentic assessmentsMultiple Response Questions - Allowing for chance in authentic assessments
Multiple Response Questions - Allowing for chance in authentic assessments
 
Writing up your results – apa style guidelines
Writing up your results – apa style guidelinesWriting up your results – apa style guidelines
Writing up your results – apa style guidelines
 
Statistical Analysis of Sony and Samsung
Statistical Analysis of Sony and SamsungStatistical Analysis of Sony and Samsung
Statistical Analysis of Sony and Samsung
 
Membuat tabel distribusi frekuensi data statistik di microsoft excel
Membuat tabel distribusi frekuensi data statistik di microsoft excelMembuat tabel distribusi frekuensi data statistik di microsoft excel
Membuat tabel distribusi frekuensi data statistik di microsoft excel
 
Histograms
HistogramsHistograms
Histograms
 
Data Analysis with Excel & TEST4U
Data Analysis with Excel & TEST4UData Analysis with Excel & TEST4U
Data Analysis with Excel & TEST4U
 
Questionnaire Results and Analysis
Questionnaire Results and AnalysisQuestionnaire Results and Analysis
Questionnaire Results and Analysis
 
Business Research Methods. data collection preparation and analysis
Business Research Methods. data collection preparation and analysisBusiness Research Methods. data collection preparation and analysis
Business Research Methods. data collection preparation and analysis
 
Organisation wide incentive plans
Organisation wide  incentive plansOrganisation wide  incentive plans
Organisation wide incentive plans
 
Analysis of questionnaire answers
Analysis of questionnaire answersAnalysis of questionnaire answers
Analysis of questionnaire answers
 
Type of Test
Type of TestType of Test
Type of Test
 
Data analysis powerpoint
Data analysis powerpointData analysis powerpoint
Data analysis powerpoint
 
Data analysis powerpoint
Data analysis powerpointData analysis powerpoint
Data analysis powerpoint
 
Teaching Excel
Teaching ExcelTeaching Excel
Teaching Excel
 
Data analysis using spss
Data analysis using spssData analysis using spss
Data analysis using spss
 
How to enter and analyze questionnaire (survey) data in SPSS
How to enter and analyze questionnaire (survey) data in SPSSHow to enter and analyze questionnaire (survey) data in SPSS
How to enter and analyze questionnaire (survey) data in SPSS
 
Commonly Used Statistics in Survey Research
Commonly Used Statistics in Survey ResearchCommonly Used Statistics in Survey Research
Commonly Used Statistics in Survey Research
 
Group incentive plans
Group incentive plansGroup incentive plans
Group incentive plans
 

Similar a Creating frequency distribution table, histograms and polygons using excel analysis toolpak

Creating frequency distribution tables and histograms using excel analysis to...
Creating frequency distribution tables and histograms using excel analysis to...Creating frequency distribution tables and histograms using excel analysis to...
Creating frequency distribution tables and histograms using excel analysis to...Sandra Nicks
 
Determining a Line of Best Fit Using a Graphing Calculator
Determining a Line of Best Fit Using a Graphing CalculatorDetermining a Line of Best Fit Using a Graphing Calculator
Determining a Line of Best Fit Using a Graphing Calculatoremilybriggs
 
Data AnalysisInstructions of Excel 2016By Yancy Chow.docx
Data AnalysisInstructions of Excel 2016By Yancy Chow.docxData AnalysisInstructions of Excel 2016By Yancy Chow.docx
Data AnalysisInstructions of Excel 2016By Yancy Chow.docxwhittemorelucilla
 
Chapter 02
Chapter 02Chapter 02
Chapter 02bmcfad01
 
MATH133 UNIT 2 Quadratic EquationsIndividual Project Assignment.docx
MATH133 UNIT 2 Quadratic EquationsIndividual Project Assignment.docxMATH133 UNIT 2 Quadratic EquationsIndividual Project Assignment.docx
MATH133 UNIT 2 Quadratic EquationsIndividual Project Assignment.docxandreecapon
 
Types of graphs
Types of graphsTypes of graphs
Types of graphsLALIT BIST
 
SPSS How to use Spss software
SPSS How to use Spss softwareSPSS How to use Spss software
SPSS How to use Spss softwareDebashis Baidya
 
111249-140817070204-phpapp02.pdf
111249-140817070204-phpapp02.pdf111249-140817070204-phpapp02.pdf
111249-140817070204-phpapp02.pdfBMmugal
 
Correlations and Scatterplots MS Excel Lesson 2 Grade 8.ppt
Correlations and Scatterplots MS Excel Lesson 2 Grade 8.pptCorrelations and Scatterplots MS Excel Lesson 2 Grade 8.ppt
Correlations and Scatterplots MS Excel Lesson 2 Grade 8.pptJoshuaCasas7
 
Teoria y problemas de tabla de frecuencias tf320 ccesa007
Teoria y problemas de tabla de frecuencias  tf320  ccesa007Teoria y problemas de tabla de frecuencias  tf320  ccesa007
Teoria y problemas de tabla de frecuencias tf320 ccesa007Demetrio Ccesa Rayme
 
Teoria y problemas de tabla de frecuencias tf320 ccesa007
Teoria y problemas de tabla de frecuencias  tf320  ccesa007Teoria y problemas de tabla de frecuencias  tf320  ccesa007
Teoria y problemas de tabla de frecuencias tf320 ccesa007Demetrio Ccesa Rayme
 
Lab 4 excel basics
Lab 4 excel basicsLab 4 excel basics
Lab 4 excel basicsAnuja Lad
 
PRESENTATION OF DATA.pptx
PRESENTATION OF DATA.pptxPRESENTATION OF DATA.pptx
PRESENTATION OF DATA.pptxajesh ps
 
SPSS PRESENTATION.PPT.pptx
SPSS PRESENTATION.PPT.pptxSPSS PRESENTATION.PPT.pptx
SPSS PRESENTATION.PPT.pptxBMmugal
 
Ogive slide share
Ogive slide shareOgive slide share
Ogive slide shareSreejayaPV
 
Ogives wps office [autosaved]
Ogives wps office [autosaved]Ogives wps office [autosaved]
Ogives wps office [autosaved]SreejayaPV
 

Similar a Creating frequency distribution table, histograms and polygons using excel analysis toolpak (20)

Creating frequency distribution tables and histograms using excel analysis to...
Creating frequency distribution tables and histograms using excel analysis to...Creating frequency distribution tables and histograms using excel analysis to...
Creating frequency distribution tables and histograms using excel analysis to...
 
Determining a Line of Best Fit Using a Graphing Calculator
Determining a Line of Best Fit Using a Graphing CalculatorDetermining a Line of Best Fit Using a Graphing Calculator
Determining a Line of Best Fit Using a Graphing Calculator
 
Data AnalysisInstructions of Excel 2016By Yancy Chow.docx
Data AnalysisInstructions of Excel 2016By Yancy Chow.docxData AnalysisInstructions of Excel 2016By Yancy Chow.docx
Data AnalysisInstructions of Excel 2016By Yancy Chow.docx
 
Chapter 02
Chapter 02Chapter 02
Chapter 02
 
Lab 4 Excel Basics.ppt
Lab 4 Excel Basics.pptLab 4 Excel Basics.ppt
Lab 4 Excel Basics.ppt
 
Lab 4 excel basics
Lab 4 excel basicsLab 4 excel basics
Lab 4 excel basics
 
MATH133 UNIT 2 Quadratic EquationsIndividual Project Assignment.docx
MATH133 UNIT 2 Quadratic EquationsIndividual Project Assignment.docxMATH133 UNIT 2 Quadratic EquationsIndividual Project Assignment.docx
MATH133 UNIT 2 Quadratic EquationsIndividual Project Assignment.docx
 
Types of graphs
Types of graphsTypes of graphs
Types of graphs
 
SPSS How to use Spss software
SPSS How to use Spss softwareSPSS How to use Spss software
SPSS How to use Spss software
 
111249-140817070204-phpapp02.pdf
111249-140817070204-phpapp02.pdf111249-140817070204-phpapp02.pdf
111249-140817070204-phpapp02.pdf
 
Statistics
StatisticsStatistics
Statistics
 
Correlations and Scatterplots MS Excel Lesson 2 Grade 8.ppt
Correlations and Scatterplots MS Excel Lesson 2 Grade 8.pptCorrelations and Scatterplots MS Excel Lesson 2 Grade 8.ppt
Correlations and Scatterplots MS Excel Lesson 2 Grade 8.ppt
 
Teoria y problemas de tabla de frecuencias tf320 ccesa007
Teoria y problemas de tabla de frecuencias  tf320  ccesa007Teoria y problemas de tabla de frecuencias  tf320  ccesa007
Teoria y problemas de tabla de frecuencias tf320 ccesa007
 
Teoria y problemas de tabla de frecuencias tf320 ccesa007
Teoria y problemas de tabla de frecuencias  tf320  ccesa007Teoria y problemas de tabla de frecuencias  tf320  ccesa007
Teoria y problemas de tabla de frecuencias tf320 ccesa007
 
Lab 4 excel basics
Lab 4 excel basicsLab 4 excel basics
Lab 4 excel basics
 
Lab 4 excel basics
Lab 4 excel basicsLab 4 excel basics
Lab 4 excel basics
 
PRESENTATION OF DATA.pptx
PRESENTATION OF DATA.pptxPRESENTATION OF DATA.pptx
PRESENTATION OF DATA.pptx
 
SPSS PRESENTATION.PPT.pptx
SPSS PRESENTATION.PPT.pptxSPSS PRESENTATION.PPT.pptx
SPSS PRESENTATION.PPT.pptx
 
Ogive slide share
Ogive slide shareOgive slide share
Ogive slide share
 
Ogives wps office [autosaved]
Ogives wps office [autosaved]Ogives wps office [autosaved]
Ogives wps office [autosaved]
 

Más de Sandra Nicks

Más de Sandra Nicks (20)

Newletter v 2.1
Newletter v 2.1Newletter v 2.1
Newletter v 2.1
 
Newletter v 2.1
Newletter v 2.1Newletter v 2.1
Newletter v 2.1
 
Night owl
Night owlNight owl
Night owl
 
Simple random sample using excel
Simple random sample using excelSimple random sample using excel
Simple random sample using excel
 
Chap015
Chap015Chap015
Chap015
 
Chap010
Chap010Chap010
Chap010
 
Chap009
Chap009Chap009
Chap009
 
Chap007
Chap007Chap007
Chap007
 
Finding areas for z using excel
Finding areas for z using excelFinding areas for z using excel
Finding areas for z using excel
 
Calculating binomial probabilities using excel
Calculating binomial probabilities using excelCalculating binomial probabilities using excel
Calculating binomial probabilities using excel
 
Chap008
Chap008Chap008
Chap008
 
Chap006
Chap006Chap006
Chap006
 
Chap004
Chap004Chap004
Chap004
 
Chap005
Chap005Chap005
Chap005
 
Chap003
Chap003Chap003
Chap003
 
Chap004
Chap004Chap004
Chap004
 
Chap002
Chap002Chap002
Chap002
 
Aron chpt 1 ed (1)
Aron chpt 1 ed (1)Aron chpt 1 ed (1)
Aron chpt 1 ed (1)
 
Aronchpt3correlation
Aronchpt3correlationAronchpt3correlation
Aronchpt3correlation
 
Calculating a correlation coefficient and scatter plot using excel
Calculating a correlation coefficient and scatter plot using excelCalculating a correlation coefficient and scatter plot using excel
Calculating a correlation coefficient and scatter plot using excel
 

Último

AI presentation and introduction - Retrieval Augmented Generation RAG 101
AI presentation and introduction - Retrieval Augmented Generation RAG 101AI presentation and introduction - Retrieval Augmented Generation RAG 101
AI presentation and introduction - Retrieval Augmented Generation RAG 101vincent683379
 
Easier, Faster, and More Powerful – Notes Document Properties Reimagined
Easier, Faster, and More Powerful – Notes Document Properties ReimaginedEasier, Faster, and More Powerful – Notes Document Properties Reimagined
Easier, Faster, and More Powerful – Notes Document Properties Reimaginedpanagenda
 
Intro in Product Management - Коротко про професію продакт менеджера
Intro in Product Management - Коротко про професію продакт менеджераIntro in Product Management - Коротко про професію продакт менеджера
Intro in Product Management - Коротко про професію продакт менеджераMark Opanasiuk
 
Extensible Python: Robustness through Addition - PyCon 2024
Extensible Python: Robustness through Addition - PyCon 2024Extensible Python: Robustness through Addition - PyCon 2024
Extensible Python: Robustness through Addition - PyCon 2024Patrick Viafore
 
1111 ChatGPT Prompts PDF Free Download - Prompts for ChatGPT
1111 ChatGPT Prompts PDF Free Download - Prompts for ChatGPT1111 ChatGPT Prompts PDF Free Download - Prompts for ChatGPT
1111 ChatGPT Prompts PDF Free Download - Prompts for ChatGPTiSEO AI
 
TopCryptoSupers 12thReport OrionX May2024
TopCryptoSupers 12thReport OrionX May2024TopCryptoSupers 12thReport OrionX May2024
TopCryptoSupers 12thReport OrionX May2024Stephen Perrenod
 
How we scaled to 80K users by doing nothing!.pdf
How we scaled to 80K users by doing nothing!.pdfHow we scaled to 80K users by doing nothing!.pdf
How we scaled to 80K users by doing nothing!.pdfSrushith Repakula
 
The Value of Certifying Products for FDO _ Paul at FIDO Alliance.pdf
The Value of Certifying Products for FDO _ Paul at FIDO Alliance.pdfThe Value of Certifying Products for FDO _ Paul at FIDO Alliance.pdf
The Value of Certifying Products for FDO _ Paul at FIDO Alliance.pdfFIDO Alliance
 
ASRock Industrial FDO Solutions in Action for Industrial Edge AI _ Kenny at A...
ASRock Industrial FDO Solutions in Action for Industrial Edge AI _ Kenny at A...ASRock Industrial FDO Solutions in Action for Industrial Edge AI _ Kenny at A...
ASRock Industrial FDO Solutions in Action for Industrial Edge AI _ Kenny at A...FIDO Alliance
 
IESVE for Early Stage Design and Planning
IESVE for Early Stage Design and PlanningIESVE for Early Stage Design and Planning
IESVE for Early Stage Design and PlanningIES VE
 
FDO for Camera, Sensor and Networking Device – Commercial Solutions from VinC...
FDO for Camera, Sensor and Networking Device – Commercial Solutions from VinC...FDO for Camera, Sensor and Networking Device – Commercial Solutions from VinC...
FDO for Camera, Sensor and Networking Device – Commercial Solutions from VinC...FIDO Alliance
 
Google I/O Extended 2024 Warsaw
Google I/O Extended 2024 WarsawGoogle I/O Extended 2024 Warsaw
Google I/O Extended 2024 WarsawGDSC PJATK
 
Oauth 2.0 Introduction and Flows with MuleSoft
Oauth 2.0 Introduction and Flows with MuleSoftOauth 2.0 Introduction and Flows with MuleSoft
Oauth 2.0 Introduction and Flows with MuleSoftshyamraj55
 
Structuring Teams and Portfolios for Success
Structuring Teams and Portfolios for SuccessStructuring Teams and Portfolios for Success
Structuring Teams and Portfolios for SuccessUXDXConf
 
Breaking Down the Flutterwave Scandal What You Need to Know.pdf
Breaking Down the Flutterwave Scandal What You Need to Know.pdfBreaking Down the Flutterwave Scandal What You Need to Know.pdf
Breaking Down the Flutterwave Scandal What You Need to Know.pdfUK Journal
 
Continuing Bonds Through AI: A Hermeneutic Reflection on Thanabots
Continuing Bonds Through AI: A Hermeneutic Reflection on ThanabotsContinuing Bonds Through AI: A Hermeneutic Reflection on Thanabots
Continuing Bonds Through AI: A Hermeneutic Reflection on ThanabotsLeah Henrickson
 
BT & Neo4j _ How Knowledge Graphs help BT deliver Digital Transformation.pptx
BT & Neo4j _ How Knowledge Graphs help BT deliver Digital Transformation.pptxBT & Neo4j _ How Knowledge Graphs help BT deliver Digital Transformation.pptx
BT & Neo4j _ How Knowledge Graphs help BT deliver Digital Transformation.pptxNeo4j
 
State of the Smart Building Startup Landscape 2024!
State of the Smart Building Startup Landscape 2024!State of the Smart Building Startup Landscape 2024!
State of the Smart Building Startup Landscape 2024!Memoori
 
TEST BANK For, Information Technology Project Management 9th Edition Kathy Sc...
TEST BANK For, Information Technology Project Management 9th Edition Kathy Sc...TEST BANK For, Information Technology Project Management 9th Edition Kathy Sc...
TEST BANK For, Information Technology Project Management 9th Edition Kathy Sc...marcuskenyatta275
 

Último (20)

AI presentation and introduction - Retrieval Augmented Generation RAG 101
AI presentation and introduction - Retrieval Augmented Generation RAG 101AI presentation and introduction - Retrieval Augmented Generation RAG 101
AI presentation and introduction - Retrieval Augmented Generation RAG 101
 
Easier, Faster, and More Powerful – Notes Document Properties Reimagined
Easier, Faster, and More Powerful – Notes Document Properties ReimaginedEasier, Faster, and More Powerful – Notes Document Properties Reimagined
Easier, Faster, and More Powerful – Notes Document Properties Reimagined
 
Overview of Hyperledger Foundation
Overview of Hyperledger FoundationOverview of Hyperledger Foundation
Overview of Hyperledger Foundation
 
Intro in Product Management - Коротко про професію продакт менеджера
Intro in Product Management - Коротко про професію продакт менеджераIntro in Product Management - Коротко про професію продакт менеджера
Intro in Product Management - Коротко про професію продакт менеджера
 
Extensible Python: Robustness through Addition - PyCon 2024
Extensible Python: Robustness through Addition - PyCon 2024Extensible Python: Robustness through Addition - PyCon 2024
Extensible Python: Robustness through Addition - PyCon 2024
 
1111 ChatGPT Prompts PDF Free Download - Prompts for ChatGPT
1111 ChatGPT Prompts PDF Free Download - Prompts for ChatGPT1111 ChatGPT Prompts PDF Free Download - Prompts for ChatGPT
1111 ChatGPT Prompts PDF Free Download - Prompts for ChatGPT
 
TopCryptoSupers 12thReport OrionX May2024
TopCryptoSupers 12thReport OrionX May2024TopCryptoSupers 12thReport OrionX May2024
TopCryptoSupers 12thReport OrionX May2024
 
How we scaled to 80K users by doing nothing!.pdf
How we scaled to 80K users by doing nothing!.pdfHow we scaled to 80K users by doing nothing!.pdf
How we scaled to 80K users by doing nothing!.pdf
 
The Value of Certifying Products for FDO _ Paul at FIDO Alliance.pdf
The Value of Certifying Products for FDO _ Paul at FIDO Alliance.pdfThe Value of Certifying Products for FDO _ Paul at FIDO Alliance.pdf
The Value of Certifying Products for FDO _ Paul at FIDO Alliance.pdf
 
ASRock Industrial FDO Solutions in Action for Industrial Edge AI _ Kenny at A...
ASRock Industrial FDO Solutions in Action for Industrial Edge AI _ Kenny at A...ASRock Industrial FDO Solutions in Action for Industrial Edge AI _ Kenny at A...
ASRock Industrial FDO Solutions in Action for Industrial Edge AI _ Kenny at A...
 
IESVE for Early Stage Design and Planning
IESVE for Early Stage Design and PlanningIESVE for Early Stage Design and Planning
IESVE for Early Stage Design and Planning
 
FDO for Camera, Sensor and Networking Device – Commercial Solutions from VinC...
FDO for Camera, Sensor and Networking Device – Commercial Solutions from VinC...FDO for Camera, Sensor and Networking Device – Commercial Solutions from VinC...
FDO for Camera, Sensor and Networking Device – Commercial Solutions from VinC...
 
Google I/O Extended 2024 Warsaw
Google I/O Extended 2024 WarsawGoogle I/O Extended 2024 Warsaw
Google I/O Extended 2024 Warsaw
 
Oauth 2.0 Introduction and Flows with MuleSoft
Oauth 2.0 Introduction and Flows with MuleSoftOauth 2.0 Introduction and Flows with MuleSoft
Oauth 2.0 Introduction and Flows with MuleSoft
 
Structuring Teams and Portfolios for Success
Structuring Teams and Portfolios for SuccessStructuring Teams and Portfolios for Success
Structuring Teams and Portfolios for Success
 
Breaking Down the Flutterwave Scandal What You Need to Know.pdf
Breaking Down the Flutterwave Scandal What You Need to Know.pdfBreaking Down the Flutterwave Scandal What You Need to Know.pdf
Breaking Down the Flutterwave Scandal What You Need to Know.pdf
 
Continuing Bonds Through AI: A Hermeneutic Reflection on Thanabots
Continuing Bonds Through AI: A Hermeneutic Reflection on ThanabotsContinuing Bonds Through AI: A Hermeneutic Reflection on Thanabots
Continuing Bonds Through AI: A Hermeneutic Reflection on Thanabots
 
BT & Neo4j _ How Knowledge Graphs help BT deliver Digital Transformation.pptx
BT & Neo4j _ How Knowledge Graphs help BT deliver Digital Transformation.pptxBT & Neo4j _ How Knowledge Graphs help BT deliver Digital Transformation.pptx
BT & Neo4j _ How Knowledge Graphs help BT deliver Digital Transformation.pptx
 
State of the Smart Building Startup Landscape 2024!
State of the Smart Building Startup Landscape 2024!State of the Smart Building Startup Landscape 2024!
State of the Smart Building Startup Landscape 2024!
 
TEST BANK For, Information Technology Project Management 9th Edition Kathy Sc...
TEST BANK For, Information Technology Project Management 9th Edition Kathy Sc...TEST BANK For, Information Technology Project Management 9th Edition Kathy Sc...
TEST BANK For, Information Technology Project Management 9th Edition Kathy Sc...
 

Creating frequency distribution table, histograms and polygons using excel analysis toolpak

  • 1. CREATING FREQUENCY DISTRIBUTION TABLES, HISTOGRAMS AND POLYGONS USING EXCEL ANALYSIS TOOLPAK Make sure that you have the Data Analysis TookPak loaded on your computer. If not, go to the document, How to Load Excel Analysis ToolPak on Your Computer on the Course Website (on Excel Instructions Page). We are going to create the frequency distribution table and the histogram from the example that begins on page 30 of your text.
  • 2. Download the Applewood_Chicago.xls file that you will find on the Data Files page of the course website. Once we have downloaded our data we need to determine the number of “classes” and the “interval” size for our frequency table. To determine the number of classes for our table we need to find the smallest number of classes that is k greater than the number of observations. The formula for determining the number of classes is 2 . In our y example there were 180 vehicles sold. We will use the x button on the calculator.
  • 3. Type the following sequence into the calculator: 2, , 7, = The 128 we obtain with k=7 is less than 180. If we try k=8 we obtain 256. This is the smallest number of classes that is greater than the observation of 180. The formula to determine the size of the class interval is ≥ where H = the largest value and L = the lowest value. The largest value is $3,292 and the lowest value is $294. $3,292 − $294 ≥ = $374.75 8 We will round up to the $400 for a more meaningful interval. Next we set up our intervals (remember the classes must not overlap) Classes $200 to $599 $600 to $999 $1000 to $1399 $1400 to $1799 $1800 to $2199 $2200 to $2599 $2600 to $2999 $3000 to $3399
  • 4. The next step is to set up our Bins (the upper value in each class) in our Excel sheet Now it’s time to create our frequency table and histogram for the profit variable. Click on Data in the toolbar and then click Data Analysis. Click Histogram and OK
  • 5. Click on the Input Range and highlight all the Profit data. Click on the Bin Range and then highlight the Bins you entered. Click on Output Range and click on cell I3. Make sure Chart Output is checked. Click OK.
  • 6. The following will appear. Both the frequency table and Histogram need some formatting. Replace the Bin values by typing the full class intervals. Add a title to the table and change “Bins” to “Profit”.
  • 7. HISTOGRAMS We need to remove the spaces between the classes in the Histogram. To reformat the Histogram, right click on the chart and click Format Data Series… Move the Gap Width to 0%. Right click on Bin and Frequency on the chart. Click Delete. Histogram 60 Frequency 40 20 0 Frequency Bin
  • 8. Finally, resize the chart by dragging on the corners. Your Histogram should look like this. FREQUENCY POLYGON We will use a different method to create a frequency polygon of our data. With a frequency polygon we need to have beginning and ending intervals that have no observations. We can copy our frequency distribution table and add an interval containing $0-399 and another containing $4000 and above to the new table.
  • 9. Next, highlight the new table and then go to Insert on the tool bar and click Line and the first option with markers. The following graph will appear. Right click on Series1 and click delete. Your graph should look like this.
  • 10. CUMULATIVE FREQUENCY POLYGON Click on Data in the toolbar and then click Data Analysis. Click Histogram and OK Click on the input range box and highlight the profit data. Click on the Bin Range box and highlight the bin data. Click on Output Range box and click on a blank cell. Make sure that Cumulative Percentage and Chart Output is checked.
  • 11. A Cumulative Frequency Distribution Table and a combined histogram and a cumulative polygon will appear. Reformat both the table and graph until they look like this.