
Recomendados
Recomendados
Más contenido relacionado
La actualidad más candente
La actualidad más candente (20)
Destacado
Destacado (20)
Similar a Multi sensor data fusion for change detection
Similar a Multi sensor data fusion for change detection (20)
Último
Último (20)
Multi sensor data fusion for change detection
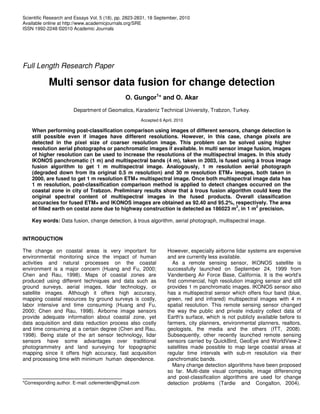
- 1. Scientific Research and Essays Vol. 5 (18), pp. 2823-2831, 18 September, 2010 Available online at http://www.academicjournals.org/SRE ISSN 1992-2248 ©2010 Academic Journals Full Length Research Paper Multi sensor data fusion for change detection O. Gungor1 * and O. Akar Department of Geomatics, Karadeniz Technical University, Trabzon, Turkey. Accepted 6 April, 2010 When performing post-classification comparison using images of different sensors, change detection is still possible even if images have different resolutions. However, in this case, change pixels are detected in the pixel size of coarser resolution image. This problem can be solved using higher resolution aerial photographs or panchromatic images if available. In multi sensor image fusion, images of higher resolution can be used to increase the resolutions of the multispectral images. In this study IKONOS panchromatic (1 m) and multispectral bands (4 m), taken in 2003, is fused using à trous image fusion algorithm to get 1 m multispectral image. Analogously, 1 m resolution aerial photograph (degraded down from its original 0.5 m resolution) and 30 m resolution ETM+ images, both taken in 2000, are fused to get 1 m resolution ETM+ multispectral image. Once both multispectral image data has 1 m resolution, post-classification comparison method is applied to detect changes occurred on the coastal zone in city of Trabzon. Preliminary results show that à trous fusion algorithm could keep the original spectral content of multispectral images in the fused products. Overall classification accuracies for fused ETM+ and IKONOS images are obtained as 92.40 and 95.2%, respectively. The area of filled earth on costal zone due to highway construction is detected as 186023 m 2 , in 1 m 2 precision. Key words: Data fusion, change detection, à trous algorithm, aerial photograph, multispectral image. INTRODUCTION The change on coastal areas is very important for environmental monitoring since the impact of human activities and natural processes on the coastal environment is a major concern (Huang and Fu, 2000; Chen and Rau, 1998). Maps of coastal zones are produced using different techniques and data such as ground surveys, aerial images, lidar technology, or satellite images. Although it offers high accuracy, mapping coastal resources by ground surveys is costly, labor intensive and time consuming (Huang and Fu, 2000; Chen and Rau, 1998). Airborne image sensors provide adequate information about coastal zone, yet data acquisition and data reduction process also costly and time consuming at a certain degree (Chen and Rau, 1998). Being state of the art sensor technology, lidar sensors have some advantages over traditional photogrammetry and land surveying for topographic mapping since it offers high accuracy, fast acquisition and processing time with minimum human dependence. *Corresponding author. E-mail: ozlemerden@gmail.com However, especially airborne lidar systems are expensive and are currently less available. As a remote sensing sensor, IKONOS satellite is successfully launched on September 24, 1999 from Vandenberg Air Force Base, California. It is the world’s first commercial, high resolution imaging sensor and still provides 1 m panchromatic images. IKONOS sensor also has a multispectral sensor which offers four band (blue, green, red and infrared) multispectral images with 4 m spatial resolution. This remote sensing sensor changed the way the public and private industry collect data of Earth's surface, which is not publicly available before to farmers, city planners, environmental planners, realtors, geologists, the media and the others (ITT, 2008). Subsequently, other recently launched remote sensing sensors carried by QuickBird, GeoEye and WorldView-2 satellites made possible to map large coastal areas at regular time intervals with sub-m resolution via their panchromatic bands. Many change detection algorithms have been proposed so far. Multi-date visual composite, image differencing and post-classification algorithms are used for change detection problems (Tardie and Congalton, 2004).
- 2. 2824 Sci. Res. Essays Aerial Photograph (0.5 m) ETM+ Multispectral Bands (30 m). Displayed using bands: 4,3,2 IKONOS Pachromatic Band (1 m) IKONOS Multispectral Bands (4 m). Displayed using bands: 4,3,2 Figure 1. Multi Sensor Data Used. Aerial photograph and ETM+ image obtained in 2000, and IKONOS panchromatic and multispectral images obtained in 2003. Furthermore, cross-correlation analysis, multi-date principal components analysis and RGB-NDVI color composite change detection is added to these methods (Civco et al., 2002). Additionally, techniques such as spectral mixture analysis, the Li–Strahler canopy model, Chi-square transformation, fuzzy sets, artificial neural networks and integration of multi-source data that have been used for change detection applications. All these algorithms give the best result if the remotely sensed data have the same spatial resolution on each date. However, it is not always possible to have same spatial resolution image data of the scene which is taken in different times. As indicated above, sensors offering high resolution images become publicly available after end of 1990s. Before this date, remote sensing sensors provided panchromatic and multispectral images that have several ms of spatial resolution, e.g. SPOT 4 (10 m panchromatic and 20 m multispectral bands), ASTER (15 m multispectral bands), IRS-3 (5 m panchromatic and 25 m multispectral bands) and Landsat ETM+ (15 m panchromatic and 30 m multispectral bands). Hence, if any possible change on Earth’s surface is intended to be monitored from about 20 years back till now by post- classification comparison approach using multispectral images, then images of coarse resolution sensors need to be compared with modern higher resolution satellite images of that scene, and this which will result in detecting the changes at the spatial resolution of older images. In other words, if 30 m resolution Landsat ETM+ image and 4 m resolution IKONOS images are used, the change areas found by comparing the classification results of these two images can be displayed at 30 m spatial resolution. This is a drawback which results in poor resolution display of the change areas and, it also cause wrong results in terms of the area of change regions. Aerial photographs can be a solution to the aforementioned resolution problem. Even more than 20 years before, aerial photographs could have around sub- m spatial resolution. Hence, an aerial photograph from past and a recent satellite image that both have sub-m resolution can be compared to detect any change on the scene with a sub-m resolution. However, most aerial photographs, particularly very old ones, offer monochromatic images, which do not provide spectral information. However, these aerial photographs can be considered as panchromatic images and fused with coarser resolution multispectral ones to transfer the spatial detail content of the aerial photographs into the multispectral images. This process will provide multispectral images having the same spatial resolution as the aerial photographs. In this study, the changes occurred on the costal zone of the city center of Trabzon due to a new major highway construction initiated along Black Sea cost in 2000 are evaluated. Two image sets acquired in 2000 and 2003 are used for post-classification comparison (Figure 1). First image set contains a 30 m resolution ETM+ multispectral image and a 0.5 m resolution aerial photograph taken in 2000. The second image set consists of IKONOS panchromatic and multispectral images (1 and 4 m resolution, respectively) taken in 2003. To tackle the different spatial resolution problem of both multispectral data, à trous image fusion algorithm is employed and their spatial resolutions are balanced at 1 m. IKONOS panchromatic band and multispectral bands are fused to make the spatial resolution of the multispectral image 1 m. To make the resolution of the ETM+ data 1 m, the aerial photograph is down sampled such that it has 1 m spatial resolution. Then ETM+ image is also degraded down from 30 - 32 m. Then, 1 m resolution aerial photograph and 32 m resolution ETM+ images are fused to get 1 m resolution ETM+ multispectral image. Once both multispectral image data has 1 m resolution, post classification comparison method is applied to detect changes occurred on the coastal zone in Trabzon at 1 m spatial resolution.
- 3. PRE-PROCESSING METHODS Four different images of four different sensors, having different spatial resolutions, are used to compare and detect changes on coastal zone occurred due to a major highway construction. Because all images used have different resolutions, they need to be pre-processed first for a precise post-classification comparison process. The pre-processing of the input images includes resampling, registration and image fusion. Resampling Post classification comparison approach is applicable if the images of different dates have the same pixel sizes i.e., same number of rows and columns. Since the images used in this study have different spatial resolutions, their pixel size varies. To make the spatial resolution of all input images 1 m, image fusion technique is used and most image fusion algorithms need resampling before fusion process since fusion essentially occurs when the involved images have the same pixel size. The nearest neighbor method is the simplest one among resampling methods such as bilinear, bicubic interpolation, 8-point or 10-point approximation to sinc function interpolation methods. In the nearest neighbor method, the new pixel value is assigned as the value of its nearest pixel, i.e., the original pixel values repeat. However, other aforementioned methods interpolate new pixel values using the contiguous pixels, resulting in color content change in the original image (Gungor and Shan, 2005). Since post-classification comparison method has been adopted as change detection algorithm, and keeping the original spectral properties of the multispectral image is crucial for a robust image classification result, the nearest neighbor method is used for resampling. Registration Change detection studies require that all spatial information be registered to a common coordinate frame so that each pixel location on both input images represents the same location on the ground (Macleod and Congalton, 1998; Kwarteng and Chavez, 1998; Tardie and Congalton, 2004). Image fusion also requires registration of the input images since different images of the same area are used together to combine separate images pixel by pixel. Registration can be done by geo-referencing the images to a map projection such as UTM (Universal Transverse Mercator). The most accurate way of doing this is georegistration, in which geometric relationship between the image and the ground is established using rigorous photogrammetric methods. See (Lee and Bethel, 2001) for more information about georegistration. Using polynomial transforms is another way of registering the input images. In this case, either ground control points are used to define transformation between image space and ground or one image (generally, the one that have better resolution) is taken as the reference and the other one is registered using this reference image. In this study, registration is needed for both image fusion and post classification comparison purposes. Landsat ETM+ image is registered by taking the aerial photograph, which is degraded down from 0.5 to 1 m resolution, as the reference for image fusion. Since IKONOS multispectral and panchromatic images are from the same sensor and taken at the same time, they are already co-registered and are directly used for fusion. Then, for accurate post classification comparison, fused ETM+ is registered by taking the fused IKONOS multispectral image as the reference. During registration refinement of fused multispectral images, common points on both images are selected carefully such that they produce an RMS error smaller than 0.5 pixels with respect to the pixel size of the fused multispectral images. Gungor and Akar 2825 Image fusion Image fusion methods are used to enhance the spatial resolution of the multispectral images with the help of higher spatial resolution panchromatic ones. A successful image fusion algorithm does not distort the spectral content of the multispectral image while increasing its spatial resolution. Gungor (2008) states that image fusion algorithms using wavelet-transform are successful in terms of keeping the color quality of the original multispectral images; however, their performances are not appealing as the results obtained from color-based (e.g., IHS and Brovey method) and statistical methods (e.g., PCA method) in terms of improving the spatial detail content. On the other hand, color-based and statistical methods are not successful as the wavelet-transform based methods in terms of color quality. This study uses multispectral images for image classification to detect the changes occurred in the scene. Therefore, keeping the color quality of the original multispectral images is crucial for precise change detection. For this reason, the à trous wavelet transform method, one of the most successful representative of the wavelet-transform based fusion methods, is chosen as the fusion method since it is fast and easy to implement, and reliable in terms of good color quality. The à trous algorithm is a non-orthogonal, dyadic, undecimated, DWT algorithm. It uses a low-pass filter associated to a scale function ) (t φ to obtain successive approximations of the original image and a high-pass filter to get three detail images (Aiazzi et al., 2002). Since decimation is not applied, transformed images have the same size as the original input images at every decomposition level. Starck and Murtagh (1994) proposes a practical implementation of the à trous wavelet transform algorithm by using the following 2- D 5 x 5 convolution mask 0 H . = 1 4 6 4 1 4 16 24 16 4 6 24 36 24 6 4 16 24 16 4 1 4 6 4 1 256 1 0 H To calculate the approximation image that contains the low frequency part of the original image, 0 H is up sampled before each decomposition level j by inserting 2j-1 -1 zeros between filter coefficients. This methodology keeps the size of the transformed images same as the original input images at every decomposition level since decimation is not applied (Wegner et al., 2006). The detail image w , which contains the high frequency part of the original image, is obtained as the difference of two successive approximation images. Image fusion using à trous algorithm is performed as follows: (1) Each multispectral band is resampled to the same size of the panchromatic image. (2) Panchromatic image is decomposed until its resolution equals to the resolution of original multispectral bands. (3) Summation of { j w } is calculated as = = J j j w W 1 to detect the spatial detail difference between panchromatic and multispectral image, where J is the total number of decomposition levels applied to the original panchromatic image. (4) W is added to each original multispectral band to construct fused bands. J is determined with respect to the resolutions of the panchromatic and the multispectral images. For example, for
- 4. 2826 Sci. Res. Essays Original ETM+ Multispectral (Bands: 4,3,2) Fused ETM+ Multispectral (Bands: 4,3,2) Original IKONOS Multispectral (Bands: 4,3,2) Fused IKONOS Multispectral (Bands: 4,3,2) Figure 2. Fusion results of IKONOS and ETM+ multispectral images. IKONOS panchromatic and multispectral images, two times wavelet decomposition to the panchromatic image is enough to make its resolution the same as the multispectral image since the resolution of the multispectral image is four times coarser than the panchromatic image. First, 4 m resolution IKONOS multispectral image is fused with its panchromatic band to get 1 m resolution IKONOS multispectral image. Secondly, the spatial resolution of aerial photograph is degraded down from 0.5 to 1 m using bi-cubic resampling method. The reason of using bi-cubic resampling method is the intention of minimum distortion to the spatial structure of the aerial photograph while decreasing its resolution. Analogously, ETM+ image is degraded down from 30 m to 32 m using nearest neighbor resampling method. The reason of using nearest neighbour method is the intention of not disturbing the spectral structure of ETM+ image to get good fusion result. Finally, 1 m resolution aerial photograph is fused with 32 m resolution ETM+ image to get 1 m resolution ETM+ multispectral image. Hence, spatial resolutions of two multispectral images, which will be used for image classification, made identical to be able to detect and display regions of change in 1 m spatial resolution. The original and fused IKONOS and ETM+ multispectral images are displayed in Figure 2. DETECTING REGIONS OF CHANGE Post-classification comparison method is used as the change detection algorithm, in which two images from different dates are separately classified and compared pixel by pixel to create a new change image (Tardie and Congalton, 2004; Mas, 1999). In this method, detected areas of change is displayed as a matrix containing “from X class to Y class” information, where X and Y indicates land cover classes on the scene. The advantage of post- classification comparison method is that the atmospheric effects, sensor and environmental differences between multi-temporal images are minimized and a complete matrix of change information is obtained as input images are classified independently (Lu et al., 2004). Accurate classification is very important for reliable change detection results as the final accuracy depends on the quality of the classified image of each date (Lu et al., 2004).Therefore, choosing the best classification algorithm, depending on the nature of the data, is crucial. Since the main motivation in this study is to detect the extent and the area of filled earth on costal zone, it is vital to perform precise classification such that sea and land classes are classified correctly. Especially in IKONOS multispectral image, wave patterns which causing shadow in the sea and sediments at the river mouth could result in misclassification of pixels as shadow and land in Black Sea, and misclassification affects the post classification comparison results negatively. Thus, input images are classified using Maximum Likelihood (ML), SAM (Spectral Angular Mapping), Fisher Linear Likelihood (FLL), and ECHO classifiers and best result is obtained from ECHO classifier. ECHO is a spatial- spectral classifier that incorporates not only spectral variations but spatial ones as well into the decision-making process. It is a classifier that first segments the scene into spectrally homogenous objects. Then, it performs a sample classification algorithm based upon a maximum likelihood object classification scheme in which
- 5. Gungor and Akar 2827 Figure 3. Flowchart of entire change detection approach. each object delineated would be classified based on the statistical properties of the pixels of the object (Landgrebe, 2003). Once fused ETM+ and IKONOS images are classified separately, then each pixel on both classified images are compared to create a change image at 1 m spatial resolution. The entire process from the beginning until change image is obtained is given in Figure 3. RESULTS AND DISCUSSION Once pre-processing methods are applied to all input images, preliminary classifications are performed on the fused ETM+ and IKONOS multispectral images using MultiSpec software created in Purdue University to carry out a post-classification analysis procedure. In IKONOS image, 7 classes (Water, Vegetation, Shadow, Bare Soil, Urban Fabric Type_1, Urban Fabric Type_2, and Urban Fabric Type_3) are determined to classify the scene. Especially in urban area there are so many different features which have different spectral reflectance values. As a matter of fact, the same type of feature such as building also may have different reflectance values due to the structure of the roof materials. For this reason, three different classes for urban fabric are determined, based on not their geometric structure but their colors. For example asphalt roads, concrete structures and some type of buildings are considered as urban Fabric Type_1. Since the purpose of the study is to distinguish the land from sea, this methodology of grouping and defining classes within land is reasonable and does not affect the final goal of the study. After final classification, all three urban related classes (Urban Fabric Type_1, 2 and 3) are merged as a single Urban Fabric class. As mentioned above, preliminary classification result of fused IKONOS image shows that some pixels in the Black Sea are misclassified such that shadows resulting from wave patterns are classified as Urban Fabric (See red ellipse in Figure 4c). Same problem also occurred within land. Some pixels belong to Shadow class are misclassified as Sea because of the spectral
- 6. 2828 Sci. Res. Essays Figure 4. The preliminary and final classification results of fused ETM+ and IKONOS multispectral images. resemblance of shadows in the land and the ones in the sea. This problem prevents accurate detection of change since these areas are considered as change (from land to sea or vise versa), although visual evaluation of input images contradicts and reveals no change. To reduce the number of misclassified pixels, majority filter is applied to
- 7. Gungor and Akar 2829 Black Sea Land Figure 5. Change image showing the differences between 2000 and 2003. Table 1. Accuracy assessment of fused ETM+ image classification result. Class name Reference totals Classified totals Number correct Producers accuracy (%) Users Accuracy (%) Sea 97 94 94 96.91 100.00 Sea2 15 18 15 100.00 83.33 River 4 5 4 100.00 80.00 Vegetation_1 7 9 7 100.00 77.78 Vegetation_2 26 27 24 92.31 88.89 Shadow 9 6 6 66.67 100.00 Urban Fabric Type_1 76 68 67 88.16 98.53 Urban Fabric Type_2 10 17 9 90.00 52.94 Bare soil 6 6 5 83.33 83.33 Totals 250 250 231 Overall Classification Accuracy 92.40% Overall Kappa Statistics 0.8987 the classified images. This approach substantially corrected the misclassification and produced more accurate results. Although all misclassified pixels, those classified as Urban Fabric in the sea, are corrected and converted to Sea (except some ships, encircled by a circle in Figure 4d), there are still some misclassified pixels, those classified as Sea in the land. To solve this problem, a Matlab code is created which segments the classified image and detects the polygons for Sea class in entire image. Then it converts the misclassified pixels from Sea to Urban Fabric, except the ones actually belong to the real Sea class for a more accurate post classification comparison. Analogously, the same classification procedure is performed for the fused ETM+ image; however, 9 classes are created (Sea, Sea_Type 2, River, Vegitation_Type 1, Vegitation_Type 2, Shadow, Urban Fabric Type_1, Urban Fabric Type_2, and Bare Soil). Similarly, two different classes for urban fabric are determined based on not their geometric structure but their colors. Additionally, after preliminary classification a new class is detected right in the intersection of land and the Sea. This class is also present in the main land but they are very rare. The pixels belong this class are dark blue and encircled by a red ellipse in Figure 4a. For this reason, these pixels are considered as a separate class Sea_Type2. A similar problem is also encountered for the pixels belong to River. These pixels, pale blue ones showed with a red circle in Figure 4a, are also exist in Sea. For this reason, three different classes for water are determined as Sea, Sea_Type2, and River. After final classification, all three classes are merged as one single Sea class (Figure 4b). Misclassified pixels, those classified as Sea within main land, are corrected using the same Matlab Code created for this purpose. Merge process is also done for two vegetation classes to produce one final Vegetation class. The preliminary and final classification results of fused ETM+ are given in Figure 4a and b. The preliminary and
- 8. 2830 Sci. Res. Essays Table 2. Accuracy assessment of fused IKONOS image classification result. Class name Reference totals Classified totals Number correct Producers accuracy (%) Users Accuracy (%) Sea 125 125 125 100.00 100.00 Vegetation 19 20 19 100.00 95.00 Shadow 7 7 7 100.00 100.00 Bare soil 31 37 29 93.55 78.38 Urban Fabric Type_1 39 34 33 84.62 97.06 Urban Fabric Type_2 10 9 8 80.00 88.89 Urban Fabric Type_3 19 18 17 89.47 94.44 Totals 250 250 238 Overall Classification Accuracy 95.20% Overall Kappa Statistics 0.9311 final classification results of fused IKONOS multispectral images are given in Figure 4c and d. The preliminary and final classification results of fused ETM+ and IKONOS multispectral images are given in Figure 4. In Erdas Imagine software 250 random points are generated for the accuracy assessment of the classification results. Hence, overall classification accuracies for fused ETM+ and fused IKONOS images are obtained as 92.40 and 95.2%, and Kappa statistics are 0.8987 and 0.9311, respectively as given in Tables 1 and 2. Accuracy assessment procedure is performed for preliminary classification results of fused ETM+ and IKONOS images (images A and C in Figure 4), not for the final classification results since majority filter and the created Matlab code are applied to them. Finally all classes in main land in both classification results of 2000 and 2003 merged and created one single Land class. This procedure produced only two classes (Land and Sea) in the final results. Hence these images are used for post-classification comparison procedure in ERDAS IMAGINE software. As the output, the change image showing the spatial alteration of Land and Sea is generated. The change image is illustrated in Figure 5. The pixels classified as Sea in fused ETM+ and Land in IKONOS image are shown in white in Figure 5 (Large blue ellipses). Hence, white pixels designate the filled earth and the area turned from Sea to Land during construction between 2000 and 2003. The total area of such region is computed as 186023 m 2 . Correspondingly, the area turned from Land to Sea between 2000 and 2003 is depicted in black. The total area of such change region is computed as 30542 m 2 . The linear black and white objects in Black Sea, which are showed in two small blue ellipses, are ships approaching to the port. These ships are detected as change (from Sea to Land) in the change image since one ship is not exist in the other image. The results shows that the extent and amount of earth fill is detected and displayed at 1 m spatial resolution. Such high level of spatial accuracy would not be reached if 30 m Landsat ETM+ image is directly used for change detection. Conclusion In this study, the change on costal zone of Trabzon is detected using image data of four different sensors, which offer different spatial resolutions. As expected, the amount and extent of earth fill on costal zone due to new high way construction is detected successfully at 1 m spatial resolution. It is also showed that the spatial information content of a monochromatic aerial photograph can be used to improve a coarse resolution of a multispectral satellite image. This could be done with the aid of à trous image fusion algorithm. This method successfully enhanced the spatial resolution of 30 m ETM+ image to 1 m using the aerial photograph, while keeping the original spectral content of ETM+ image. 92.40% and 95.2% overall classification accuracies of fused IKONOS and fused ETM+ images are the evidence of preserving the color content after fusion. Classifiers such as ML, SAM, and FLL misclassify wave patterns in IKONOS image as Urban Fabric. This problem may be misinterpreted by post-classification comparison and perceived as a change from Sea to Land. The amount of misclassified pixels is reduced using ECHO classifier, which combines the spectral information with spatial information. However, it is understood that only classification algorithms do not solve misclassification problem. For this reason, majority filter and created Matlab code are applied to preliminary classification results to get final classified images free from misclassified pixels both in Land and Sea. REFERENCES Aiazzi B, Alparone L, Baronti S, Garzelli A (2002). Context-Driven Fusion of High Spatial and Spectral Resolution Images Based on Oversampled Multiresolution Analysis. IEEE Trans. on Geosci. Remote Sens., 40(10): 2300-2312.
- 9. Chen LC, Rau JY (1998). Detection of shoreline changes for tideland areas using multi-temporal satellite images. Int. J. Remote Sens., 19(17): 3383-3397. Civco DL, Hurd JD, Wilson EH, Song M, Zhang Z (2002). A Comparison of Land Use and Land Cover Change Detection Methods. ASPRS- ACSM Annual Conference and FIG XXII Congress. Gungor O (2008). Multi Sensor Multi Resolution Image Fusion. PhD Dissertation, Purdue University, Indiana, USA. Gungor O, Shan J (2005). A statistical approach for multi-resolution image fusion. UPPECORA 16UP - Global Priorities in Land Remote Sensing, held at Sioux Falls Convention Center, Sioux Falls, SD, USA. Huang W, Fu B (2000). Remote Sensing for Coastal Area Management in China. Coastal Manage., 30: 271-276. ITT (2008). ITT Space System Division. <http://www.ssd.itt.com/heritage/ikonos.shtml> Last Accessed September 01, 2008 Kwarteng AY, Chavez PS (1998). Change detection study of Kuwait City and environs using multitemporal Landsat Thematic Mapper data. Int. J. Remote Sens., 19(9): 1651-1662. Landgrebe DA (2003). Signal Theory Methods in Multispectral Remote Gungor and Akar 2831 Sensing, John Wiley and Sons, Hoboken, New Jersey, USA. Lee C, Bethel J (2001). Georegistration of Airborne Hyperspectral Image Data. IEEE Trans. Geosci. Remote Sens., 39(7): 1347-1351. Lu D, Mausel P, Brondizio E, Moran E (2004). Change detection techniques. Int. J. Remote Sens., 25(12): 2365-2407. Macleod RD, Congalton RG (1998). A Quantitative Comparison of Change-Detection Algorithms for Monitoring Eelgrass from Remotely Sensed Data. Photogrammetric Eng. Remote Sens., 64(3): 207-216. Mas JF (1999). Monitoring land-cover changes: a comparison of change detection techniques. Int. J. Remote Sens., 20(1): 139-152. Starck JL, Murtagh F (1994). Image Restoration with Noise Suppression Using the Wavelet Transform. Astron. Astrophys, 288: 342-348. Tardie PS, Congalton RG (2004). A Change-detection Analysis: Using Remotely Sensed Data to Assess the Progression of Development in Essex County, Massachusetts from 1990 to 2001. http://www.aars- acrs.org/acrs/proceeding/ACRS2008/Papers/PS%203.21.pdf. Wegner FV, Both M, Fink RHA (2006). Automated Detection of Elementary Calcium Release Events Using the A Trous Wavelet Transform. Biophys. J., 90: 2151-2163.