SlideShare una empresa de Scribd logo
1 de 2
Descargar para leer sin conexión
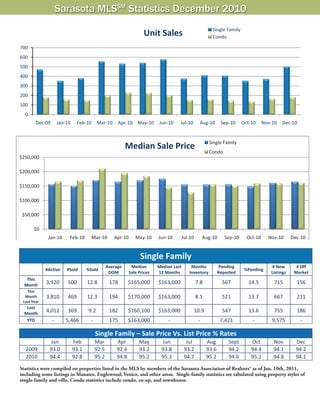
Sarasota MLSSM Statistics December 2010
                                                                                                                   Single Family
                                                                            Unit Sales                             Condo

700
600
500
400
300
200
100
  0
          Dec‐09         Jan‐10     Feb‐10       Mar‐10     Apr‐10 May‐10          Jun‐10     Jul‐10       Aug‐10        Sep‐10      Oct‐10     Nov‐10   Dec‐10


                                                                                                                 Single Family
                                                                Median Sale Price
                                                                                                                 Condo
$250,000

$200,000

$150,000

$100,000

 $50,000

          $0
                   Jan‐10       Feb‐10       Mar‐10       Apr‐10       May‐10      Jun‐10     Jul‐10           Aug‐10      Sep‐10      Oct‐10     Nov‐10       Dec‐10


                                                                          Single Family 
                                                     Average         Median        Median Last       Months             Pending                     # New        # Off 
               #Active         #Sold      %Sold                                                                                       %Pending 
                                                      DOM           Sale Prices    12 Months        Inventory           Reported                   Listings     Market 
   This 
  Month 
               3,920           500        12.8           178    $165,000           $163,000            7.8                567           14.5        715          156 
   This 
  Month        3,810           469        12.3           194    $170,000           $163,000            8.1                521           13.7        667          211 
 Last Year 
   Last 
  Month 
               4,012           369         9.2           182    $160,100           $163,000            10.9               547           13.6        755          186 
   YTD              ‐          5,466        ‐            175    $163,000                ‐                 ‐              7,421           ‐          9,575         ‐ 
                            
                                                 Single Family – Sale Price Vs. List Price % Rates
                   Jan            Feb            Mar        Apr          May         Jun           Jul          Aug          Sept        Oct        Nov          Dec 
  2009             93.0           93.1           92.5       92.4         93.2        93.8         93.2          93.6         94.2        94.4       94.1         94.2 
  2010             94.4           92.8           95.2       94.8         95.2        95.3         94.7          95.2         94.6        95.2       94.8         94.1 
                
Statistics were compiled on properties listed in the MLS by members of the Sarasota Association of Realtors® as of Jan. 10th, 2011,
including some listings in Manatee, Englewood, Venice, and other areas. Single-family statistics are tabulated using property styles of
single-family and villa. Condo statistics include condo, co-op, and townhouse.

                                                                                                          Source: Sarasota Association of Realtors®
Sarasota MLSSM Statistics December 2010
                                                                                                              Single Family
                                                                           Inventory                          Condo
5,000

4,000

3,000

2,000

1,000

      0
           Dec‐09          Jan‐10     Feb‐10 Mar‐10 Apr‐10 May‐10 Jun‐10                     Jul‐10    Aug‐10 Sep‐10            Oct‐10 Nov‐10 Dec‐10


                                                                                                               Single Family
                                                                        Pending Sales                          Condo
900
800
700
600
500
400
300
200
100
  0
          Dec‐09          Jan‐10     Feb‐10        Mar‐10   Apr‐10 May‐10          Jun‐10    Jul‐10     Aug‐10       Sep‐10     Oct‐10     Nov‐10   Dec‐10


                                                                                   Condo 
                                                       Average      Median Sale    Median Last    Months of         Pending                    # New       # Off 
                  #Active     #Sold        %Sold                                                                                 %Pending 
                                                        DOM           Prices       12 Months      Inventory         Reported                  Listings    Market 
   This 
  Month 
                  2,127        181          8.5         211         $160,000        $163,000          11.7            222          10.4         302        139 
   This 
  Month           2,210        179          8.1         202         $199,000        $190,000          12.3            218          9.9          233        232 
 Last Year 
   Last 
  Month 
                  2,195        165          7.5         230         $159,000        $165,000          13.3            217          9.9          297        169 
   YTD               ‐        2,137           ‐         207         $163,000            ‐              ‐             2,821           ‐         3,670         ‐ 
                      
                                                     Condo – Sale Price Vs. List Price % Rates
                   Jan             Feb         Mar          Apr          May        Jun        Jul          Aug         Sept        Oct        Nov        Dec 
  2009             91.0            90.2        90.4         92.2         90.1       91.4      92.1          92.4        91.5        92.4       92.3       93.1 
  2010             92.5            92.4        92.5         93.2         94.2       93.7      94.2          93.5        93.2        94.3       94.5       92.9 
               
Median sales price is the middle value, where half of the homes sold for more, and half sold for less. Listings sold were closed transac-
tions during the month. Pending sales are sales where an offer has been accepted during the month, but the sale has not yet closed. Even
though some pending sales never close, pending sales are an indicator of current buyer activity. DOM indicates the average number of
days that sold properties were on the market before a contract was executed.
                                                                                                            Sarasota Association of Realtors® MLS

Más contenido relacionado

La actualidad más candente

Sarasota Market Statistics - October
Sarasota Market Statistics - OctoberSarasota Market Statistics - October
Sarasota Market Statistics - OctoberSarasota Real Estate
 
Boulder Colorado Real Estate Statistics October 2011
Boulder Colorado Real Estate Statistics October 2011Boulder Colorado Real Estate Statistics October 2011
Boulder Colorado Real Estate Statistics October 2011Neil Kearney
 
Boulder County Real Estate Statistics February 2013
Boulder County Real Estate Statistics February 2013Boulder County Real Estate Statistics February 2013
Boulder County Real Estate Statistics February 2013Neil Kearney
 
Caterpillar Analyst Meeting
Caterpillar Analyst MeetingCaterpillar Analyst Meeting
Caterpillar Analyst Meetingfinance5
 
McKinney TX - June 2010 Market Report
McKinney TX - June 2010 Market ReportMcKinney TX - June 2010 Market Report
McKinney TX - June 2010 Market ReportValarie Littles
 

La actualidad más candente (18)

June2012 stats.3 8
June2012 stats.3 8June2012 stats.3 8
June2012 stats.3 8
 
Aug2012 stats 3_8
Aug2012 stats 3_8Aug2012 stats 3_8
Aug2012 stats 3_8
 
Sarasota Market Statistics - October
Sarasota Market Statistics - OctoberSarasota Market Statistics - October
Sarasota Market Statistics - October
 
Boulder Colorado Real Estate Statistics October 2011
Boulder Colorado Real Estate Statistics October 2011Boulder Colorado Real Estate Statistics October 2011
Boulder Colorado Real Estate Statistics October 2011
 
Feb2013 stats.3 8
Feb2013 stats.3 8Feb2013 stats.3 8
Feb2013 stats.3 8
 
Condos only metrics
Condos only metricsCondos only metrics
Condos only metrics
 
December 2009 Delaware County Sold Median Price
December 2009 Delaware County Sold Median PriceDecember 2009 Delaware County Sold Median Price
December 2009 Delaware County Sold Median Price
 
June 2010 Philadelphia County Basic Supply and Demand
June 2010 Philadelphia County Basic Supply and DemandJune 2010 Philadelphia County Basic Supply and Demand
June 2010 Philadelphia County Basic Supply and Demand
 
Sarasota Market Stats December
Sarasota Market Stats DecemberSarasota Market Stats December
Sarasota Market Stats December
 
March2013 stats.3 6
March2013 stats.3 6March2013 stats.3 6
March2013 stats.3 6
 
Bucks County Basic Supply And Demand
Bucks County Basic Supply And DemandBucks County Basic Supply And Demand
Bucks County Basic Supply And Demand
 
Boulder County Real Estate Statistics February 2013
Boulder County Real Estate Statistics February 2013Boulder County Real Estate Statistics February 2013
Boulder County Real Estate Statistics February 2013
 
Bucks County Basic Supply And Demand
Bucks County Basic Supply And DemandBucks County Basic Supply And Demand
Bucks County Basic Supply And Demand
 
Caterpillar Analyst Meeting
Caterpillar Analyst MeetingCaterpillar Analyst Meeting
Caterpillar Analyst Meeting
 
McKinney TX - June 2010 Market Report
McKinney TX - June 2010 Market ReportMcKinney TX - June 2010 Market Report
McKinney TX - June 2010 Market Report
 
Montgomery County Basic Supply And Demand
Montgomery County Basic Supply And DemandMontgomery County Basic Supply And Demand
Montgomery County Basic Supply And Demand
 
Bucks county basic supply and demand
Bucks county basic supply and demandBucks county basic supply and demand
Bucks county basic supply and demand
 
Plymouth Michigan Real Estate Statistics | May 2010
Plymouth Michigan Real Estate Statistics | May 2010Plymouth Michigan Real Estate Statistics | May 2010
Plymouth Michigan Real Estate Statistics | May 2010
 

Destacado

Monthly Newsletter 3/2013
Monthly Newsletter 3/2013Monthly Newsletter 3/2013
Monthly Newsletter 3/2013Latvijas Banka
 
Global Retail Report 2011
Global Retail Report 2011Global Retail Report 2011
Global Retail Report 2011yStats.com
 
窮富翁 On Social Enterprise
窮富翁 On Social Enterprise窮富翁 On Social Enterprise
窮富翁 On Social EnterpriseErwin Huang
 
Convergence of web-based applications, radio and cellular phone: some perspec...
Convergence of web-based applications, radio and cellular phone: some perspec...Convergence of web-based applications, radio and cellular phone: some perspec...
Convergence of web-based applications, radio and cellular phone: some perspec...IAALD Community
 
Verbal Branding Overview 2010
Verbal Branding Overview 2010Verbal Branding Overview 2010
Verbal Branding Overview 2010StephenMelanson
 
Optimized solutionfor image processing through mobile robots work
Optimized solutionfor image processing through mobile robots workOptimized solutionfor image processing through mobile robots work
Optimized solutionfor image processing through mobile robots workIAEME Publication
 
Brutopalk iii kvartal_2013_estonia_eng
Brutopalk iii kvartal_2013_estonia_engBrutopalk iii kvartal_2013_estonia_eng
Brutopalk iii kvartal_2013_estonia_engKadri Seeder
 
121210LEARNING BY DOING
121210LEARNING BY DOING121210LEARNING BY DOING
121210LEARNING BY DOINGYuichi Hirose
 
TH3.L10.4 - SOIL MOISTURE ACTIVE PASSIVE (SMAP) CALIBRATION AND VALIDATION P...
TH3.L10.4	 - SOIL MOISTURE ACTIVE PASSIVE (SMAP) CALIBRATION AND VALIDATION P...TH3.L10.4	 - SOIL MOISTURE ACTIVE PASSIVE (SMAP) CALIBRATION AND VALIDATION P...
TH3.L10.4 - SOIL MOISTURE ACTIVE PASSIVE (SMAP) CALIBRATION AND VALIDATION P...grssieee
 
Nicola Zingaretti a Rinnovabili.it: ecco le mie priorità ambientali
Nicola Zingaretti a Rinnovabili.it: ecco le mie priorità ambientaliNicola Zingaretti a Rinnovabili.it: ecco le mie priorità ambientali
Nicola Zingaretti a Rinnovabili.it: ecco le mie priorità ambientaliClaudio Ancillotti
 
Einladung: INSTANDHALTUNGSTAGE 2016!
Einladung: INSTANDHALTUNGSTAGE 2016!Einladung: INSTANDHALTUNGSTAGE 2016!
Einladung: INSTANDHALTUNGSTAGE 2016!MCP Deutschland GmbH
 
Final presentation
Final presentationFinal presentation
Final presentationJudeResearch
 
KBank CMB Seminar Khun Kitti 2012 04-19
KBank CMB Seminar  Khun Kitti  2012 04-19KBank CMB Seminar  Khun Kitti  2012 04-19
KBank CMB Seminar Khun Kitti 2012 04-19KBank Fx Dealing Room
 
April 28 may 2
April 28  may 2April 28  may 2
April 28 may 2tpoole
 
Safety QR Code sicurezza nel Pronto Intervento grazie ad un piccolo Codice QR
Safety QR Code sicurezza nel Pronto Intervento grazie ad un piccolo Codice QRSafety QR Code sicurezza nel Pronto Intervento grazie ad un piccolo Codice QR
Safety QR Code sicurezza nel Pronto Intervento grazie ad un piccolo Codice QRClaudio Ancillotti
 

Destacado (20)

Monthly Newsletter 3/2013
Monthly Newsletter 3/2013Monthly Newsletter 3/2013
Monthly Newsletter 3/2013
 
股东会决议范本
股东会决议范本股东会决议范本
股东会决议范本
 
Global Retail Report 2011
Global Retail Report 2011Global Retail Report 2011
Global Retail Report 2011
 
窮富翁 On Social Enterprise
窮富翁 On Social Enterprise窮富翁 On Social Enterprise
窮富翁 On Social Enterprise
 
Market Update 10.09
Market Update 10.09Market Update 10.09
Market Update 10.09
 
Convergence of web-based applications, radio and cellular phone: some perspec...
Convergence of web-based applications, radio and cellular phone: some perspec...Convergence of web-based applications, radio and cellular phone: some perspec...
Convergence of web-based applications, radio and cellular phone: some perspec...
 
Verbal Branding Overview 2010
Verbal Branding Overview 2010Verbal Branding Overview 2010
Verbal Branding Overview 2010
 
FRSA Flash 1 FEB 13
FRSA Flash 1 FEB 13FRSA Flash 1 FEB 13
FRSA Flash 1 FEB 13
 
Optimized solutionfor image processing through mobile robots work
Optimized solutionfor image processing through mobile robots workOptimized solutionfor image processing through mobile robots work
Optimized solutionfor image processing through mobile robots work
 
Android全端末入場!!
Android全端末入場!!Android全端末入場!!
Android全端末入場!!
 
Brutopalk iii kvartal_2013_estonia_eng
Brutopalk iii kvartal_2013_estonia_engBrutopalk iii kvartal_2013_estonia_eng
Brutopalk iii kvartal_2013_estonia_eng
 
121210LEARNING BY DOING
121210LEARNING BY DOING121210LEARNING BY DOING
121210LEARNING BY DOING
 
Pc Tech Bp 7 3.5
Pc Tech Bp 7 3.5Pc Tech Bp 7 3.5
Pc Tech Bp 7 3.5
 
TH3.L10.4 - SOIL MOISTURE ACTIVE PASSIVE (SMAP) CALIBRATION AND VALIDATION P...
TH3.L10.4	 - SOIL MOISTURE ACTIVE PASSIVE (SMAP) CALIBRATION AND VALIDATION P...TH3.L10.4	 - SOIL MOISTURE ACTIVE PASSIVE (SMAP) CALIBRATION AND VALIDATION P...
TH3.L10.4 - SOIL MOISTURE ACTIVE PASSIVE (SMAP) CALIBRATION AND VALIDATION P...
 
Nicola Zingaretti a Rinnovabili.it: ecco le mie priorità ambientali
Nicola Zingaretti a Rinnovabili.it: ecco le mie priorità ambientaliNicola Zingaretti a Rinnovabili.it: ecco le mie priorità ambientali
Nicola Zingaretti a Rinnovabili.it: ecco le mie priorità ambientali
 
Einladung: INSTANDHALTUNGSTAGE 2016!
Einladung: INSTANDHALTUNGSTAGE 2016!Einladung: INSTANDHALTUNGSTAGE 2016!
Einladung: INSTANDHALTUNGSTAGE 2016!
 
Final presentation
Final presentationFinal presentation
Final presentation
 
KBank CMB Seminar Khun Kitti 2012 04-19
KBank CMB Seminar  Khun Kitti  2012 04-19KBank CMB Seminar  Khun Kitti  2012 04-19
KBank CMB Seminar Khun Kitti 2012 04-19
 
April 28 may 2
April 28  may 2April 28  may 2
April 28 may 2
 
Safety QR Code sicurezza nel Pronto Intervento grazie ad un piccolo Codice QR
Safety QR Code sicurezza nel Pronto Intervento grazie ad un piccolo Codice QRSafety QR Code sicurezza nel Pronto Intervento grazie ad un piccolo Codice QR
Safety QR Code sicurezza nel Pronto Intervento grazie ad un piccolo Codice QR
 

Similar a Sarasota Housing Market Statistics for December 2010

Sarasota Market Statistics May 2012
Sarasota Market Statistics May 2012Sarasota Market Statistics May 2012
Sarasota Market Statistics May 2012Sarasota Real Estate
 
September 2012 Market Overview
September 2012 Market OverviewSeptember 2012 Market Overview
September 2012 Market OverviewGary Smith
 
Market report 0912
Market report 0912Market report 0912
Market report 0912Len Nevin
 
Sr mag mar2013stats13022194344.2-6
Sr mag mar2013stats13022194344.2-6Sr mag mar2013stats13022194344.2-6
Sr mag mar2013stats13022194344.2-6Sarasota Real Estate
 
Sales climb in February 2012; pending sales rise to 11-month high
Sales climb in February 2012; pending sales rise to 11-month highSales climb in February 2012; pending sales rise to 11-month high
Sales climb in February 2012; pending sales rise to 11-month highSarasota Real Estate
 
SAR Monthly Statistics Released for June 2011
SAR Monthly Statistics Released for June 2011SAR Monthly Statistics Released for June 2011
SAR Monthly Statistics Released for June 2011Sarasota Real Estate
 
Sarasota Market Stats - October 2010
Sarasota Market Stats - October 2010Sarasota Market Stats - October 2010
Sarasota Market Stats - October 2010Sarasota Real Estate
 
Gbar monthly-market-insights-report-november20
Gbar monthly-market-insights-report-november20Gbar monthly-market-insights-report-november20
Gbar monthly-market-insights-report-november20Joe Schutt
 
The woodlands home sales reports feb 2013
The woodlands home sales reports feb 2013The woodlands home sales reports feb 2013
The woodlands home sales reports feb 2013Priyanka Johri
 

Similar a Sarasota Housing Market Statistics for December 2010 (20)

SARStats-July2011
SARStats-July2011SARStats-July2011
SARStats-July2011
 
Sarasota Market stats for March
Sarasota Market stats for MarchSarasota Market stats for March
Sarasota Market stats for March
 
Sarasota Market Stats feb2012
Sarasota Market Stats feb2012Sarasota Market Stats feb2012
Sarasota Market Stats feb2012
 
Sarasota Market Statistics May 2012
Sarasota Market Statistics May 2012Sarasota Market Statistics May 2012
Sarasota Market Statistics May 2012
 
Phoenix AZ - Monthly Market Watch - September 2012
Phoenix AZ - Monthly Market Watch - September 2012Phoenix AZ - Monthly Market Watch - September 2012
Phoenix AZ - Monthly Market Watch - September 2012
 
September 2012 Market Overview
September 2012 Market OverviewSeptember 2012 Market Overview
September 2012 Market Overview
 
Market report 0912
Market report 0912Market report 0912
Market report 0912
 
Sr mag mar2013stats13022194344.2-6
Sr mag mar2013stats13022194344.2-6Sr mag mar2013stats13022194344.2-6
Sr mag mar2013stats13022194344.2-6
 
Sales climb in February 2012; pending sales rise to 11-month high
Sales climb in February 2012; pending sales rise to 11-month highSales climb in February 2012; pending sales rise to 11-month high
Sales climb in February 2012; pending sales rise to 11-month high
 
SAR Monthly Statistics Released for June 2011
SAR Monthly Statistics Released for June 2011SAR Monthly Statistics Released for June 2011
SAR Monthly Statistics Released for June 2011
 
Srmag june2011 stats
Srmag june2011 statsSrmag june2011 stats
Srmag june2011 stats
 
Sarasota Market Stats - October 2010
Sarasota Market Stats - October 2010Sarasota Market Stats - October 2010
Sarasota Market Stats - October 2010
 
Delaware County Sold Median Price
Delaware County Sold Median PriceDelaware County Sold Median Price
Delaware County Sold Median Price
 
May 2010 Delaware County Sold Median Price
May 2010 Delaware County Sold Median PriceMay 2010 Delaware County Sold Median Price
May 2010 Delaware County Sold Median Price
 
Plymouth Michigan Real Estate Statistics | November 2010
Plymouth Michigan Real Estate Statistics | November 2010Plymouth Michigan Real Estate Statistics | November 2010
Plymouth Michigan Real Estate Statistics | November 2010
 
Delaware county sold median price
Delaware county sold median priceDelaware county sold median price
Delaware county sold median price
 
Gbar monthly-market-insights-report-november20
Gbar monthly-market-insights-report-november20Gbar monthly-market-insights-report-november20
Gbar monthly-market-insights-report-november20
 
Plymouth Michigan Real Estate Statistics | March 2010
Plymouth Michigan Real Estate Statistics | March 2010Plymouth Michigan Real Estate Statistics | March 2010
Plymouth Michigan Real Estate Statistics | March 2010
 
2010 March Delaware County Sold Median Price Analysis
2010 March Delaware County Sold Median Price Analysis2010 March Delaware County Sold Median Price Analysis
2010 March Delaware County Sold Median Price Analysis
 
The woodlands home sales reports feb 2013
The woodlands home sales reports feb 2013The woodlands home sales reports feb 2013
The woodlands home sales reports feb 2013
 

Más de Sarasota Real Estate

Más de Sarasota Real Estate (7)

Sarasota Market Statistics July 2013
Sarasota Market Statistics July 2013Sarasota Market Statistics July 2013
Sarasota Market Statistics July 2013
 
Sr mag june2013stats.3-8
Sr mag june2013stats.3-8Sr mag june2013stats.3-8
Sr mag june2013stats.3-8
 
Sarasota Market Stats May
Sarasota Market Stats MaySarasota Market Stats May
Sarasota Market Stats May
 
Sar statsemail13052285100.2 7
Sar statsemail13052285100.2 7Sar statsemail13052285100.2 7
Sar statsemail13052285100.2 7
 
Buying a home in sarasota florida
Buying a home in sarasota floridaBuying a home in sarasota florida
Buying a home in sarasota florida
 
Home buyers guide
Home buyers guideHome buyers guide
Home buyers guide
 
Online Sarasota Visitors Guide
Online Sarasota Visitors GuideOnline Sarasota Visitors Guide
Online Sarasota Visitors Guide
 

Sarasota Housing Market Statistics for December 2010

  • 1. Sarasota MLSSM Statistics December 2010 Single Family Unit Sales Condo 700 600 500 400 300 200 100 0 Dec‐09 Jan‐10 Feb‐10 Mar‐10 Apr‐10 May‐10 Jun‐10 Jul‐10 Aug‐10 Sep‐10 Oct‐10 Nov‐10 Dec‐10 Single Family Median Sale Price Condo $250,000 $200,000 $150,000 $100,000 $50,000 $0 Jan‐10 Feb‐10 Mar‐10 Apr‐10 May‐10 Jun‐10 Jul‐10 Aug‐10 Sep‐10 Oct‐10 Nov‐10 Dec‐10 Single Family    Average  Median  Median Last  Months  Pending  # New  # Off  #Active  #Sold  %Sold  %Pending  DOM  Sale Prices  12 Months  Inventory  Reported  Listings  Market  This  Month  3,920  500  12.8  178  $165,000  $163,000  7.8  567  14.5  715  156  This  Month  3,810  469  12.3  194  $170,000  $163,000  8.1  521  13.7  667  211  Last Year  Last  Month  4,012  369  9.2  182  $160,100  $163,000  10.9  547  13.6  755  186  YTD  ‐  5,466  ‐  175  $163,000  ‐  ‐  7,421  ‐  9,575  ‐      Single Family – Sale Price Vs. List Price % Rates   Jan  Feb  Mar  Apr  May  Jun  Jul  Aug  Sept  Oct  Nov  Dec  2009  93.0  93.1  92.5  92.4  93.2  93.8  93.2  93.6  94.2  94.4  94.1  94.2  2010  94.4  92.8  95.2  94.8  95.2  95.3  94.7  95.2  94.6  95.2  94.8  94.1    Statistics were compiled on properties listed in the MLS by members of the Sarasota Association of Realtors® as of Jan. 10th, 2011, including some listings in Manatee, Englewood, Venice, and other areas. Single-family statistics are tabulated using property styles of single-family and villa. Condo statistics include condo, co-op, and townhouse. Source: Sarasota Association of Realtors®
  • 2. Sarasota MLSSM Statistics December 2010 Single Family Inventory Condo 5,000 4,000 3,000 2,000 1,000 0 Dec‐09 Jan‐10 Feb‐10 Mar‐10 Apr‐10 May‐10 Jun‐10 Jul‐10 Aug‐10 Sep‐10 Oct‐10 Nov‐10 Dec‐10 Single Family Pending Sales Condo 900 800 700 600 500 400 300 200 100 0 Dec‐09 Jan‐10 Feb‐10 Mar‐10 Apr‐10 May‐10 Jun‐10 Jul‐10 Aug‐10 Sep‐10 Oct‐10 Nov‐10 Dec‐10 Condo    Average  Median Sale  Median Last  Months of Pending  # New  # Off  #Active  #Sold  %Sold  %Pending  DOM  Prices  12 Months  Inventory  Reported  Listings  Market  This  Month  2,127  181  8.5  211  $160,000  $163,000  11.7  222  10.4  302  139  This  Month  2,210  179  8.1  202  $199,000  $190,000  12.3  218  9.9  233  232  Last Year  Last  Month  2,195  165  7.5  230  $159,000  $165,000  13.3  217  9.9  297  169  YTD  ‐  2,137  ‐  207  $163,000  ‐  ‐  2,821  ‐  3,670  ‐    Condo – Sale Price Vs. List Price % Rates   Jan  Feb  Mar  Apr  May  Jun  Jul  Aug  Sept  Oct  Nov  Dec  2009  91.0  90.2  90.4  92.2  90.1  91.4  92.1  92.4  91.5  92.4  92.3  93.1  2010  92.5  92.4  92.5  93.2  94.2  93.7  94.2  93.5  93.2  94.3  94.5  92.9    Median sales price is the middle value, where half of the homes sold for more, and half sold for less. Listings sold were closed transac- tions during the month. Pending sales are sales where an offer has been accepted during the month, but the sale has not yet closed. Even though some pending sales never close, pending sales are an indicator of current buyer activity. DOM indicates the average number of days that sold properties were on the market before a contract was executed. Sarasota Association of Realtors® MLS