8 steps pdca
•
2 recomendaciones•4,946 vistas

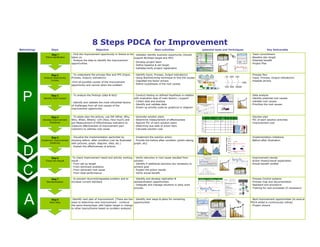
8 step PDCA summary - give brief definition of objective, main activities, potential tools & techniques, as well as key deliverables for each step.

Recomendados
Más contenido relacionado
La actualidad más candente
La actualidad más candente (20)
Destacado
Destacado (9)
Similar a 8 steps pdca
Similar a 8 steps pdca (20)
Más de Yudha Satya Perdana
Más de Yudha Satya Perdana (9)
Último
Último (20)
8 steps pdca
- 1. Methodology Steps Objective Main activities potential tools and Techniques Key Deliverable - Validate/ identify business opportunity (should support BU/Dept target and KPI) - Develop project team - Define baseline & set target - Validate/verify project registration - To understand the process flow and IPO (Input, Process, Output) indicator(s) -Find all possible causes of the improvement opportunity and narrow down the problem - To analyze the findings (data & fact) - Identify and validate the most influential factors of challenges from all root causes of the improvement opportunity - Conduct testing on defined hipothesis in-relation with evaluation step of main factors / support - Collect data and analyse - Identify and validate data - Drawn up priority scale by graphical or diagram - Data analysis - Identify potential root causes - Validate root causes - Prioritize the root causes - To easily plan the actions, use 5W (What, Why, Who, When, Where) +2H (How, How much) and put Measurement of Effectiveness indicators to measure effectiveness of improvement plan (solution) to address root cause - Generate solution plans - Determine measurement of effectiveness - Appoint PIC of each solution plans - Determine due date of action item - Calculate solution cost - Solution plan - PIC of each solution activities - Improvement cost 8 Steps PDCA for Improvement - Find the improvement opportunity or theme to be taken on - Analyze the data to identify the improvement opportunities - Team commitment - Baseline dan target - Potential benefit - Project Plan - Identify Input, Process, Output indicator(s) - Using Brainstorming technique to find the causes - Classified the factor drivers - Define hypotheses of the root causes - Process flow - Input, Process, Output indicator(s) - Possible drivers Step 1 Theme Identification I Raisin g funds fo r projects, a cquisit ion , WCa nd re- fin 1 Raise fun ding for projects, acqu isition, working capital and r e-financing. (5%) $M 75.71% 28 530 700 25 0 L MA$ M 97.02% 45 6.7 573 .1 590.7 643.7 FCF $M 57.86% 24 8.9 293 .5 507.3 358.139 Pulp (t ) 94.84% 1,825 ,470 1,925,2 81 2,030,00 0 2 ,020,000 Paper ( t) 104.65 % 347 ,539 366,2 84 350,00 0 400,000 Pulp $/t 101.47 % 199 197 199.9 19 1 Pap er $/t 485 pls he lp 415.2 TPL to calculate Pulp% 100.00 % Overall 78% 80% Over all 80% 80%. Still re le va nt for 2 006 KPI? Pap er% 100.00 % Overall 92% 90% Over all 90% 90%. Still re le va nt for 2 006 KPI? Pulp $/t 99.78% 440 464 465 475. Still relevant for KPI 2006? Pap er $/t 100.13 % 750 761 760 73 0 MHW P+ % 101.09 % 91% 93% 92% 95% ACC P+% 101.02 % 97% 99% 98% 98% I. Impr ove org anisation quality by creating Reten tio n rate o f key person nel ( manage rs and ab ove) for A*, A, &B to be % 97.98% 97% 97% >99% >99% 8 Successors ar e identified a nd read yf or 30 %of sup erintende nts and ab ove po sition by the end o f Q4 (In donesia). ( 10%) % 100.00% Not Available 30% 30% id entified & rea dy 30% 9 Utiliza tion of Kerinci as lear ning grou nd for oth er ope ration by Q4 b yh avin g 20 China em ployees that h ave acquired needed skills in targe tted are as. (10%) #o f China em ployees Not Available FL/ TA to advise 20 2 0 200 6 Bu dg et2 005 Approx Im prove over all on-time delive ry to pulp an d paper customer s. (5%) Benchma rk Aca cia 's pr ice and qua lity to tha t of Aracruz/Eucalytus.(10 %) Unit 2 004 Actu al Org anizat ion al L earn ing ( 40%) 7 II Developmen t of technical, ma nagerial, and leade rship capabilities In ternal Bus iness Proce ss ( 20%) I. Continuous improve ment of quality 6 Achieve tar getted pu lp P+ g rade qu ality fo r MHW and Acacia (10%) Cus tomer ( 20%) I. Impr ove image with customer s, society & employees b yb etter environm ental and social perfo rmance. 4 II. Price stability throug h global positioning 5 Fin ancia l ( 20%) II. Sustainable and improving cash flow gener ation 2 Achieve tar getted LM Aand net fr ee cash flow. ( 10%) F CF here is st ill III. Continuou s improve ment of vo lu me and cost 3 Achieve tar getted pu lp production vo lu me with tar getted d eliver ed cash cost, ach ieve targette d paper produ ctio n volum e with targett ed delivered ca sh cost. ( 5%) 20 05 Budg et % (2005 Appr ox vs 2005 Tar get) Quad ran t Crit ical Succe ss Fa ctors No. KPI Invoiced pr ice (MHW + ACC) Invoiced Invoiced Invoiced Invoiced price (MH W + A C C) I nvoice d price ( MH W + A CC ) Dep artme nt: Pro jec tT yp e: T as k F orc e /SGA Pro jec tRela te d: Q/C/D/S/M Pro jec tStart Date: ( to bef ill edbyB CI Dept. ) Ap p rov als /Co ns en ts: Na me Sig n Te am Me mbe r1 Te am Me mbe r2 Te am Me mbe r3 Te am Me mbe r4 Te am Me mbe r5 FO RM BC I - 0 04 R eg . N o: In i ti a t iv e: Bu si n es s U ni t : Pro j ec t T it l e: D at e: CONTIN UOU S IMPROVE MENT - P ROJEC T REGISTR ATION Wh at is th e c urre nt pe rf orm an ce m et ri c as b as el i ne ( e . g: C os t, V ol u me, Le ad t i me , Ma t eri al us ag e, et c) ? S t at e t h e p eri od . Pro j ec t D es cri p ti o n ( I mp rov eme nt S ta t em en t) : S ta t e t he im pro ve men t t h at yo u w a nt t o ac hi e ve w i t h t h is p ro je ct . Ho w do es th i s p roj ec t re la t e t o yo u rb u si ne ss u ni t ob j ec ti v e or b al an ce d sc ore ca rd? Co mp l et i on Da t e: Pro je ctL ea de r S ig n CI Spon so r/ B.U.He ad Pro j ec t L ea de r: Ho w mu ch d o y ou pro po se th at yo u c an s av e i n U S $ by s uc ce ss f ul l y ex ecu t i ng t h i s pro j ec t? P l ea se p ro vi de t h e s up po rt in g e qu at i on / fo rmu l a an d cal c ul at i o ns . C ho o se t h e t yp e of sa vi n g w i t h reg ard t o bo t t om l i ne : D i rec t S a vi ng / I nd i rec t S av in g / I nt an g ib l e Pro j ec t O b je ct i ve s: W h at is y ou r pro po se d i mp rov em en t t arg e t ? ( e .g : % co st red uc t io n, % pro d uc t io n v ol um e, % le ad ti me red uc ti o n, % ma te ri al s u sag e red uc t io n, et c ). Wh at ex te rna l s up p ort or t rai n in g w i l l t h e t ea m ne ed ? Ho w mu ch i s t h e ex pe ns e ( b ud ge t ) re qu ire d ? ( if ap p li ca bl e ) Ack no wl ed ge d by (F i nan ce & Acco un ti ng De pa rtme nt) N am e CICh amp io n /De pu ty CICoo rdi na to r Step 2 Analyze Opportunity Drivers MAN MACHINE ENVIRONEMENTMATERIALMETHOD MONEY PROBLEM FORM BCI - 002 Project Name: Project Leader: Initiatives: Wk1 Wk2 Wk3 Wk4 Wk5 Wk6 Wk7 . . Wk20 Wk21 Wk22 Wk23 Wk24 Step 1 Step 2 Step 3 Step 4 D Step 5 C Step 6 Step 7 Step 8 Remarks CONTINUOUS IMPROVEMENT - PROJECT PLAN A P Time Based (Daily, Weekly or Monthly) 8 Steps CLO2 Process Flow ClO2 Plant 1. ClO2 Quantity 2. ClO2 Quality 1. Man 2. Machine 3. Material 4. Method 5. Environment Input Process Output Chlorate Electrolyzer Chlorate Chiller Chlorat e Cooler Chlorate Filter HCL Unit ClO2 Generator ClO2 Absorber AC Power Transformer Rectifier Chiller Unit ClO2 Storage HCl Storage StrongCl2 Purified Salt Chlorate Electrolyzer Chlorate Chiller Chlorat e Cooler Chlorate Filter HCL Unit ClO2 Generator ClO2 Absorber AC Power Transformer Rectifier Chiller Unit ClO2 Storage HCl Storage StrongCl2 Purified Salt Decompose occurred here ! Bleaching CLO2 Process Flow ClO2 Plant 1. ClO2 Quantity 2. ClO2 Quality 1. Man 2. Machine 3. Material 4. Method 5. Environment Input Process Output ClO2 Plant 1. ClO2 Quantity 2. ClO2 Quality 1. Man 2. Machine 3. Material 4. Method 5. Environment Input Process Output Chlorate Electrolyzer Chlorate Chiller Chlorat e Cooler Chlorate Filter HCL Unit ClO2 Generator ClO2 Absorber AC Power Transformer Rectifier Chiller Unit ClO2 Storage HCl Storage StrongCl2 Purified Salt Chlorate Electrolyzer Chlorate Chiller Chlorat e Cooler Chlorate Filter HCL Unit ClO2 Generator ClO2 Absorber AC Power Transformer Rectifier Chiller Unit ClO2 Storage HCl Storage StrongCl2 Purified Salt Decompose occurred here ! Chlorate Electrolyzer Chlorate Chiller Chlorat e Cooler Chlorate Filter HCL Unit ClO2 Generator ClO2 Absorber AC Power Transformer Rectifier Chiller Unit ClO2 Storage HCl Storage StrongCl2 Purified Salt Chlorate Electrolyzer Chlorate Chiller Chlorat e Cooler Chlorate Filter HCL Unit ClO2 Generator ClO2 Absorber AC Power Transformer Rectifier Chiller Unit ClO2 Storage HCl Storage StrongCl2 Purified Salt Decompose occurred here ! Bleaching Step 3 Identify Root Causes Salt formation in compartment, decomposition will more frequently occur Salt formation in compartment, decomposition will more frequently occur Histogram Liquor Quality 0 3 6 9 12 15 18 21 24 43.4 - 46.5 46.5 - 49.6 49.6 - 52.7 52.7 - 55.8 55.4 - 58.5 58.4 - 61.5 61.4 - 64.5 64.4 - 67.5 67.4 - 70.5 70.4 - 73.6 Frekuensi Histogram Liquor Quality 0 3 6 9 12 15 18 21 24 43.4 - 46.5 46.5 - 49.6 49.6 - 52.7 52.7 - 55.8 55.4 - 58.5 58.4 - 61.5 61.4 - 64.5 64.4 - 67.5 67.4 - 70.5 70.4 - 73.6 Frekuensi Correlation Chart of ClO2 Strength to Decomposition 0 4 8 12 16 20 0 20 40 60 80 100 ClO2 Strength Decompostion Step 4 Develop Improvement Initiatives What Why How MoE Who When Where How much Factors Causes Solution / Improvement Plan Measurement of Effectiveness PIC Due Date Location Cost Method (Bad Liquor Quality) Steam bundle at Compartment Replace steam bundle with new material Quantity leaking steam tube Budi H Feb, 2006 Gen 1, 2 Machine Man Material Environtment P - to prevent recurrent/repeated problem and to increase current standard - Identify and develop replication & standardization opportunities - Integrate and manage solutions in daily work process - Process Control systems - Process map and documentation - Standard and procedure - Training for new processes (if necessary) -Identify next plan of improvement. (There are two ways to determine next improvement : continue the same theme/topic with higher target or change to other topics/theme based on problem analysis) - Identify next steps & plans for remaining opportunities - Next improvement opportunities (to ensure PDCA wheel is continuously rolling) - Project closure - Visualize the implementation aactivities by showing before -after condition (can be illustrated with pictures, graph, diagram, data, etc.) - Explain the effectiveness of actions. - Implement the solution action - Provide the before-after condition (photo taking, graph, etc) - Implementation milestone - Before-after illustration -To check improvement result and activity working result : - From set up target - From dominant problems - From dominant root cause - From total performance - Verify reduction in root cause resulted from solution - Identify if additional solutions are necessary to achieve goal - Explain the action results - Verify actual benefit - Improvement results - Action impact/result explanation - Actual benefit verified Step 5 Implement Improvement Intiatives Before After Leaking steam tube bundles Action Result Installed new steam bundles Step 6 Check the Result Decomposition Frequency 0 2 4 6 8 10 12 14 16 Freq. 3 9 15 6 10 6 9 0 0 0 1 2 2 3 0 Jul-0 5 Aug- 05 Sep- 0 5 Oct- 0 5 Nov- 05 De c- 05 Ja n- 06 Feb- 06 Mar- 0 6 Apr - 0 6 May- 06 Jun- 06 Jul-06 Aug- 06 Sep- 06 Implementation Start Freq 0 10 20 30 N=100 74.5 79.5 8 4.5 8 9.5 94.5 99.5 104.5 109.5 114.5 119.5 124.5 = X = 101 UCL LCL Time CL Step 7 Standardization Step 8 Next Step UCL LCL Time CL Improvement Action Standardization Remark 1. Steam bundle at Compartment SOP: RPL - CM - 056 - PR Preventive maintenance of Steam Bundle See Appendix A 2. 3. SOPContinuous Im prove ment Projec t(AGRC/BCI-00 2-PR) SubmissionD ate: Project Completion Date: TeamM ember 6: TeamM ember 7: TeamM ember 8: TeamM ember 9: Team Member 10: Re as on : CI -C HAMPION Name : ________________ ________________ ________________ ________________ Review co mmen t: BCID Name _________________ Sign/ Date ________________ ITEM SC ORE 1.Res ults (40Points) 20 30 40 2. Ac tivity Mgmt 30 (50points) 50 5 10 Reward N ote: Only thoseprojectsw hichresultscannot be calculated (does not have direct& indirectnet savings), resultswillbe measured based onImprovement against the baseline. Project declare completed following this condition : CI - SPON SOR Name : Sign/Date :Sign/Date : Calendar of Events established Regular review meetings take place& minutes produced Total Score Scoring byCI Champion C IPR OJECT Above25% - 50% ofbaseline Above50% 8-stepPDCA Report&CI Project PlanCompleted NetSav ing(Direc t& Indirect) AboveUS$1Million Abov e3% - 25% of bas eline CONTINUOUS IMPROVEMENT -PROJECT COMPLETION AND SCORING FORM TeamMember 5: BusinessUnit: ProjectTitle: TeamMember 1: ProjectType: 3.ReviewM gmt (10 Points) Annualiz edNetSav ings; (Ac tualresult) TeamMember 2: TeamMember 3: COMPULSORY SUBMIT TED DOCUMENT PROJECT COMPLETIONSTATUS Project completedontime(within ±1monthfrom completionsc hedule) Improv ement (% ofbas eline) CI Champion and CI Sponsor decisions for Motivational Incentiveamount paidare final ProjectLeader: Abov eUS$ 10k toUS$ 100k Above US$100k to US$1,000k AIMSM OT IVATIONAL REWARD SCORING (CI PROJ ECT) TeamMember 4: SAP ID GRAD E SAP ID GR ADE P roject Registr at ion 8 Steps PDC A Report Other supportingdocument (SOP, Minutesof Meeting, etc) SGA TASK FORCE Project is achieved the tar get, and the result is sustain on 3-months consecutive Project is declare "complet ed" Ver if ied Need revision Histogram Liquor Quality 0 3 6 9 12 15 18 21 24 43.4 - 4 6.5 46.5 - 49.6 49.6 - 5 2.7 52.7 - 55.8 55.4 - 5 8.5 58.4 - 61.5 6 1.4 - 64 .5 64 .4 - 67 .5 67.4 - 70.5 70.4 - 73.6 Frekuensi Histogram Liquor Quality 0 3 6 9 12 15 18 21 24 43.4 - 4 6.5 46.5 - 49.6 49.6 - 5 2.7 52.7 - 55.8 55.4 - 5 8.5 58.4 - 61.5 6 1.4 - 64 .5 64 .4 - 67 .5 67.4 - 70.5 70.4 - 73.6 Frekuensi D C A