![sources that can produce 100 to 300% of
present world power consumption without
greenhouse emissions do not exist operation-
ally or as pilot plants.
Can we produce enough emission-free
power in time? Here we assess the potential
of a broad range of technologies aimed at
meeting this goal.
Improving Efficiency
Efficiency is the ratio of usable energy output
to energy input. Primary energy in metastable
chemical and nuclear bonds includes fossil
fuels, fission fuels, and fusion fuels. “Renew-
ables” are primary energy in natural fluxes
(solar photons, wind, water, and heat flows).
Energy conversion always involves dissipa-
tive losses, losses that in many cases engi-
neers have already expended considerable ef-
fort to reduce. Opportunities still exist to
improve efficiency in power generation and
end-use sectors: transportation, manufactur-
ing, electricity, and (indoor) climate condi-
tioning (13).
The efficiencies of mature technologies
are well characterized (14, 15). Most efficient
are large electric generators (98 to 99% effi-
cient) and motors (90 to 97%). These are
followed by rotating heat engines that are
limited by the second law of thermodynam-
ics: gas and steam turbines (35 to 50%) and
diesel (30 to 35%) and internal combustion
(15 to 25%) engines. Electrolyte and elec-
trode materials and catalysts limit electro-
chemical fuel cells (50 to 55% now; 70%
eventually). Fuel cells may replace heat en-
gines but will likely run on hydrogen. A
seamless transition would use H2 extracted
from gasoline or methanol in reformers (75 to
80%). Renewable energy converters include
photovoltaic (PV) cells (commercial arrays,
about 15 to 20%; theoretical peak for single
bandgap crystalline cells, Ϸ24%; higher for
multiband cells, lower for more cost-effective
amorphous thin films) and wind turbines
(commercial units, about 30 to 40%; theoret-
ical “Betz limit,” Ϸ59%). High-pressure so-
dium vapor (15 to 20%), fluorescent (10 to
12%), and incandescent (2 to 5%) illumina-
tion generate more heat than light. Photosyn-
thesis has a very low sunlight-to-chemical
energy efficiency, limited by chlorophyll ab-
sorption bands (most productive ecosystems
are about 1 to 2% efficient; theoretical peak
independent of cell or ecosystem is Ϸ8%).
How much can energy efficiency im-
prove? In a given technology class, efficiency
normally starts low, grows for decades to
centuries, and levels off at some fraction of
its theoretical peak (16). It took 300 years to
develop fuel cells from 1%-efficient steam
engines. The earliest gas turbines could bare-
ly turn their compressors. The development
of fusion could be similar: The best experi-
ments are close to balancing power to ignite
the plasma; power is carried off by fusion-
generated neutrons, but no net power output
has occurred yet. Fossil and nuclear fuels are
much closer to their limits (Figs. 1A and 4A).
Steam-cycle efficiencies (39 to 50%, includ-
ing combined cycles and cogeneration) and
overall primary energy–to-electricity effi-
ciency (30 to 36%, including transmission
losses) yield the nominal thermal-to-electric
power conversion: 3 kW (thermal) Ϸ 1 kWe
(electrical). Impressive reductions in waste
heat have been accomplished with compact
fluorescents, low emissivity windows, and
cogeneration (17). More efficient automotive
power conversion is possible (18, 19). Emis-
sions depend on vehicle mass, driving
patterns, and aerodynamic drag, as well as
well-to-wheels efficiency [(torque ϫ angular
velocity at wheels)/(fossil fuel power in)].
Power trains are typically 18 to 23% efficient
for internal combustion (IC), 21 to 27% for
battery-electric (35 to 40%, central power
plant; 80 to 85%, charge-discharge cycles; 80
to 85%, motor), 30 to 35% for IC-electric
hybrid (higher efficiency from electric power
recovery of otherwise lost mechanical ener-
gy), and 30 to 37% for fuel cell–electric (75
to 80%, reformer; 50 to 55%, fuel cell; 80 to
85%, motor).
Lifestyles also affect emissions. Ultra fu-
el-efficient cars are available today that can
travel up to 29 km literϪ1
[68 miles per
gallon (mpg) U.S. Environmental Protection
Agency highway driving cycle (EPA hwy)].
But consumer demand for sport utility vehi-
cles (SUVs) has driven the fuel economy of
the U.S. car and light truck fleet to a 21-year
low of 8.5 km literϪ1
(20 mpg EPA hwy)
steam
Steam
Turbine
water
condensate
Condensor
Generator
electricity
out
Pump
High-pressure Boiler
fossil fuel in
air (O2)
CO2 up the stack
or sequestered
CO2 out
CO2
to cooling
tower or cold
river water
and/or
cogeneration
cooling water
return flow
A
B
fossil
fuel
sequestered CO2
CO2
farm residue
or marine
biomass sunk
to deep ocean
ocean release
of CO2/CaCO3
mixture or
liquid CO2
CO2
CO2
electricity
& H2 magnesium carbonate bricks
central
power plants
biomass
fuel
Coal
mines
Gas & Oil
fields
Deep coal beds,
subterranean
aquifers
Carbon sequestration rates to produce
10 TW CO2-emission-free from fossil fuels
Fossil
fuel
Gas
Oil
Coal
Energy content
[TW-yr]
Carbon content
[GTC]
(Efuel/C)
[TW-yr/GtC]
(E/C)
[TW-yr/GtC]
Sequestration
rate [GtC/yr]
1200
1200
4800
570
750
3690
2.1
1.6
1.3
1.9 - 1.6
1.4 - 1.2
1.2 - 1.0
5 - 6
7 - 8
9 - 10
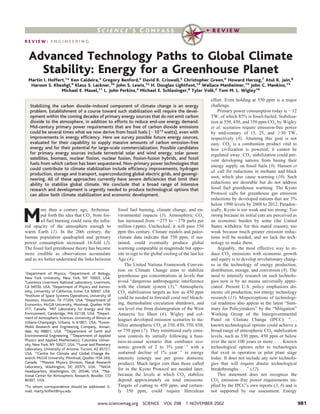
Fig. 1. (A) Fossil fuel electricity from steam turbine cycles. (B) Collecting CO2 from central plants
and air capture, followed by subterranean, ocean, and/or solid carbonate sequestration, could foster
emission-free electricity and hydrogen production, but huge processing and sequestration rates are
needed (5 to 10 GtC yearϪ1
to produce 10 TW emission-free assuming energy penalties of 10 to
25%).
S C I E N C E ’ S C O M P A S S
1 NOVEMBER 2002 VOL 298 SCIENCE www.sciencemag.org982](data:image/gif;base64,R0lGODlhAQABAIAAAAAAAP///yH5BAEAAAAALAAAAAABAAEAAAIBRAA7)
Recomendados
Recomendados
Más contenido relacionado
La actualidad más candente
La actualidad más candente (20)
Destacado
Destacado (18)
Similar a 10.1.1.120.7375
Similar a 10.1.1.120.7375 (20)
10.1.1.120.7375
- 1. R E V I E W : E N G I N E E R I N G Advanced Technology Paths to Global Climate Stability: Energy for a Greenhouse Planet Martin I. Hoffert,1 * Ken Caldeira,3 Gregory Benford,4 David R. Criswell,5 Christopher Green,6 Howard Herzog,7 Atul K. Jain,8 Haroon S. Kheshgi,9 Klaus S. Lackner,10 John S. Lewis,12 H. Douglas Lightfoot,13 Wallace Manheimer,14 John C. Mankins,15 Michael E. Mauel,11 L. John Perkins,3 Michael E. Schlesinger,8 Tyler Volk,2 Tom M. L. Wigley16 Stabilizing the carbon dioxide–induced component of climate change is an energy problem. Establishment of a course toward such stabilization will require the devel- opment within the coming decades of primary energy sources that do not emit carbon dioxide to the atmosphere, in addition to efforts to reduce end-use energy demand. Mid-century primary power requirements that are free of carbon dioxide emissions could be several times what we now derive from fossil fuels (ϳ1013 watts), even with improvements in energy efficiency. Here we survey possible future energy sources, evaluated for their capability to supply massive amounts of carbon emission–free energy and for their potential for large-scale commercialization. Possible candidates for primary energy sources include terrestrial solar and wind energy, solar power satellites, biomass, nuclear fission, nuclear fusion, fission-fusion hybrids, and fossil fuels from which carbon has been sequestered. Non–primary power technologies that could contribute to climate stabilization include efficiency improvements, hydrogen production, storage and transport, superconducting global electric grids, and geoengi- neering. All of these approaches currently have severe deficiencies that limit their ability to stabilize global climate. We conclude that a broad range of intensive research and development is urgently needed to produce technological options that can allow both climate stabilization and economic development. M ore than a century ago, Arrhenius put forth the idea that CO2 from fos- sil fuel burning could raise the infra- red opacity of the atmosphere enough to warm Earth (1). In the 20th century, the human population quadrupled and primary power consumption increased 16-fold (2). The fossil fuel greenhouse theory has become more credible as observations accumulate and as we better understand the links between fossil fuel burning, climate change, and en- vironmental impacts (3). Atmospheric CO2 has increased from ϳ275 to ϳ370 parts per million (ppm). Unchecked, it will pass 550 ppm this century. Climate models and paleo- climate data indicate that 550 ppm, if sus- tained, could eventually produce global warming comparable in magnitude but oppo- site in sign to the global cooling of the last Ice Age (4). The United Nations Framework Conven- tion on Climate Change aims to stabilize greenhouse gas concentrations at levels that avoid “dangerous anthropogenic interference with the climate system (5).” Atmospheric CO2 stabilization targets as low as 450 ppm could be needed to forestall coral reef bleach- ing, thermohaline circulation shutdown, and sea level rise from disintegration of the West Antarctic Ice Sheet (6). Wigley and col- leagues developed emission scenarios to sta- bilize atmospheric CO2 at 350, 450, 550, 650, or 750 ppm (7). They minimized early emis- sion controls by initially following a busi- ness-as-usual scenario that combines eco- nomic growth of 2 to 3% yearϪ1 with a sustained decline of 1% yearϪ1 in energy intensity (energy use per gross domestic product). Much larger cuts than those called for in the Kyoto Protocol are needed later, because the levels at which CO2 stabilize depend approximately on total emissions. Targets of cutting to 450 ppm, and certain- ly 350 ppm, could require Herculean effort. Even holding at 550 ppm is a major challenge. Primary power consumption today is ϳ12 TW, of which 85% is fossil-fueled. Stabiliza- tion at 550, 450, and 350 ppm CO2 by Wigley et al. scenarios require emission-free power by mid-century of 15, 25, and Ͼ30 TW, respectively (8). Attaining this goal is not easy. CO2 is a combustion product vital to how civilization is powered; it cannot be regulated away. CO2 stabilization could pre- vent developing nations from basing their energy supply on fossil fuels (9). Hansen et al. call for reductions in methane and black soot, which also cause warming (10). Such reductions are desirable but do not address fossil fuel greenhouse warming. The Kyoto Protocol calls for greenhouse gas emission reductions by developed nations that are 5% below 1990 levels by 2008 to 2012. Paradox- ically, Kyoto is too weak and too strong: Too strong because its initial cuts are perceived as an economic burden by some (the United States withdrew for this stated reason); too weak because much greater emission reduc- tions will be needed, and we lack the tech- nology to make them. Arguably, the most effective way to re- duce CO2 emissions with economic growth and equity is to develop revolutionary chang- es in the technology of energy production, distribution, storage, and conversion (8). The need to intensify research on such technolo- gies now is by no means universally appre- ciated. Present U.S. policy emphasizes do- mestic oil production, not energy technology research (11). Misperceptions of technologi- cal readiness also appear in the latest “Sum- mary for Policymakers” by the “Mitigation” Working Group of the Intergovernmental Panel on Climate Change (IPCC): “. . . known technological options could achieve a broad range of atmospheric CO2 stabilization levels, such as 550 ppm, 450 ppm or below over the next 100 years or more. . . . Known technological options refer to technologies that exist in operation or pilot plant stage today. It does not include any new technolo- gies that will require drastic technological breakthroughs. . . .” (12) This statement does not recognize the CO2 emission–free power requirements im- plied by the IPCC’s own reports (3, 8) and is not supported by our assessment. Energy 1 Department of Physics, 2 Department of Biology, New York University, New York, NY 10003, USA. 3 Lawrence Livermore National Laboratory, Livermore, CA 94550, USA. 4 Department of Physics and Astron- omy, University of California, Irvine, CA 92697, USA. 5 Institute of Space Systems Operations, University of Houston, Houston, TX 77204, USA. 6 Department of Economics, McGill University, Montreal, Quebec H3A 2T7, Canada. 7 MIT Laboratory for Energy and the Environment, Cambridge, MA 02139, USA. 8 Depart- ment of Atmospheric Sciences, University of Illinois at Urbana-Champaign, Urbana, IL 61801, USA. 9 Exxon- Mobil Research and Engineering Company, Annan- dale, NJ 08801, USA. 10 Department of Earth and Environmental Engineering, 11 Department of Applied Physics and Applied Mathematics, Columbia Univer- sity, New York, NY 10027, USA. 12 Lunar and Planetary Laboratory, University of Arizona, Tucson, AZ 85721, USA. 13 Centre for Climate and Global Change Re- search, McGill University, Montreal, Quebec H3A 2K6, Canada. 14 Plasma Physics Division, Naval Research Laboratory, Washington, DC 20375, USA. 15 NASA Headquarters, Washington, DC 20546, USA. 16 Na- tional Center for Atmospheric Research, Boulder, CO 80307, USA. *To whom correspondence should be addressed. E- mail: marty.hoffert@nyu.edu S C I E N C E ’ S C O M P A S S ● R E V I E W www.sciencemag.org SCIENCE VOL 298 1 NOVEMBER 2002 981
- 2. sources that can produce 100 to 300% of present world power consumption without greenhouse emissions do not exist operation- ally or as pilot plants. Can we produce enough emission-free power in time? Here we assess the potential of a broad range of technologies aimed at meeting this goal. Improving Efficiency Efficiency is the ratio of usable energy output to energy input. Primary energy in metastable chemical and nuclear bonds includes fossil fuels, fission fuels, and fusion fuels. “Renew- ables” are primary energy in natural fluxes (solar photons, wind, water, and heat flows). Energy conversion always involves dissipa- tive losses, losses that in many cases engi- neers have already expended considerable ef- fort to reduce. Opportunities still exist to improve efficiency in power generation and end-use sectors: transportation, manufactur- ing, electricity, and (indoor) climate condi- tioning (13). The efficiencies of mature technologies are well characterized (14, 15). Most efficient are large electric generators (98 to 99% effi- cient) and motors (90 to 97%). These are followed by rotating heat engines that are limited by the second law of thermodynam- ics: gas and steam turbines (35 to 50%) and diesel (30 to 35%) and internal combustion (15 to 25%) engines. Electrolyte and elec- trode materials and catalysts limit electro- chemical fuel cells (50 to 55% now; 70% eventually). Fuel cells may replace heat en- gines but will likely run on hydrogen. A seamless transition would use H2 extracted from gasoline or methanol in reformers (75 to 80%). Renewable energy converters include photovoltaic (PV) cells (commercial arrays, about 15 to 20%; theoretical peak for single bandgap crystalline cells, Ϸ24%; higher for multiband cells, lower for more cost-effective amorphous thin films) and wind turbines (commercial units, about 30 to 40%; theoret- ical “Betz limit,” Ϸ59%). High-pressure so- dium vapor (15 to 20%), fluorescent (10 to 12%), and incandescent (2 to 5%) illumina- tion generate more heat than light. Photosyn- thesis has a very low sunlight-to-chemical energy efficiency, limited by chlorophyll ab- sorption bands (most productive ecosystems are about 1 to 2% efficient; theoretical peak independent of cell or ecosystem is Ϸ8%). How much can energy efficiency im- prove? In a given technology class, efficiency normally starts low, grows for decades to centuries, and levels off at some fraction of its theoretical peak (16). It took 300 years to develop fuel cells from 1%-efficient steam engines. The earliest gas turbines could bare- ly turn their compressors. The development of fusion could be similar: The best experi- ments are close to balancing power to ignite the plasma; power is carried off by fusion- generated neutrons, but no net power output has occurred yet. Fossil and nuclear fuels are much closer to their limits (Figs. 1A and 4A). Steam-cycle efficiencies (39 to 50%, includ- ing combined cycles and cogeneration) and overall primary energy–to-electricity effi- ciency (30 to 36%, including transmission losses) yield the nominal thermal-to-electric power conversion: 3 kW (thermal) Ϸ 1 kWe (electrical). Impressive reductions in waste heat have been accomplished with compact fluorescents, low emissivity windows, and cogeneration (17). More efficient automotive power conversion is possible (18, 19). Emis- sions depend on vehicle mass, driving patterns, and aerodynamic drag, as well as well-to-wheels efficiency [(torque ϫ angular velocity at wheels)/(fossil fuel power in)]. Power trains are typically 18 to 23% efficient for internal combustion (IC), 21 to 27% for battery-electric (35 to 40%, central power plant; 80 to 85%, charge-discharge cycles; 80 to 85%, motor), 30 to 35% for IC-electric hybrid (higher efficiency from electric power recovery of otherwise lost mechanical ener- gy), and 30 to 37% for fuel cell–electric (75 to 80%, reformer; 50 to 55%, fuel cell; 80 to 85%, motor). Lifestyles also affect emissions. Ultra fu- el-efficient cars are available today that can travel up to 29 km literϪ1 [68 miles per gallon (mpg) U.S. Environmental Protection Agency highway driving cycle (EPA hwy)]. But consumer demand for sport utility vehi- cles (SUVs) has driven the fuel economy of the U.S. car and light truck fleet to a 21-year low of 8.5 km literϪ1 (20 mpg EPA hwy) steam Steam Turbine water condensate Condensor Generator electricity out Pump High-pressure Boiler fossil fuel in air (O2) CO2 up the stack or sequestered CO2 out CO2 to cooling tower or cold river water and/or cogeneration cooling water return flow A B fossil fuel sequestered CO2 CO2 farm residue or marine biomass sunk to deep ocean ocean release of CO2/CaCO3 mixture or liquid CO2 CO2 CO2 electricity & H2 magnesium carbonate bricks central power plants biomass fuel Coal mines Gas & Oil fields Deep coal beds, subterranean aquifers Carbon sequestration rates to produce 10 TW CO2-emission-free from fossil fuels Fossil fuel Gas Oil Coal Energy content [TW-yr] Carbon content [GTC] (Efuel/C) [TW-yr/GtC] (E/C) [TW-yr/GtC] Sequestration rate [GtC/yr] 1200 1200 4800 570 750 3690 2.1 1.6 1.3 1.9 - 1.6 1.4 - 1.2 1.2 - 1.0 5 - 6 7 - 8 9 - 10 Fig. 1. (A) Fossil fuel electricity from steam turbine cycles. (B) Collecting CO2 from central plants and air capture, followed by subterranean, ocean, and/or solid carbonate sequestration, could foster emission-free electricity and hydrogen production, but huge processing and sequestration rates are needed (5 to 10 GtC yearϪ1 to produce 10 TW emission-free assuming energy penalties of 10 to 25%). S C I E N C E ’ S C O M P A S S 1 NOVEMBER 2002 VOL 298 SCIENCE www.sciencemag.org982
- 3. (19). Even with SUVs, doubling (or more) efficiency is quite feasible. Unfortunately, the effects of such efficiency could be over- whelmed if China and India follow the U.S. path from bicycles and mass transit to cars. (Asia already accounts for Ͼ80% of petro- leum consumption growth.) As a result, car- bon-neutral fuels or CO2 “air capture” may be the best alternatives to develop. Decarbonization and Sequestration Reducing the amount of carbon emitted per unit of primary energy is called decarbonization. The long-term trend has been from coal to oil to gas, with each fuel emitting progressively less CO2 per joule of heat (20). Continuation of the trend would lead to use of H2, a carbon-neutral fuel, but H2 does not exist in geological reser- voirs. Processes requiring energy are needed for its synthesis. The energy can come from fossil fuel feedstocks. H2 is produced today by steam- reforming natural gas (2H2O ϩ CH4 3 4H2 ϩ CO2). Energy can be transferred to H2 with an efficiency of about 72% from gas, 76% from oil, and 55 to 60% from coal (21). Per unit of heat generated, more CO2 is produced by mak- ing H2 from fossil fuel than by burning the fossil fuel directly. Emission-free H2 manufac- tured by water electrolysis that is powered by renewable or nuclear sources is not yet cost effective. Thus, the decarbonization of fuels alone will not mitigate global warming. The under- lying problem is providing 10 to 30 TW emission-free in 50 years. Continuing the trend to lower carbon fuels requires disposing of excess carbon because the trend opposes the relative abundance of fossil resources— high-carbon coal being most abundant, fol- lowed by oil and gas (22, 23). One vision of “clean” coal incorporates CO2 capture and sequestration: Coal and/or biomass and waste materials are gasified in an oxygen-blown gasifier, and the product is cleaned of sulfur and reacted with steam to form H2 and CO2. After heat extraction, the CO2 is sequestered and the H2 used for transportation or electric- ity generation (24). Decarbonization is thus intimately linked to sequestration (25). Se- questration reservoirs include oceans, trees, soils, depleted natural gas and oil fields, deep saline aquifers, coal seams, and solid mineral carbonates (Fig. 1B). The main advantage of sequestration is its compatibility with exist- ing fossil fuel infrastructures, including CO2 injections for enhanced recovery from exist- ing oil and gas fields and capture of CO2 from power plant flue gases. Recovery of fossil fuel CO2 emitted from decentralized sources (like cars) may be needed. The simplest air capture is foresta- tion. Tree and soil sequestration does not require combustion product separation or more fuel, but the capacity to absorb CO2 is limited. Uptake occurs during growth of or- ganic matter (CH2O), when the net photosyn- thesis-respiration reaction is to the right: h ϩ CO2 ϩ H2O 3 CH2O ϩ O2. Historical CO2 data and models imply a temperate for- est carbon sink today of 1 to 3 billion tons of carbon (GtC) yearϪ1 (3), but some models show forests reversing from sinks to sources later this century as global warming increases soil respiration (26). The exchange time of CO2 with trees is ϳ7 years. Turnover of iron fertilization–enhanced plankton uptake (27) can be similarly fast if organic detritus oxi- dizes near the surface. Biological sequestra- tion approaches to longer term storage in- clude sealing undecayed trees underground (28) and sinking agricultural residues to the deep ocean (29). Air capture by aqueous cal- cium hydroxide [Ca(OH)2] in shallow pools, with CO2 recovery by heating CaCO3 in a retort to produce CaO and CO2, has also been proposed (30). This reaction (calcination) is a key step in making cement from limestone, but breaking the Ca–CO2 bond requires sub- stantial energy. Also being explored is longer term CO2 sequestration in the deep sea (31). For a given emission scenario, ocean injections can sub- stantially decrease peak atmospheric CO2 levels, although all cases eventually diffuse some CO2 back to the atmosphere (32). Back- diffusion and pH impacts of ocean CO2 dis- posal could be diminished by accelerating carbonate mineral weathering that would oth- erwise slowly neutralize the oceanic acidity produced by fossil fuel CO2 (33, 34). A far-reaching removal scheme is reacting CO2 with the mineral serpentine to sequester car- bon as a solid in magnesium carbonate “bricks” by vastly accelerating silicate rock weathering reactions, which remove atmo- spheric CO2 over geologic time scales (35). Thus, carbon sequestration could be a valu- able bridge to renewable and/or nuclear energy. However, if other emission-free pri- mary power sources of 10 to 30 TW are unavailable by mid-century, then enormous sequestration rates could be needed to stabi- lize atmospheric CO2 (Fig. 1B). Substantial research investments are needed now to make this technology available in time. Renewables Renewable energy technologies include bio- mass, solar thermal and photovoltaic, wind, N2 (liquid) N2 (gas) to superconducting electric power grid electric power conditioning liquid nitrogen chiller to hydrogen pipelines and storage H2 H2O O2 electrolyzerphotovoltaic arrays wind farms Renewable electricity and hydrogen A B Icosahedron: An equilateral-triangle- faced solid that reduces map projection errors Antarctica Europe Asia Africa South America North America Oceania Buckminster Fuller's Global Electrical Grid Fig. 2. (A) Mass-produced widely distributed PV arrays and wind turbines making electrolytic H2 or electricity may eventually generate 10 to 30 TW emission-free. (B) The global grid proposed by R. Buckminster Fuller with modern computerized load management and high-temperature supercon- ducting (HTS) cables could transmit electricity from day to night locations and foster low-loss distribution from remote, episodic, or dangerous power sources. (The resistivity of HTS wires vanishes below the 77 K boiling point of nitrogen available from air.) S C I E N C E ’ S C O M P A S S www.sciencemag.org SCIENCE VOL 298 1 NOVEMBER 2002 983
- 4. hydropower, ocean thermal, geothermal, and tidal (36). With the exception of firewood and hydroelectricity (close to saturation), these are collectively Ͻ1% of global power. All renewables suffer from low areal power densities. Biomass plantations can produce carbon-neutral fuels for power plants or transportation, but photosynthesis has too low a power density (ϳ0.6 W mϪ2 ) for bio- fuels to contribute significantly to climate stabilization (14, 37). (10 TW from biomass requires Ͼ10% of Earth’s land surface, com- parable to all of human agriculture.) PV and wind energy (ϳ15 We mϪ2 ) need less land, but other materials can be limiting. For solar energy, U.S. energy consumption may re- quire a PV array covering a square ϳ160 km on each side (26,000 km2 ) (38). The electri- cal equivalent of 10 TW (3.3 TWe) requires a surface array ϳ470 km on a side (220,000 km2 ). However, all the PV cells shipped from 1982 to 1998 would only cover ϳ3 km2 (39). A massive (but not insurmountable) scale-up is required to get 10 to 30 TW equivalent. More cost-effective PV panels and wind turbines are expected as mass production drives economies of scale. But renewables are inter- mittent dispersed sources unsuited to baseload without transmission, storage, and power con- ditioning. Wind power is often available only from remote or offshore locations. Meeting lo- cal demand with PV arrays today requires pumped-storage or battery-electric backup sys- tems of comparable or greater capacity (40). “Balance-of-system” infrastructures could evolve from natural gas fuel cells if reformer H2 is replaced by H2 from PV or wind electrolysis (Fig. 2A). Reversible electrolyzer and fuel cells offer higher current (and power) per electrode area than batteries, ϳ20 kWe mϪ2 for proton exchange membrane (PEM) cells (21). PEM cells need platinum catalysts, Ͼ 5 ϫ 10Ϫ3 kg Pt mϪ2 (41) (a 10-TW hydrogen flow rate could require 30 times as much as today’s annual world platinum production). Advanced electri- cal grids would also foster renewables. Even if PV and wind turbine manufacturing rates in- creased as required, existing grids could not manage the loads. Present hub-and-spoke net- works were designed for central power plants, ones that are close to users. Such networks need to be reengineered. Spanning the world electri- cally evokes Buckminster Fuller’s global grid (Fig. 2B). Even before the discovery of high- temperature superconductivity (42), Fuller en- visioned electricity wheeled between day and night hemispheres and pole-to-pole (43). Worldwide deregulation and the free trade of electricity could have buyers and sellers estab- lishing a supply-demand equilibrium to yield a worldwide market price for grid-provided electricity. Space solar power (SSP) (Fig. 3, A and B) exploits the unique attributes of space to power Earth (44, 45). Solar flux is ϳ8 times higher in space than the long-term surface average on spinning, cloudy Earth. If theoret- ical microwave transmission efficiencies (50 to 60%) can be realized, 75 to 100 We could be available at Earth’s surface per m2 of PV array in space, Յ1/4 the area of surface PV arrays of comparable power. In the 1970s, the National Aeronautics and Space Administra- tion (NASA) and the U.S. Department of Energy (DOE) studied an SSP design with a PV array the size of Manhattan in geostation- ary orbit [(GEO) 35,800 km above the equa- tor] that beamed power to a 10-km by 13-km surface rectenna with 5 GWe output. [10 TW equivalent (3.3 TWe) requires 660 SSP units.] Other architectures, smaller satellites, and newer technologies were explored in the NASA “Fresh Look Study” (46). Alternative locations are 200- to 10,000-km altitude sat- ellite constellations (47), the Moon (48, 49), and the Earth-Sun L2 Lagrange exterior point [one of five libration points corotating with the Earth-Sun system (Fig. 3C)] (50). Poten- tially important for CO2 emission reduction is a demonstration proposed by Japan’s Institute of Space and Aeronautical Science to beam solar energy to developing nations a few degrees from the equator from a satellite in low equatorial orbit (51). Papua New Guinea, Indonesia, Ecuador, and Colombia on the Pacific Rim, and Malaysia, Brazil, Tanzania, and the Maldives have agreed to participate in such experiments (52). A major challenge is reducing or externalizing high launch Solar power satellite phased-array transmitting antenna Dt Dr sun-tracking PV arrays in orbit to grid and local power consumers power regulation microwave power beam DC out pilot beam rectenna (rectifying antenna) B Generation of power on the Moon, transmission to Earth by microwave beams •Assembled mainly from lunar materials Generation of power in-orbit, transmission to Earth by microwave Transmission of power from one point to another •Assembled entirely from terrestrial materials or •Assembled partly or mainly from lunar materials power source orbiting solar arrays with microwave transmitters solar arrays on Moon power consumer solar reflectors in lunar orbit Earth-orbiting microwave reflectors orbiting microwave reflector Sun Sun A x x x L3 L1 L2 L5L4 ~ 0.01 AU 2% of sunlight diffracted to bypass Earth 10 µm thick Fresnel lens near L1 aerosol scatters in the atmosphere EARTH SUN parasol screen or lens 1 AU ഠ 150 x 106 km Earth--Sun Lagrange points C Fig. 3. Capturing and controlling sun power in space. (A) The power relay satellite, solar power satellite (SPS), and lunar power system all exploit unique attributes of space (high solar flux, lines of sight, lunar materials, shallow gravitational potential well of the Moon). (B) An SPS in a low Earth orbit can be smaller and cheaper than one in geostationary orbit because it does not spread its beam as much; but it does not appear fixed in the sky and has a shorter duty cycle (the fraction of time power is received at a given surface site). (C) Space-based geoengineering. The Lagrange interior point L1 provides an opportunity for radiative forcing to oppose global warming. A 2000-km-diameter parasol near L1 could deflect 2% of incident sunlight, as could aerosols with engineered optical properties injected in the stratosphere. S C I E N C E ’ S C O M P A S S 1 NOVEMBER 2002 VOL 298 SCIENCE www.sciencemag.org984
- 5. costs. With adequate research investments, SSP could perhaps be demonstrated in 15 to 20 years and deliver electricity to global mar- kets by the latter half of the century (53, 54). Fission and Fusion Nuclear electricity today is fueled by 235 U. Bombarding natural U with neutrons of a few eV splits the nucleus, releasing a few hundred million eV (235 U ϩ n 3 fission products ϩ 2.43n ϩ 202 MeV) (55). The 235 U isotope, 0.72% of natural U, is often enriched to 2 to 3% to make reactor fuel rods. The existing ϳ500 nuclear power plants are variants of 235 U thermal reactors (56, 57): the light water reactor [(LWR) in both pressurized and boil- ing versions]; heavy water (CANDU) reactor; graphite-moderated, water-cooled (RBMK) reactors, like Chernobyl; and gas-cooled graphite reactors. LWRs (85% of today’s re- actors) are based largely on Hyman Rick- over’s water-cooled submarine reactor (58). Loss-of-coolant accidents [Three Mile Island (TMI) and Chernobyl] may be avoidable in the future with “passively safe” reactors (Fig. 4A). Available reactor technology can pro- vide CO2 emission–free electric power, though it poses well-known problems of waste disposal and weapons proliferation. The main problem with fission for climate stabilization is fuel. Sailor et al. (58) propose a scenario with 235 U reactors producing ϳ10 TW by 2050. How long before such reactors run out of fuel? Current estimates of U in proven reserves and (ultimately recoverable) resources are 3.4 and 17 million metric tons, respectively (22) [Ores with 500 to 2000 parts per million by weight (ppmw) U are considered recoverable (59)]. This represents 60 to 300 TW-year of primary energy (60). At 10 TW, this would only last 6 to 30 years—hardly a basis for energy policy. Re- coverable U may be underestimated. Still, with 30- to 40-year reactor lifetimes, it would be imprudent (at best) to initiate fission scale- up without knowing whether there is enough fuel. What about the seas? Japanese research- ers have harvested dissolved U with organic adsorbents from flowing seawater (61). Oceans have 3.2 ϫ 10Ϫ6 kg dissolved U mϪ3 (62)— a 235 U energy density of 1.8 MJ mϪ3 . Multiplying by the oceans’ huge volume (1.37 ϫ 1018 m3 ) gives 4.4 billion metric tons U and 80,000 TW-year in 235 U. Runoff and outflow to the sea from all the world’s rivers is 1.2 ϫ 106 m3 sϪ1 (63). Even with 100% 235 U extraction, the flow rate needed to make reactor fuel at the 10 TW rate is five times as much as this outflow (64). Getting 10 TW primary power from 235 U in crustal ores or seawater extraction may not be impossible, but it would be a big stretch. Despite enormous hurdles, the most promising long-term nuclear power source is still fusion (65). Steady progress has been made toward “breakeven” with tokamak (a toroidal near-vacuum chamber) magnetic confinement [Q § (neutron or charged parti- cle energy out)/(energy input to heat plas- ma) ϭ 1] (Fig. 4B). The focus has been on the deuterium-tritium (D-T) reaction (3 4 He ϩ n ϩ 17.7 MeV). Breakeven requires that the “plasma triple product” satisfy the Lawson criteria: n ϫ ϫ kT Ϸ 1 ϫ 1021 mϪ3 s keV for the D-T reaction, where n is number density; , confinement time; T, temperature; and k, Boltzmann’s constant (66, 67). Best results from Princeton (Tokamak Fusion Test Reactor) and Europe (Joint European Torus) are within a factor of two (68). Higher Qs are needed for power reactors: Neutrons pene- trating the “first wall” would be absorbed by molten lithium, and excess heat would be transferred to turbogenerators. Tritium (12.3- year half-life) would also be bred in the lithium blanket (n ϩ 6 Li 3 4 He ϩ T ϩ 4.8 MeV). D in the sea is virtually unlimited whether utilized in the D-T reaction or the harder-to-ignite D-D reactions (3 3 He ϩ n ϩ 3.2 MeV and 3 T ϩ p ϩ 4.0 MeV). If D-T reactors were operational, lithium bred to T could generate 16,000 TW-year (69), twice the thermal energy in fossil fuels. The D-3 He reaction (3 4 He ϩ p ϩ 18.3 MeV) is of interest because it yields charged particles directly convertible to electricity (70). Stud- ies of D-3 He and D-D burning in inertial confinement fusion targets suggest that cen- tral D-T ignitors can spark these reactions. steam generator Fig. 4. (A) The conventional LWR employs water as both coolant and working fluid (left). The helium-cooled, graphite-moderated, pebble-bed, modular nuclear fission reactor is theoretically immune to loss-of-coolant meltdowns like TMI and Chernobyl (right). (B) The most successful path to fusion has been confining a D-T plasma (in purple) with complex magnetic fields in a tokamak. Breakeven occurs when the plasma triple product (number density ϫ confinement time ϫ temperature) attains a critical value. Recent tokamak performance improvements were capped by near-breakeven [data sources in (68)]. Experimental work on advanced fusion fuel cycles and simpler magnetic confinement schemes like the levitated dipole experiment (LDX ) shown are recommended. S C I E N C E ’ S C O M P A S S www.sciencemag.org SCIENCE VOL 298 1 NOVEMBER 2002 985
- 6. Ignition of D-T–fueled inertial targets and associated energy gains of Q Ն 10 may be realized in the National Ignition Facility within the next decade. Experiments are un- der way to test dipole confinement by a su- perconducting magnet levitated in a vacuum chamber (71), a possible D-3 He reactor pro- totype. Rare on Earth, 3 He may someday be cost-effective to mine from the Moon (72). It is even more abundant in gas-giant planetary atmospheres (73). Seawater D and outer plan- et 3 He could power civilization longer than any source other than the Sun. How close, really, are we to using fusion? Devices with a larger size or a larger mag- netic field strength are required for net power generation. Until recently, the fusion commu- nity was promoting the International Thermo- nuclear Experimental Reactor (ITER) to test engineering feasibility. Enthusiasm for ITER waned because of the uncertainty in raising the nearly $10 billion needed for construc- tion. The U.S. halted ITER sponsorship in 1998, but there is renewed interest among U.S. fusion scientists to build a smaller-sized, higher-field, nonsuperconducting experiment or to rejoin participation in a half-sized, re- designed ITER physics experiment. A “burn- ing plasma experiment” could produce net fusion power at an affordable scale and could allow detailed observation of confined plas- ma during self-heating by hot alpha particles. The Fusion Energy Sciences Act of 2001 calls on DOE to “develop a plan for United States construction of a magnetic fusion burning plasma experiment for the purpose of accelerating scientific understanding of fu- sion plasmas (74).” This experiment is a critical step to the realization of practical fusion energy. Demonstrating net electric power production from a self-sustaining fu- sion reactor would be a breakthrough of over- whelming importance but cannot be relied on to aid CO2 stabilization by mid-century. The conclusion from our 235 U fuel analy- sis is that breeder reactors are needed for fission to significantly displace CO2 emis- sions by 2050. Innovative breeder technolo- gies include fusion-fission and accelerator- fission hybrids. Fissionable 239 Pu and/or 233 U can be made from 238 U and 232 Th (75). Commercial breeding is illegal today in the United States because of concerns over waste and proliferation (France, Germany, and Ja- pan have also abandoned their breeding pro- grams). Breeding could be more acceptable with safer fuel cycles and transmutation of high-level wastes to benign products (76). Th is the more desirable feedstock: It is three times more abundant than U and 233 U is harder to separate and divert to weapons than plutonium. One idea to speed up breeding of 233 U is to use tokamak-derived fusion-fission hybrids (68, 77). D-T fusion yields a 3.4- MeV alpha particle and a 14-MeV neutron. The neutron would be used to breed 233 U from Th in the fusion blanket. Each fusion neutron would breed about one 233 U and one T. Like 235 U, 233 U generates about 200 MeV when it fissions. Fission is energy rich and neutron poor, whereas fusion is energy poor and neutron rich. A single fusion breeder could support perhaps 10 satellite burners, whereas a fission breeder supports perhaps one. A related concept is the particle accel- erator-fission hybrid breeder (56): Thirty 3-MeV neutrons result from each 1000-MeV proton accelerated into molten lead; upon injection to a subcritical reactor, these could increase reactivity enough to breed 233 U from Th, provide electricity, and power the accel- erator efficiently (ϳ10% of the output). The radiotoxicity of hybrid breeder reactors over time is expected to be substantially below LWRs. These ideas appear important enough to pursue experimentally, but both fission and fusion are unlikely to play significant roles in climate stabilization without aggressive re- search and, in the case of fission, without the resolution of outstanding issues of high-level waste disposal and weapons proliferation. Geoengineering No discussion of global warming mitigation is complete without mentioning “geoengi- neering” (78, 79), also called climate engi- neering or planetary engineering on Earth and terraforming on other planets (80). Geoengi- neering in the climate change context refers mainly to altering the planetary radiation bal- ance to affect climate and uses technologies to compensate for the inadvertent global warming produced by fossil fuel CO2 and other greenhouse gases. An early idea was to put layers of reflective sulfate aerosol in the upper atmosphere to counteract greenhouse warming (81). Variations on the sunblocking theme include injecting sub-micrometer dust to the stratosphere in shells fired by naval guns, increasing cloud cover by seeding, and shadowing Earth by objects in space (82). Perhaps most ambitious is a proposed 2000- km-diameter mirror of 10-m glass fabricat- ed from lunar materials at the L1 (83) La- grange point of the Sun-Earth system (84) (Fig. 3C). The mirror’s surface would look like a permanent sunspot, would deflect 2% of solar flux, and would roughly compensate for the radiative forcing of a CO2 doubling. Climate model runs indicate that the spatial pattern of climate would resemble that with- out fossil fuel CO2 (84). Engineering the optical properties of aerosols injected to the stratosphere to produce a variety of climatic effects has also been proposed (85). Our as- sessment reveals major challenges to stabiliz- ing the fossil fuel greenhouse with energy technology transformations. It is only prudent to pursue geoengineering research as an in- surance policy should global warming im- pacts prove worse than anticipated and other measures fail or prove too costly. Of course, large-scale geophysical interventions are in- herently risky and need to be approached with caution. Concluding Remarks Even as evidence for global warming accu- mulates, the dependence of civilization on the oxidation of coal, oil, and gas for energy makes an appropriate response difficult. The disparity between what is needed and what can be done without great compromise may become more acute as the global economy grows and as larger reductions in CO2-emit- ting energy relative to growing total energy demand are required. Energy is critical to global prosperity and equity. If Earth continues to warm, people may turn to advanced technologies for solutions. Combating global warming by radical re- structuring of the global energy system could be the technology challenge of the century. We have identified a portfolio of promising technologies here—some radical departures from our present fossil fuel system. Many concepts will fail, and staying the course will require leadership. Stabilizing climate is not easy. At the very least, it requires political will, targeted research and development, and international cooperation. Most of all, it re- quires the recognition that, although regula- tion can play a role, the fossil fuel greenhouse effect is an energy problem that cannot be simply regulated away. References and Notes 1. S. Arrhenius, Phila. Mag. 41, 237 (1896). 2. J. R. McNeill, Something New Under the Sun: An Environmental History of the Twentieth Century (Nor- ton, New York, 2000). 3. J. T. Houghton et al., Eds., Climate Change 2001: Scientific Basis (Cambridge Univ. Press, New York, 2001). 4. M. I. Hoffert, C. Covey, Nature 360, 573 (1992). 5. United Nations Framework Convention on Climate Change, Text of the Convention, May 1992, Rio de Janeiro, Brazil (United Nations Environment Pro- gram–World Meteorological Organization, Climate Change Secretariat, Geneva, 1992). 6. B. C. O’Neill, M. Oppenheimer, Science 296, 1971 (2002). 7. T. M. L. Wigley, R. Richels, J. A. Edmonds. Nature 379, 240 (1996). 8. M. I. Hoffert et al., Nature 395, 881 (1998). 9. B. Bolin, H. S. Kheshgi, Proc. Natl. Acad. Sci. U.S.A. 98, 4850 (2001). 10. J. Hansen, M. Sato, R. Ruedy, A, Lacis, V. Oinas, Proc. Natl. Acad. Sci. U.S.A. 97, 9875 (2000). 11. R. B. Cheney et al., National Energy Policy: Report of the National Energy Policy Development Group ( The White House, Washington, DC, May 2001); available at www.whitehouse.gov/energy/National-Energy- Policy.pdf. 12. B. Metz et al., Eds., Climate Change 2001: Mitigation (Cambridge Univ. Press, New York, 2001), p. 8. 13. National Laboratory Directors, Technology Opportu- nities to Reduce U.S. Greenhouse Gas Emissions (DOE, Washington, DC, 1997); available at www.ornl.gov/ climate_change/climate.htm. 14. M. I. Hoffert, S. E. Potter, in Engineering Response to S C I E N C E ’ S C O M P A S S 1 NOVEMBER 2002 VOL 298 SCIENCE www.sciencemag.org986
- 7. Global Climate Change, R. G. Watts, Ed. (Lewis, Boca Raton, FL, 1997), pp. 205–259. 15. V. Smil, Energies (MIT Press, Cambridge, MA, 1999). 16. J. H. Ausubel, C. Marchetti, Daedalus 125, 139 (1996). 17. A. H. Rosenfield, T. M. Kaarsberg, J. Romm, Phys. Today, 53, 29 (November 2000). 18. M. A. Weiss, J. B. Heywood, E. M. Drake, A. Schafer, F. F. AuYeung, On the Road in 2020: A Life-Cycle Analysis of New Automobile Technologies, EL 00-003 (MIT Energy Laboratory, Cambridge, MA, 2000); avail- able at web.mit.edu/energylab/www/pubs/el00- 003.pdf. 19. K. H. Hellman, R. M. Heavenrich, Light-Duty Automo- tive Technology and Fuel Economy Trends: 1975 Through 2001, EPA420-R-01-008 (U.S. Environmen- tal Protection Agency, Washington, DC, 2001); avail- able at www.epa.gov/OMS/cert/mpg/fetrends/ r01008.pdf. 20. C. Marchetti, Nucl. Sci. Eng. 90, 521 (1985). 21. C.-J. Winter, J. Nitsch, Eds., Hydrogen as an Energy- Carrier (Springer-Verlag, New York, 1988). 22. N. Nakic´enovic´, A. Gru¨bler, A. McDonald, Global En- ergy Perspectives (Cambridge Univ. Press, New York, 1998), p. 52. 23. Energy in recoverable fossil fuels (“reserves” plus “resources” from conventional and unconventional sources) is ϳ4800 TW-year for coal and ϳ1200 TW-year each for oil and gas [converted from values in (22); 1 billion metric ton oil equivalent ϭ 44.8 EJ ϭ 1.42 TW-year; natural gas includes liquids, excludes methane hydrates]. Total energy in recoverable fossil fuels ranges from 6400 to 8000 TW-year, two-thirds of which is coal. Coal resources could roughly double if energy in shales could be extracted cost-effectively. 24. J. P. Holdren et al., Federal Energy Research and Development for the Challenges of the Twenty-First Century (President’s Committee of Advisors on Sci- ence and Technology [PCAST], Washington, DC, 1997); available at www.ostp.gov/Energy/index.html. 25. D. Reichle et al., Carbon Sequestration Research and Development (DOE, Washington, DC, 1999); available at www.ornl.gov/carbon_sequestration/. 26. P. M. Cox, R. A. Betts, C. D. Jones, S. A. Spall, I. J. Totterdell, Nature 408, 184 (2000). 27. J. E. Martin, S. E. Fitzwater, R. M. Gordon, Glob. Biogeochem. Cycles 4, 5 (1990). 28. F. J. Dyson, G. Marland, Workshop on the Global Effects of Carbon Dioxide from Fossil Fuels, Report CONF-770385 (DOE, Washington, DC, 1977), pp. 111–118. 29. R. A. Metzger, G. Benford, Clim. Change 49, 11 (2001). 30. K. S. Lackner, P. Grimes, H.-J. Ziock, Carbon Dioxide Extraction from Air: Is It an Option? Technical Report LA-UR-99-583 (Los Alamos National Laboratory, Los Alamos, NM, 1999); available at www.lanl.gov/ energy/ecology/carbon/docs/AirExtraction.pdf. 31. H. Herzog, B. Eliasson, O. Kaarstad, Sci. Am. 282, 72 (2000). 32. H. S. Kheshgi, B. P. Flannery, M. I. Hoffert, A. G. Lapenis, Energy 19, 967 (1994). 33. K. Caldeira, G. H. Rau, Geophys. Res. Lett. 27, 225 (2000). 34. Carbon dioxide dissolves in water and slowly cor- rodes carbonate sediment, resulting in the storage of fossil fuel carbon primarily as bicarbonate ions dis- solved in the ocean. Left to nature, the net reaction CO2 ϩ H2O ϩ CaCO3 3 Ca2ϩ ϩ HCO3 – would occur on the time scale of ϳ6000 years. 35. K. S. Lackner, C. H. Wendt, D. P. Butt, E. L. Joyce Jr., D. H. Sharp, Energy 20, 1153 (1995). 36. T. B. Johansson, H. Kelly, A. K. N. Reddy, R. H. Wil- liams, Eds., Renewable Energy (Island Press, Washing- ton, DC, 1993). 37. H. S. Kheshgi, R. C. Prince, G. Marland, Annu. Rev. Energy Environ. 25, 199 (2000). 38. J. A. Turner, Science 285, 687 (1999). 39. H. C. Hayden, The Solar Fraud: Why Solar Energy Won’t Run the World ( Vales Lake Publishing, Pueblo West, CO, 2001), p. 161. 40. J. K. Strickland Jr., Sol. Energy 56, 23 (1996). 41. B. C. H. Steele, A. Heinzel, Nature 414, 345 (2001). 42. J. G. Bednorz, K. A. Mu¨ller, Z. Phys. B 64, 189 (1986). 43. R. B. Fuller, Critical Path (St. Martins, New York, 1981). 44. P. E. Glaser, Science 162, 857 (1968). 45. , F. P. Davidson, K. I. Csigi, Eds., Solar Power Satellites (Wiley-Praxis, New York, 1997). 46. J. Mankins, Aerosp. Am. 35, 30 (1997). 47. M. I. Hoffert, S. D. Potter, in Solar Power Satellites, P. E. Glaser, F. P. Davidson, K. I. Csigi, Eds. (Wiley- Praxis, New York, 1997), pp. 231–254. 48. D. R. Criswell, in Innovative Solutions to CO2 Stabili- zation, R. Watts, Ed. (Cambridge Univ. Press, New York, 2002), pp. 345–410. 49. , Ind. Physicist 8, 12 (April/May 2002). 50. G. A. Landis, in Proceedings of Solar Power Satellite ’97 Conference, 24 to 28 August 1997, Montreal, Canada (Canadian Aeronautics and Space Institute, Ottawa, Canada, 1997), pp. 327–328. 51. M. Nagatomo, Sol. Energy 56, 111 (1996). 52. P. Collins, Y. Purwanto, X. C. Ji, Space Energy Transp. 4, 47 (1999). 53. Committee for the Assessment of NASA’s Space So- lar Power Investment Strategy, Aeronautics and Space Engineering Board, National Research Council, Laying the Foundation for Space Solar Power: An Assessment of NASA’s Space Solar Power Investment Strategy (National Academy Press, Washington, DC, 2001). 54. S. J. Smith, N. Mahasenan, J. F. Clarke, J. Edmonds, Space Solar Electric Power: Future Market Share Un- der Competition (Battelle Memorial Institute, Wash- ington, DC, 2001). 55. H. G. Graetzer, Am. J. Phys. 32, 10 (1964) [translation from O. Hahn, F. Strassmann, Naturwissenschaften 27, 11 (1939)]. 56. A. M. Weinberg, in Technologies for a Greenhouse- Constrained Society, M. A. Kuliasha, A. Zuker, K. J. Ballew, Eds. (Lewis, Boca Raton, FL, 1992), pp. 227– 237. 57. R. L. Garwin, G. Charpak, Megawatts and Megatons: A Turning Point in the Nuclear Age (Knopf, New York, 2001). 58. W. C. Sailor, D. Bodansky, C. Braun, S. Fetter, B. van der Zwaan, Science 288, 1177 (2000). 59. M. A. Adelman, J. C. Houghton, G. Kaufman, M. B. Zimmerman, Energy Resources in an Uncertain Future (Ballinger, Cambridge, MA, 1983), p. 334. 60. Fission energy per ton (J tϪ1 ) 235 U is 202MeV 235 amu ϫ 1.661 ϫ 10–27 kg/amu ϫ 1.602 ϫ 10–13 J 1 MeV ϫ 103 kg 1 ton ϭ 8.3 ϫ 1016 J t235 U The 235 U energy per ton natural U is therefore 0.0072 ϫ 8.3 ϫ 1016 J tϪ1 Ϸ 6 ϫ 1014 J tϪ1 , and the energy in proven U reserves and ultimately recover- able resources is ϳ61 and 300 TW-year, respectively (1 TW-year ϭ 31.5 EJ). 61. S. Nakamura, K. Oguma, Y. Ito, J. Chem. Eng. Jpn. 28, 660 (1995). 62. P. Henderson, Inorganic Geochemistry (Pergamon, New York, 1982), p. 282. 63. J. P. Peixoto, A. H. Oort, Physics of Climate (American Institute of Physics, New York, 1992), p. 271. 64. The flow rate through a hypothetical seawater ex- traction plant to yield 235 U fuel at 10 TW is 10 TW ϫ 1.37 ϫ 1018 m3 8 ϫ 104 TW-year ϫ 1 year 3.15 ϫ 107 s ϭ 5.4 ϫ 106 m3 s–1 . 65. T. K. Fowler, The Fusion Quest (Johns Hopkins, Balti- more, MD, 1997). 66. J. D. Lawson, Proc. Phys. Soc. London B 70, 6 (1957). 67. G. H. Miley, Fusion Energy Conversion (American Nu- clear Society, LaGrange Park, IL, 1976). 68. W. Manheimer, Fusion Technol. 36, 1 (1999). 69. L. M. Lidsky, in Energy Technology Handbook, D. M. Considine, Ed. (McGraw-Hill, New York, 1977), pp. 5–134. 70. G. L. Kulcinski, J. F. Santarius, Nature 396, 724 (1998). 71. J. Kesner, L. Bromberg, M. Mauel, D. Garnier, J. M. Dawson, The Dipole Fusion Confinement Concept: A White Paper for the Fusion Community (MIT Plasma Science and Fusion Center, Cambridge, MA, 1998); available at www.psfc.mit.edu/ldx/pubs/dipole_ wp.pdf. 72. L. J. Wittenberg, J. F. Santarius, G. L. Kulcinski, Fusion Technol. 10, 167 (1987). 73. J. S. Lewis, Space Power 10, 363 (1991). 74. Fusion Energy Sciences Act of 2001, H.R. 1781 (107th Congress). 75. 239 Pu and 233 U don’t exist in nature. They must be bred from their feedstocks, 238 U (ϳ99% of U) and 232 Th (ϳ100% of thorium), with the use of suitable neutron sources (238 U ϩ n 3 239 Pu; 232 Th ϩ n 3 233 U). Fission energy per unit mass is comparable to 235 U (239 Pu ϩ n 3 fission products ϩ 2.9n ϩ 210 MeV; 233 U ϩ n 3 fission products ϩ 2.5n ϩ 198 MeV ). We estimate breeding could increase fission energy resources by factors of 60 and 180 for 239 Pu and 233 U, respectively. Breeding rates depend on feedstock mining rates and availability of neutrons. 76. Committee on Separations Technology and Transmu- tation Systems, Board on Radioactive Waste Manage- ment, Commission on Geosciences, Environment, and Resources, National Research Council, Nuclear Wastes: Technologies for Separations and Transmuta- tions (National Academy Press, Washington, DC, 1996). 77. H. Bethe, Phys. Today 32, 45 (May 1979). 78. S. H. Schneider, Nature 409, 417 (2001). 79. D. W. Keith, Nature 409, 420 (2001). 80. M. J. Fogg, Terraforming: Engineering Planetary Envi- ronments (Society of Automotive Engineers Interna- tional, Warrendale, PA, 1995). 81. M. I. Budyko, Climate Changes, R. Zolina, Transl., L. Levin, Ed. (American Geophysical Union, Washington DC, 1977). 82. Panel on Policy Implications of Greenhouse Warming, Committee on Science, Engineering, and Public Poli- cy, National Academy of Sciences, National Academy of Engineering, Institute of Medicine, Policy Implica- tions of Greenhouse Warming: Mitigation, Adaptation and the Science Base (National Academy Press, Washington, DC, 1992), pp. 433–464. 83. J. T. Early, J. Br. Interplanet. Soc. 42, 567 (1989). 84. B. Govindasamy, K. Caldeira, Geophys. Res. Lett. 27, 2141 (2000). 85. E. Teller, L. Wood, R. Hyde, Global Warming and Ice Ages: Prospects for Physics-Based Modulation of Global Change, Report UCRL-231636/UCRL JC 128715 (Lawrence Livermore National Laboratory, Livermore, CA, 1997). 86. We thank D. Harvey, J. Katzenberger, M. MacCracken, G. Marland, J. Palfreman, V. Smil, and P. Werbos for valuable discussions. K.C, H.H., and A.K.J. thank the DOE-Office of Biological and Environmental Research for support in this work. S C I E N C E ’ S C O M P A S S www.sciencemag.org SCIENCE VOL 298 1 NOVEMBER 2002 987