Nanocatalysts lecture 7 partners
•Descargar como PPTX, PDF•
2 recomendaciones•1,760 vistas


Recomendados
Recomendados
Más contenido relacionado
La actualidad más candente
Destacado
Destacado (20)
Similar a Nanocatalysts lecture 7 partners
Similar a Nanocatalysts lecture 7 partners (20)
Más de Stanford University
Más de Stanford University (20)
Último
Último (20)
Nanocatalysts lecture 7 partners
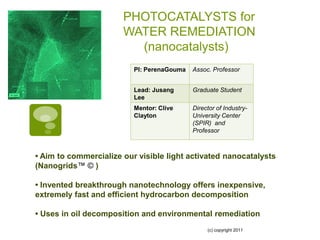
- 1. PHOTOCATALYSTS for WATER REMEDIATION (nanocatalysts) PI: PerenaGouma Assoc. Professor Lead: Jusang Graduate Student Lee Mentor: Clive Director of Industry- Clayton University Center (SPIR) and Professor • Aim to commercialize our visible light activated nanocatalysts (Nanogrids™ © ) • Invented breakthrough nanotechnology offers inexpensive, extremely fast and efficient hydrocarbon decomposition • Uses in oil decomposition and environmental remediation (c) copyright 2011
- 2. •IP validation •Building a brand •Expanding • New Product their services •Pilot Studies •Industrial nano- •Green •Remediation manufacturing •Marketing •Continuous/lo of Petroleum- providers • Decomposes oil ng term based oil •Distribution polluted water •No energy cost to use •Suppliers of •Fast Remediation precursor •IP protection •Partner/other •Recoverable material distribution •R&D capability •Customizationn channels •Risk reduction •Brand •Distributors •Convenience/ •Expertise usability •Dealers/Partners •Marketing •Sale of nanogrids™ © per square foot •R&D costs • First to market; premium revenues •Manufacturing costs •Licensing other IP (c) copyright 2011
- 3. Testing the Hypotheses Building Blocks Testing Customer Segments Oil-spill Remediation Companies Value Propositions New Product in a Niche Market Key Partnerships Dealers and Distributors Key Resources IP protection/Know-How/R&D Key Activities Pilot Scale Studies / Marketing Customer Relationships Continuous / Expanding their Services Channels Direct-Partner / Dealer/ Distributor Cost Structure Manufacturing/Marketing/R&D Revenue Streams Product Sales / IP licensing
- 4. Here’s What We Did •Came up with different packaging options for our product • Contacted 30 potential customers about our product • Tried to Recruit Members for IAB • Calculated the Cost of In-House Manufacturing • Draw a Revenue Model for Our Company Packaging options •Rolls of fabric-like material • Blankets • Pads /mats
- 5. Here’s What We Found Our Product* Estimated Cost Existing Product in Market Rolls of fabric-like material $10 U*** (Sold per square foot) Oil Absorbent $ 20 Blankets (3x2 .5 feet) $50 P***Oil-Only Weighted Absorbent Blanket $ 112 Pads mat for small spill $30 B*** INDUSTRIES Buff Oil (15" x 18“) Absorb Pads $ 51 * Our product description: • new nanotechnology that collects & decomposes oil in water, in-situ • It can hold oil up to 20 times its weight, floats in water, and uses sunlight to break down hydrocarbons into eco friendly products
- 6. Responses to Our Cost Survey “I feel your purchase prices are too high for the mass of the remediation market. For a massive spill of 100,000 gallons or more, the cost would compare unfavorable with skimming and transporting for reclamation. For small spills your product is in competition with the cost of conventional absorbents plus landfill disposal. In this case, your $10 per sq. foot compares with $10-16 per ton landfill disposal.” Dan Gray, Hepaco Inc., Tucker, GA. “I think that the pricing is right on, I think it shouldn’t be very difficult to sell the fabric, especially since its eco-friendly. Would these then, in theory, be able to be thrown in the trash along with MSW? Here on LI most of our garbage is burned, what type of off gasses are produced when these are incinerated? Also, would this product work on water/ocean/river spills?” James Cressy, Project Manager, Impact Environmental
- 7. Revenue Chart First year revenues: 20 SME of $100,000 sales/year= $2M 60 2 LC of $1M /year =$2M first year revenues : $4M 50 Second year revenues: 75% retention of SME 15 SME of $150,000 sales/year= $2.25M 2 LC: $5M sales/year ( 40 second year revenues $7,25M $ Third year revenues: M 30 maintain the domestic levels with existing ) customers but expand international sales to $3.5M This will set us over $10M 20 Fourth year revenues: Add new line of products for existing market; expand into adjacent markets 10 (off-site remediation; water purification; etc) Revenues to reach $50M 0 Year 1 Year 2 Year 3 Year 4
- 8. Payment & Order Flow Dealer •Dealer invoices Customer customer and delivers product •Customer pays •Dealer sends the invoice purchase order to •Direct Sale to either directly to the distributor for Customer the company or fulfillment •Sale to to the dealer/distributor Dealer/Distrib utor Distributor •Distributor packages the order and ships it to customer