3R Environmental considerations
SUSWA K-Ex, Kajiado, 31 October 2012
Luuk Fleskens
Water source site management
Wider environmental management
Resource use patterns
Diversification of sources and uses
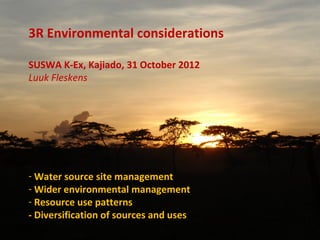
7. Cash Income from Firewood Collection and
Charcoal Making, 2003-05
CASH INCOME FROM FIREWOOD AND CHARCOAL
(percent of total income)
> 20
10 - 20
5 - 10
0-5
No cash income from charcoal and firewood
OTHER FEATURES
District boundaries
Major national parks and reserves (over 5,000 ha)
Water bodies
Source: ALRMP et al. 2006
8. Firewood collection
Transect
5 x 45 m
Zone
Settle
ment
Use of firewood (500kg cap/year)
Use of firewood (500kg cap/year)
Use of wood in buildings and fences
Use of wood in buildings and fences
(6,000kg per household)
(6,000kg per household)
Annual increment
Annual increment
Growth of populations
Growth of populations
(people and livestock)
(people and livestock)
Banks et al., 1996. Wood supply and demand around two rural settlements in a semi-
arid savanna, South Africa. Biomass and Bioenergy 11: 319-331
9. Field surveys of biomass of savannas
• Savanna = open vegetation with mix of trees, shrubs and grass
• A biomass survey could look at each component
Can you think of some characteristics of savannas that pose
opportunities or threats to field biomass surveys?
NB there are also
NB there are also
remote sensing methods
remote sensing methods
19. Butt (2010) Land degradation and development
Observations Karoo, South Africa MAP = 200mm
Todd (2006) J. Appl. Ecology 43, 293-304.
20. Exercise resource use patterns
1. What general adaptive management strategies can
pastoralists use?
2. What examples of specific activities do Maasai have for each
strategy?
3. Which of the strategies/activities would you classify as 3R?
21. Diversification of uses and sources
Lessons from WASHEC?
Diversification: where and how?
22. Assessment of 3R alternatives
Many 3R activities require investment (resources,
time)
Those resources could have been used for other
(more pressing) activities
Benefits occur mostly in the long run
Under these circumstances the important question is:
is it worthwhile?
24. Stakeholder accounts
Not all costs and benefits are borne by the same people
Carefully look at individual (group) perspectives
SUSWA project contributions
BUT for spontaneous adoption: financial analysis must take all
costs and benefits into account
Return to labour is an important factor
25. Building an account
• Investment
• Maintenance
• Production
Compare ‘with’ with a without situation
26. Wrap up
Stakes in diversification (community / AMREF / WASH Alliance)?
Opportunities for experiential learning?
Having a first go at developing 3R for a practical case
3R = thinking in terms of environmental opportunities
Sources: Administrative boundaries (CBS 2003), cities (SoK and ILRI 2000), water bodies (FAO 2000), and share of cash income from firewood collection and charcoal making (ALRMP et al. 2006). Caption: Charcoal production and firewood collection is an important economic activity in Kenya. The sector contributes to income in most areas, except the more remote locations that have very little woody vegetation (e.g., parts of Marsabit District). These activities are also not a significant source of income in selected communities in the central part of the country and directly along the Indian Ocean (although households may still collect firewood or produce charcoal for their own use). The majority of households in communities located about 50 kilometers inland from Mombasa (in Kwale District) obtain more than 20 percent of their cash from firewood and charcoal. Income from firewood and charcoal ranges between 10 and 20 percent of total income in the coastal hinterlands close to Malindi. Communities in the west (slightly inland from Lake Victoria) and along the Tana River (close to Garissa) show similarly high percentages. Charcoal from mathenge ( Prosopis juliflora , also known as mesquite), an invasive shrub that is cleared from the land to save pasture, is the main source for this cash in Garissa District. Note: Data are based on questionnaires sent to key food security experts in all Districts (generally about 6-10 people) to obtain information on predominant livelihood characteristics important for food security planning. In some cases where further clarification was necessary, questionnaires were sent to experts below District level (Division). This group of experts classified each of Kenya’s 6,632 Sublocations by their predominant livelihood strategy and other livelihood characteristics including different sources of cash income.