SlideShare una empresa de Scribd logo
1 de 17
E-mail: shakehandwithlife@gmail.com, narender@shakehandwithlife.in 
ShakehandwithLife.in 
With MS-Excel commands and images of construction; Histogram, Pareto Chart, Scatter Diagram, 
Control Charts. Introduction of Kaizen and 5S.Practice Problems. MCQ’s Test Paper with Ans. Key. 
by
ShakehandwithLife.in www.shakehandwithlife.in Page i 
7QC Tools 
E-Book Code: 7QCTT 
Telephonic Training + e-book+ login Id and password of your Online Study Room 
To 
Practice MCQ’s test paper, Online assignments, Discussion forum 
and many more things to do……. 
. 
Visit: 
www.shakehandwithlife.in 
e-mail 
shakehandwithlife@gmail.com , narender@shakehandwithlife.in 
“Save Paper, Save Trees, Save Environment”
ShakehandwithLife.in www.shakehandwithlife.in Page ii 
Dedicated to my loving parents 
(Sh. Somdutt Sharma) and (Smt. Urmila Devi).
ShakehandwithLife.in www.shakehandwithlife.in Page iii 
Salient features of the Book 
The workshop is specially designed and prepared 
for senior, middle and junior level quality 
professionals, engineers, managers of 
manufacturing and service industries. 
Graphics in the workshop elucidates the text and 
help to better understand the tools. 
Excel Images for Histogram, Pareto Analysis, Scatter 
diagram and Control charts are given with excel 
commands. This helps the learner to work easy in 
excel while construction the tools. 
Illustrative worked examples with manual 
calculation for better understanding. 
Data based practical problems for self practice. 
Project work based on 7QC Tools. 
Test paper with Multiple Choice Questions to check 
learning. 
Introduction of Kaizen and 5-S.
ShakehandwithLife.in www.shakehandwithlife.in Page iv 
About Author 
Narender Sharma has worked with a leading container glass manufacturing organization since 2001 to 2014 as a quality 
professional. He passed his B.Sc. (Mathematics, Physics and Electronics) in 1997. After passing his B.Sc. he had been in school 
education since 1997. In 2001 he successfully completed his B.Ed. in (Teaching of mathematics and teaching of Science). But he 
did not remain in the field of school teaching and enter into corporate life. In 2008 he completed his course work for MBA 
(Production and Operation Management) along with his job. He has gone under various training programs like Six Sigma Green 
Belt, ISO9001:2008, Internal Auditor Course. Teaching gives him immense pleasure ‘cause he understands that in this area we 
are not only teaching but learning also and expand our boundary of knowledge from our next generation. He writes blogs, 
makes sketches, read books as his part of hobby. 
Presently he is working on E-Learning through his website ; www.shakehandwithlife.in . 
Narender Sharma tried to put his all experience and knowledge gained from his work and study area. 
“It is very difficult to make things easy to understand by others and I sincerely do this by designing graphics in this book. If you 
still find difficult to understand these tools, definitely I need to work more hard to make things easier. The book contains not 
only the theoretical concept of all 7 QC tools but the practical application with illustrative worked examples and construction of tools like Histogram, Pareto Chart, 
Scatter diagram, Control charts in MS Excel with help of commands and images also.” …………………..Narender Sharma 
The Trainer can be contacted at 
Website: www.shakehandwithlife.in 
E-Mail : narender@shakehandwithlife.in 
shakehandwithlife@gmail.com 
Facebook : www.facebook.com/shakehandwithlife 
SlideShare: www.slideshare.net/shakehandwithlife 
Google + : www.google.com/+narendersharma 
Linkedin : http://www.linkedin.com/pub/narender-sharma/1a/a95/872 
Twitter www.twitter.com/sharma_ndr 
Mobile : +91-9315132462 
Narender Sharma
ShakehandwithLife.in www.shakehandwithlife.in Page v 
Testimonials 
Awesome post this is such a great resource that you are providing and you give it away for free. I love seeing websites that understand the value of providing a 
quality resource for free…………….Rajesh Master 
Commented on the blog post “ Kaoru Ishikawa: Father of QCC” http://shakehandwithlife.blogspot.in/2013/04/kaoru-ishikawa-father-of-qcc.html 
Generally I do not learn article on blogs, but I would like to say that this write-up very compelled me to take a look at and do so! Your writing taste has been 
surprised me. Thanks, very great article………….William J. Cornett 
Commented on the blog post “Honesty is the Best Policy* - conditions apply” http://shakehandwithlife.blogspot.in/2012/01/honesty-is-best-policy-conditions-apply. 
html 
Very simple & hence nice explanation. When the line balancing is done Line of Balance need to be monitored for efficiency..............Pramod 
Nice explanation of Line Balancing. Make-times on each work station should, after they have been balanced, equal TAKT time. TAKT time is the average time 
between customer orders. If perfect balance can be obtained so that Make-Times are equal and are equal to TAKT Time then inventories will be 
minimised........Anonymous 
Commented on the blog post “Line Balancing Vs Line of Balance” http://shakehandwithlife.blogspot.in/2011/08/line-balancing-vs-line-of-balance.html 
I absolutely adore reading your blog posts, the variety of writing is smashing. This blog as usual was educational, I have had to bookmark your site and subscribe to 
your feed in ifeed. Your theme looks lovely. Thanks for sharing……….Iso9000 
Commented on the blog post “Correction , Corrective Action and Preventive Action with illustrations” http://shakehandwithlife.blogspot.in/2011/06/correction-corrective- 
action-and.html 
Wow! these two factor can change our life definitely. Such a nice blog, people should read this. Really very nice...............vk 
Commented on the blog post “Personality of person is same as an engine for a train.” http://shakehandwithlife.blogspot.in/2011/05/personality-of-person-is-same-as-engine. 
html 
Nice and comprehensive article on the use of six sigma in process improvement…………..Carl wright 
This site certainly has all the information I needed about this subject and didn’t know who to ask………..Anonymous 
Commented on the blog post “Six Sigma : A gauge of measuring goodness of our product, services and processes” http://shakehandwithlife.blogspot.in/2011/04/six-sigma- 
gauge-of-measuring-goodness.html 
Hi, Mr. Sharma, It is really touching for me ........after reading there are some tears in my eyes, some thing is very true in that blog.......thanks for writing .......Keep 
rocking and writing Thanks……………Anonymous 
Commented on the blog post “I am here because she was there..........” http://shakehandwithlife.blogspot.in/2011/03/i-am-here-because-she-was-there.html 
Thank you Narender. What you have said makes perfect sense and a great antidote for those who confuse loving with being loved……Val Mckie 
Commented on the blog post “Love: A sense of Responsibility” http://shakehandwithlife.blogspot.in/2011/02/love-sense-of-responsibility.html
ShakehandwithLife.in www.shakehandwithlife.in Page vi 
Nice information. keep it up……………..Anonymous 
Commented on the blog post “AIDS: Striking on Backbone of Nation” http://shakehandwithlife.blogspot.in/2010/11/aids-striking-on-backbone-of-nation.html 
Good one ...........but usually girls are not so much logical as explained in the story in deciding their partners.......anyhow interesting story explaining significance of 
stats in human life.....................Anonymous 
WOW... just hope it could be as true and as easy as depicted by this example... nonetheless, stats always allow you to reach a point :))………………..Praveen 
Good one.... But may be we should give other two guys chance to reduce the variation by carrying DMAIC and lets observe the improvement……….Manish Rawat 
Commented on the blog post “Statistics of Love” http://shakehandwithlife.blogspot.in/2010/10/statistics-of-love.html 
Εxcellent blog pοst. I аbsоlutely lovе thiѕ websіte. Contіnuе thе good work……………..Anonymous 
Excellent Narender!!! Would like to learn more………………Anonymous 
Commented on the blog post “5S : Best Management Practices from Kitchen to workplace.” http://shakehandwithlife.blogspot.in/2010/09/5s-best-management-practices- 
from.html
ShakehandwithLife.in www.shakehandwithlife.in Page vii 
Click on Contents 
Introduction ...................................................................................................................................................................................................................................... 1 
Tool No. 1 – Process Flow Diagram ................................................................................................................................................................................................. 2 
What is Process Flow Diagram? .................................................................................................................................................................................................................................................................... 2 
Application and uses of Process Flow Diagram ...................................................................................................................................................................................................................................... 3 
Value Added Steps .......................................................................................................................................................................................................................................... 3 
Non- Value Added Steps ................................................................................................................................................................................................................................. 3 
Construction of Process Flow Diagram ...................................................................................................................................................................................................................................................... 5 
Illustrative Work Examples ............................................................................................................................................................................................................................................................................. 6 
Measuring Cycle Time .................................................................................................................................................................................................................................................................................... 10 
Process Efficiency ............................................................................................................................................................................................................................................................................................. 10 
Tool No. 2 – Check Sheet ................................................................................................................................................................................................................ 11 
What is Check Sheet? ...................................................................................................................................................................................................................................................................................... 11 
Application and uses of Check Sheet ........................................................................................................................................................................................................................................................ 11 
Construction of Check Sheet ........................................................................................................................................................................................................................................................................ 11 
Illustrative Worked Examples..................................................................................................................................................................................................................................................................... 12 
Tool No. 3 – Histogram ...................................................................................................................................................................................................................14 
What is Histogram? ......................................................................................................................................................................................................................................................................................... 14 
Histogram Shapes ......................................................................................................................................................................................................................................... 14 
Application and uses of Histogram ........................................................................................................................................................................................................................................................... 15 
Construction of Histogram ........................................................................................................................................................................................................................................................................... 15 
Histogram For Ungrouped Data ................................................................................................................................................................................................................... 15 
Histogram for Grouped data ........................................................................................................................................................................................................................ 16 
Illustrative Worked Examples..................................................................................................................................................................................................................................................................... 17 
Construction of Histogram in Excel .......................................................................................................................................................................................................................................................... 19 
Tool No. 4 – Pareto Diagram ..........................................................................................................................................................................................................21
ShakehandwithLife.in www.shakehandwithlife.in Page viii 
What is Pareto Diagram? ............................................................................................................................................................................................................................................................................... 21 
Who was Pareto? ......................................................................................................................................................................................................................................... 21 
ABC Analysis. ................................................................................................................................................................................................................................................ 22 
80 – 20 Rule .................................................................................................................................................................................................................................................. 22 
Application and uses of Pareto Diagram ...................................................................................................................................................................................................... 22 
Manual Construction of Pareto Chart....................................................................................................................................................................................................................................................... 23 
Construction of Pareto Chart in Excel ...................................................................................................................................................................................................................................................... 24 
Illustrative Worked Example ....................................................................................................................................................................................................................................................................... 27 
Tool No. 5 – Cause and Effect Diagram ......................................................................................................................................................................................... 28 
What is Cause and Effect diagram? ........................................................................................................................................................................................................................................................... 28 
Application and uses of C&E Diagram ..................................................................................................................................................................................................................................................... 29 
Construction of Cause and Effect Diagram ............................................................................................................................................................................................................................................ 30 
Brainstorming ............................................................................................................................................................................................................................................... 30 
Essentials for organizing Brainstorming sessions to get more accurate and usable result ......................................................................................................................... 30 
Illustrative Worked Example ....................................................................................................................................................................................................................................................................... 31 
Tool No. 6 Scatter Diagram ............................................................................................................................................................................................................ 33 
What is Scatter Diagram? .............................................................................................................................................................................................................................................................................. 33 
Application and uses of scatter diagram................................................................................................................................................................................................................................................. 33 
Interpretation of Different Patterns of Scatter Diagram .................................................................................................................................................................................................................. 34 
Algebraic value of relationship between two variables (X and Y) i.e. Correlation Coefficient ........................................................................................................................................ 36 
Karl Pearson’s Coefficient of Correlation (r). ....................................................................................................................................................................................................................................... 36 
Interpretation of value of 'r' ......................................................................................................................................................................................................................... 37 
Construction of Scatter diagram ............................................................................................................................................................................................................................................................... 38 
Illustrative Worked Examples..................................................................................................................................................................................................................................................................... 39 
Construction of Scatter Diagram in Excel ............................................................................................................................................................................................................................................... 41 
Calculation of Coefficient of Correlation (r) ................................................................................................................................................................................................. 43
ShakehandwithLife.in www.shakehandwithlife.in Page ix 
Tool No. 7 Control Chart ................................................................................................................................................................................................................ 44 
What is Control Chart? ................................................................................................................................................................................................................................................................................... 44 
Types of Charts ............................................................................................................................................................................................................................................. 45 
Mean Charts ................................................................................................................................................................................................................................................. 45 
Run Charts .................................................................................................................................................................................................................................................... 45 
Accuracy and Precision .................................................................................................................................................................................................................................................................................. 46 
Archer’s Bow and Target analogy for understanding accuracy and precision ............................................................................................................................................. 47 
Application and uses of Control Charts ................................................................................................................................................................................................................................................... 48 
Continuous Use of Control Charts, Showing Improved Quality .................................................................................................................................................................................................... 49 
Construction of Control Charts ................................................................................................................................................................................................................................................................... 50 
Steps of Construction of Mean Chart ........................................................................................................................................................................................................... 50 
Steps of construction of Run/Range charts .................................................................................................................................................................................................. 51 
Illustrative Worked Example ....................................................................................................................................................................................................................................................................... 52 
Construction of Control Chart in Excel .................................................................................................................................................................................................................................................... 56 
Mean Chart ................................................................................................................................................................................................................................................... 57 
Range Chart ................................................................................................................................................................................................................................................. 59 
Problems for Practice ......................................................................................................................................................................................................................61 
Project work : Reduce monthly electricity bill by 50% using 7qc tools .......................................................................................................................................... 63 
Test Paper ....................................................................................................................................................................................................................................... 65 
Answer Key ...................................................................................................................................................................................................................................... 71 
Result .............................................................................................................................................................................................................................................. 72 
Introduction of Kaizen ................................................................................................................................................................................................................... 73 
What is Kaizen? ................................................................................................................................................................................................................................................................................................. 73 
Foundation for Kaizen: ................................................................................................................................................................................................................................................................................... 73 
Kaizen Strategy .................................................................................................................................................................................................................................................................................................. 74 
Kaizen Practices ................................................................................................................................................................................................................................................................................................ 75
ShakehandwithLife.in www.shakehandwithlife.in Page x 
Introduction of 5 S .......................................................................................................................................................................................................................... 76 
What is 5S? .......................................................................................................................................................................................................................................................................................................... 76 
Why does 5S practice useful? ...................................................................................................................................................................................................................................................................... 77 
How to implement 5S? .................................................................................................................................................................................................................................................................................. 77 
References ...................................................................................................................................................................................................................................... 78 
Feedback ......................................................................................................................................................................................................................................... 78
7QC Tools : Introduction 
ShakehandwithLife.in www.shakehandwithlife.in Page 1 
Introduction 
Fundamental Tools to solve 95% quality related problems 
These seven effective methods or tools which will offer any organization means of collecting, presenting, and analyzing most 
of its data problems. 95% of quality related problems in the factory can be solved with these 7 fundamental quality tools. 
Developed by 
The Seven QC tools were developed by Prof. Kaoru Ishikawa, ‘The father of QCCs’ (Quality Control Circle). Through his 
experience, he identifies a set of tools which can be used by teams and individuals to interpret the data fully and derive the 
maximum information out from it. 
Can be used by 
Business owners, Junior, Middle and Senior level quality professionals, Engineers, Managers in different kind of 
manufacturing and service industries, Sports, Research. 
Applied in 
Production ,Quality Control, Warehouse , Sales and Purchase, Personnel Management, Storekeeping, Marketing , Service delivery, Housekeeping, Accounting, 
Banking , Airline, Insurance, Telecommunication, Medical and healthcare, Education and so on……. 
Applied by an individual or team in 
Process Audit, Data Collection and Analysis, Data presentation, Identifying Critical Issues, Identification of root causes, Brain Storming, Quality control , Process 
Control, Problem solving , Decision Making, Continual Improvement , Maintaining Accuracy and Precision, Kaizen Activities, Six Sigma projects, Cost reduction 
Business Research etc…. 
Getting expertise in various skills while using 7QC Tools 
Control over the process, Finding value added and Non value added activities, Reducing cycle time, Learning of data collection techniques, Smart presentation of 
data, Tracking the most appropriate cause for a problem, Dig out the root cause for a problem, Calculation of degree of relation between cause and effect of a 
problem, Accuracy of results, data analytic skills, Comparing past and future trends of data with present, Learning statistics process control, MS-Excel.
7QC Tools : Process Flow Diagram 
ShakehandwithLife.in www.shakehandwithlife.in Page 2 
Tool No. 1 – Process Flow Diagram 
What is Process Flow Diagram? 
Process flow diagram is a symbolic representation of all steps of whole process through which any product or service move. 
All steps of process shown diagrammatically in a sequential manner. Process flow diagram can easily be seen nearby the actual process in the organization.
7QC Tools : Process Flow Diagram 
ShakehandwithLife.in www.shakehandwithlife.in Page 3 
Application and uses of Process Flow Diagram 
It uses to clearly define and analyzing the processes. 
Step by Step picture of the process use for the purpose of analysis, discussion or communication. 
It uses for standardization of the process. 
It uses for locating the areas of improvement in the process. 
It uses for the purpose of training and development of new employees before working on actual process. 
Process flow diagram improve the efficiency of process 
The diagram makes it easy to visualize the entire system, identify potential trouble spots, and locate control activities. 
It answers the question, “Who/What is next?” 
Improvements can be accomplished by changing, reducing, combining or eliminating steps. 
It helps to finding NVA ( Non Valuable Activities) tasks and their elimination. 
It helps to avoid the duplication of the work. 
Its helps to avoid unnecessary activities. 
Total cycle time and time per activity can be calculated with help of process flow diagram. 
Idle time between two steps or throughout the process can be calculated and eliminated. 
To elude repetition of work. 
Value Added Steps 
Customers are willing to pay for it 
It physically changes the product 
It’s done right the first time 
Example value added activities; Entering order, ordering materials preparing drawing, Assembling, Mandatory testing, packaging, Shipping to customer. 
Non- Value Added Steps 
Not essential to produce output 
Does not add value to the output. 
Example activities : Waiting, Storing , Staging, Counting, Inspecting, Recording, Obtaining approvals, Testing, Reviewing, Copying, Filing, Reworking, 
Tracking
7QC Tools : Process Flow Diagram 
ShakehandwithLife.in www.shakehandwithlife.in Page 4 
Symbols use to make process flow diagram are 
Rounded Rectangle uses for Start or Terminate the process 
Rectangle like symbol uses for an operation. Any kind of activity on product is comes under 
operation. It indicates main steps in a process, method or procedure. Usually the part , material , 
or product concerned is modified or changed during operation, e.g. In a garment industry the 
cloth passes under different kind of operation like stitching, washing, folding, press, 
embroidery, making border etc. similarly in an Insurance industry to do an Insurance policy of a 
customer different kind of operation are collecting data of the customer, filling the form, 
printing the form, dispatch the form, collection of payments etc. 
Diamond like symbol uses for decision or any condition like “yes or no, OK or Not OK”. If the 
condition satisfied or the decision is ‘yes’ then process move with arrow coming out in forward 
direction otherwise follow the arrow coming our left or right 
An arrow like symbol uses for the purpose of sequence flow of the process. It connect each step 
and helps to read the Flow Chart. 
‘D’ like symbol uses for the ‘Delay’. This show the temporary hold for any correction or wait. 
Inverted Triangle uses for the storage of the product. When product do not go for any further 
operation or the product has passed all the stages of process then product needs to be stored at 
some specific place then this stage of the process will be shown by the inverted triangle in the 
process diagram. 
Note : 
There are many other symbols use to make process flow diagram. But most of time only these symbols shown above are use . 
Some time Round shape is used for operation instead of Rectangle. This is because there is no standard rule for using symbols to make process flow 
diagram. Different organization and different department using symbols according to there technical areas. Some time they make there own symbols. But 
still the basic rule of process flow diagram is same and very much necessary to learn by all quality professionals.
7QC Tools : Process Flow Diagram 
ShakehandwithLife.in www.shakehandwithlife.in Page 5 
Construction of Process Flow Diagram 
Steps of construction of process flow diagram. 
1. Make the team of those persons related to the process. 
2. Fix the Start and End point to create the boundaries of the process. 
 Where does the process begin? 
 Where does the process terminate? 
3. Write down all the steps of the process 
separately. 
 Write down Activities, Decision points or 
conditions, store or delay points. 
 Write the connecting sequences of all steps 
explaining the process flow. 
4. Select proper symbol for each step of the process. 
5. Put all the symbols at one place. 
6. Connect all the symbols by arrows in a proper 
sequence flow. 
7. No. the steps of process and time elapse in each 
step to calculate cycle time. 
8. Write mandatory Heading on the process flow 
diagram. 
 Task 
 Starting point of the diagram 
 Terminating point of the diagram 
 Process diagram made by 
 Date of Charting/Making 
9. Finalize the process diagram 
 Confirm the process is actually working in the same way as designed. 
 People related to the process are following the process as charted. 
 Make a consensus among all members on designed process diagram. 
 If any logical suggestion then remove the extra step and add if any step is missing.
7QC Tools : Process Flow Diagram 
ShakehandwithLife.in www.shakehandwithlife.in Page 6 
Illustrative Work Examples 
Example 1. Prepare Process flow diagram of Tea Making in kitchen. 
Title/ Task :Tea Making in Kitchen Starting Point : Ignite the Burner End Point: Close the Burner 
Process Diagram Made by : Narender Sharma Date of Charting : 
Summary 
Event 
Sequence Flow 
Frequency 2 10 1 15 
Start/End Activity 
Decision 
n

Más contenido relacionado

La actualidad más candente

PPT Presentation on IATF 16949 Documentation
PPT Presentation on IATF 16949 DocumentationPPT Presentation on IATF 16949 Documentation
PPT Presentation on IATF 16949 DocumentationGlobal Manager Group
 
7 QC Tools PDF | An eBook with A Detailed Description and Practical Examples
7 QC Tools PDF | An eBook with A Detailed Description and Practical Examples7 QC Tools PDF | An eBook with A Detailed Description and Practical Examples
7 QC Tools PDF | An eBook with A Detailed Description and Practical ExamplesShakehand with Life
 
Training ppt for control plan
Training ppt for control plan   Training ppt for control plan
Training ppt for control plan Jitesh Gaurav
 
8 D – Problem Solving Process
8 D – Problem Solving Process8 D – Problem Solving Process
8 D – Problem Solving ProcessAnand Subramaniam
 
Measurement System Analysis (MSA)
Measurement System Analysis (MSA)Measurement System Analysis (MSA)
Measurement System Analysis (MSA)Ram Kumar
 
Statistical Process Control for SMT Electronic Manufacturing
Statistical Process Control for SMT Electronic ManufacturingStatistical Process Control for SMT Electronic Manufacturing
Statistical Process Control for SMT Electronic ManufacturingBill Cardoso
 
7 qc tools[1] to print
7 qc tools[1] to print7 qc tools[1] to print
7 qc tools[1] to printJitesh Gaurav
 
Poka Yoke in Manufacturing
Poka Yoke in Manufacturing Poka Yoke in Manufacturing
Poka Yoke in Manufacturing Prachi Sharma
 
Business process mapping
Business process mappingBusiness process mapping
Business process mappingDAVIS THOMAS
 

La actualidad más candente (20)

PPT Presentation on IATF 16949 Documentation
PPT Presentation on IATF 16949 DocumentationPPT Presentation on IATF 16949 Documentation
PPT Presentation on IATF 16949 Documentation
 
7 qc tools
7 qc tools7 qc tools
7 qc tools
 
7 QC Tools
7 QC Tools7 QC Tools
7 QC Tools
 
7 qc tools
7 qc tools7 qc tools
7 qc tools
 
7 QC Tools PDF | An eBook with A Detailed Description and Practical Examples
7 QC Tools PDF | An eBook with A Detailed Description and Practical Examples7 QC Tools PDF | An eBook with A Detailed Description and Practical Examples
7 QC Tools PDF | An eBook with A Detailed Description and Practical Examples
 
Training ppt for control plan
Training ppt for control plan   Training ppt for control plan
Training ppt for control plan
 
8 D – Problem Solving Process
8 D – Problem Solving Process8 D – Problem Solving Process
8 D – Problem Solving Process
 
Internal rejection
Internal rejectionInternal rejection
Internal rejection
 
8D Problem Solving Poster
8D Problem Solving Poster8D Problem Solving Poster
8D Problem Solving Poster
 
PPAP
PPAPPPAP
PPAP
 
Measurement System Analysis (MSA)
Measurement System Analysis (MSA)Measurement System Analysis (MSA)
Measurement System Analysis (MSA)
 
Statistical Process Control for SMT Electronic Manufacturing
Statistical Process Control for SMT Electronic ManufacturingStatistical Process Control for SMT Electronic Manufacturing
Statistical Process Control for SMT Electronic Manufacturing
 
Spc
SpcSpc
Spc
 
7 qc tools[1] to print
7 qc tools[1] to print7 qc tools[1] to print
7 qc tools[1] to print
 
Seven QC Tools Training; Quiz
Seven QC Tools Training; QuizSeven QC Tools Training; Quiz
Seven QC Tools Training; Quiz
 
Poka Yoke in Manufacturing
Poka Yoke in Manufacturing Poka Yoke in Manufacturing
Poka Yoke in Manufacturing
 
Business process mapping
Business process mappingBusiness process mapping
Business process mapping
 
8D analysis presentation
8D analysis presentation8D analysis presentation
8D analysis presentation
 
7 QC Tools
7 QC Tools7 QC Tools
7 QC Tools
 
Spc training
Spc training Spc training
Spc training
 

Similar a 7 qc toolsTraining pdf

ASP.NET MVC Interview Questions and Answers by Shailendra Chauhan
ASP.NET MVC Interview Questions and Answers by Shailendra ChauhanASP.NET MVC Interview Questions and Answers by Shailendra Chauhan
ASP.NET MVC Interview Questions and Answers by Shailendra ChauhanShailendra Chauhan
 
Why do we automate?
Why do we automate?Why do we automate?
Why do we automate?Bas Dijkstra
 
Examples Of Narrative Essays For College.pdf
Examples Of Narrative Essays For College.pdfExamples Of Narrative Essays For College.pdf
Examples Of Narrative Essays For College.pdfAndrea Warner
 
Asp.net mvc interview questions & answers by shailendra chauhan
Asp.net mvc interview questions & answers   by shailendra chauhanAsp.net mvc interview questions & answers   by shailendra chauhan
Asp.net mvc interview questions & answers by shailendra chauhanMasterCode.vn
 
002 One Page Essay What Is The Mla Format For Ess
002 One Page Essay What Is The Mla Format For Ess002 One Page Essay What Is The Mla Format For Ess
002 One Page Essay What Is The Mla Format For EssAngela Hays
 
template power point
template power pointtemplate power point
template power pointKaisalWisnu
 
How To Write Essay Fast.pdf
How To Write Essay Fast.pdfHow To Write Essay Fast.pdf
How To Write Essay Fast.pdfBrittany Koch
 
Sharma narender; a brief profile
Sharma narender; a brief profileSharma narender; a brief profile
Sharma narender; a brief profileShakehand with Life
 
Web 2.0 : Exploring the Cloud
Web 2.0 : Exploring the CloudWeb 2.0 : Exploring the Cloud
Web 2.0 : Exploring the Cloudcarindaherren
 
Writing a Story.pptx
Writing a Story.pptxWriting a Story.pptx
Writing a Story.pptxarun kumar
 
Fundamentals of Azure
Fundamentals of AzureFundamentals of Azure
Fundamentals of AzureFenilDesai11
 
The Topic Sentence Is A Key Element To Writing On Topic.
The Topic Sentence Is A Key Element To Writing On Topic.The Topic Sentence Is A Key Element To Writing On Topic.
The Topic Sentence Is A Key Element To Writing On Topic.Toya Shamberger
 
Web 2 0_tools_sp11_group_d
Web 2 0_tools_sp11_group_dWeb 2 0_tools_sp11_group_d
Web 2 0_tools_sp11_group_dKlatacha
 
Web 2.0 Tools, Sp11, Group D
Web 2.0 Tools, Sp11, Group DWeb 2.0 Tools, Sp11, Group D
Web 2.0 Tools, Sp11, Group Dpjames731
 
Web 2 0_tools_sp11_group_d
Web 2 0_tools_sp11_group_dWeb 2 0_tools_sp11_group_d
Web 2 0_tools_sp11_group_dKlatacha
 
Group D Web 2.0 Exploring the Cloud
Group D Web 2.0 Exploring the CloudGroup D Web 2.0 Exploring the Cloud
Group D Web 2.0 Exploring the Cloudabbeylogan
 
Web 2 0_tools_sp11_group_d
Web 2 0_tools_sp11_group_dWeb 2 0_tools_sp11_group_d
Web 2 0_tools_sp11_group_dKlatacha
 

Similar a 7 qc toolsTraining pdf (20)

Sweating the UX Details
Sweating the UX DetailsSweating the UX Details
Sweating the UX Details
 
Ssis integration
Ssis integrationSsis integration
Ssis integration
 
ASP.NET MVC Interview Questions and Answers by Shailendra Chauhan
ASP.NET MVC Interview Questions and Answers by Shailendra ChauhanASP.NET MVC Interview Questions and Answers by Shailendra Chauhan
ASP.NET MVC Interview Questions and Answers by Shailendra Chauhan
 
Why do we automate?
Why do we automate?Why do we automate?
Why do we automate?
 
Examples Of Narrative Essays For College.pdf
Examples Of Narrative Essays For College.pdfExamples Of Narrative Essays For College.pdf
Examples Of Narrative Essays For College.pdf
 
presentacion
presentacionpresentacion
presentacion
 
Asp.net mvc interview questions & answers by shailendra chauhan
Asp.net mvc interview questions & answers   by shailendra chauhanAsp.net mvc interview questions & answers   by shailendra chauhan
Asp.net mvc interview questions & answers by shailendra chauhan
 
002 One Page Essay What Is The Mla Format For Ess
002 One Page Essay What Is The Mla Format For Ess002 One Page Essay What Is The Mla Format For Ess
002 One Page Essay What Is The Mla Format For Ess
 
template power point
template power pointtemplate power point
template power point
 
How To Write Essay Fast.pdf
How To Write Essay Fast.pdfHow To Write Essay Fast.pdf
How To Write Essay Fast.pdf
 
Sharma narender; a brief profile
Sharma narender; a brief profileSharma narender; a brief profile
Sharma narender; a brief profile
 
Web 2.0 : Exploring the Cloud
Web 2.0 : Exploring the CloudWeb 2.0 : Exploring the Cloud
Web 2.0 : Exploring the Cloud
 
Writing a Story.pptx
Writing a Story.pptxWriting a Story.pptx
Writing a Story.pptx
 
Fundamentals of Azure
Fundamentals of AzureFundamentals of Azure
Fundamentals of Azure
 
The Topic Sentence Is A Key Element To Writing On Topic.
The Topic Sentence Is A Key Element To Writing On Topic.The Topic Sentence Is A Key Element To Writing On Topic.
The Topic Sentence Is A Key Element To Writing On Topic.
 
Web 2 0_tools_sp11_group_d
Web 2 0_tools_sp11_group_dWeb 2 0_tools_sp11_group_d
Web 2 0_tools_sp11_group_d
 
Web 2.0 Tools, Sp11, Group D
Web 2.0 Tools, Sp11, Group DWeb 2.0 Tools, Sp11, Group D
Web 2.0 Tools, Sp11, Group D
 
Web 2 0_tools_sp11_group_d
Web 2 0_tools_sp11_group_dWeb 2 0_tools_sp11_group_d
Web 2 0_tools_sp11_group_d
 
Group D Web 2.0 Exploring the Cloud
Group D Web 2.0 Exploring the CloudGroup D Web 2.0 Exploring the Cloud
Group D Web 2.0 Exploring the Cloud
 
Web 2 0_tools_sp11_group_d
Web 2 0_tools_sp11_group_dWeb 2 0_tools_sp11_group_d
Web 2 0_tools_sp11_group_d
 

Más de Shakehand with Life

Process Decision and Program Chart
Process Decision and Program ChartProcess Decision and Program Chart
Process Decision and Program ChartShakehand with Life
 
New 7 QC Tools Module 5 | Prioritization matrices
New 7 QC Tools Module 5 | Prioritization matricesNew 7 QC Tools Module 5 | Prioritization matrices
New 7 QC Tools Module 5 | Prioritization matricesShakehand with Life
 
New 7 QC Tools Module 4 | Matrix diagram
New 7 QC Tools Module 4 | Matrix diagramNew 7 QC Tools Module 4 | Matrix diagram
New 7 QC Tools Module 4 | Matrix diagramShakehand with Life
 
New 7 QC Tools Module 3 | Tree diagram
New 7 QC Tools Module 3 | Tree diagramNew 7 QC Tools Module 3 | Tree diagram
New 7 QC Tools Module 3 | Tree diagramShakehand with Life
 
New 7 QC Tools Module 2 | Interrelationship Digraph
New 7 QC Tools Module 2 | Interrelationship DigraphNew 7 QC Tools Module 2 | Interrelationship Digraph
New 7 QC Tools Module 2 | Interrelationship DigraphShakehand with Life
 
New 7 QC Tools | 7 Management Development Tools
New 7 QC Tools | 7 Management Development ToolsNew 7 QC Tools | 7 Management Development Tools
New 7 QC Tools | 7 Management Development ToolsShakehand with Life
 
New 7 QC Tool-Module 1 | Affinity diagram
New 7 QC Tool-Module 1 | Affinity diagramNew 7 QC Tool-Module 1 | Affinity diagram
New 7 QC Tool-Module 1 | Affinity diagramShakehand with Life
 
7 qc tools and spc training, December. 2015
7 qc tools and spc training, December. 20157 qc tools and spc training, December. 2015
7 qc tools and spc training, December. 2015Shakehand with Life
 
Hypothesis testing; z test, t-test. f-test
Hypothesis testing; z test, t-test. f-testHypothesis testing; z test, t-test. f-test
Hypothesis testing; z test, t-test. f-testShakehand with Life
 
Seven QC Tools Training; Control Charts (Mean Chart and Range Chart)
Seven QC Tools Training; Control Charts (Mean Chart and Range Chart)Seven QC Tools Training; Control Charts (Mean Chart and Range Chart)
Seven QC Tools Training; Control Charts (Mean Chart and Range Chart)Shakehand with Life
 
Seven QC Tools Training; Scatter Diagram
Seven QC Tools Training; Scatter DiagramSeven QC Tools Training; Scatter Diagram
Seven QC Tools Training; Scatter DiagramShakehand with Life
 
Seven QC Tools Training; Process Flow Chart
Seven QC Tools Training; Process Flow ChartSeven QC Tools Training; Process Flow Chart
Seven QC Tools Training; Process Flow ChartShakehand with Life
 
Measure of dispersion part II ( Standard Deviation, variance, coefficient of ...
Measure of dispersion part II ( Standard Deviation, variance, coefficient of ...Measure of dispersion part II ( Standard Deviation, variance, coefficient of ...
Measure of dispersion part II ( Standard Deviation, variance, coefficient of ...Shakehand with Life
 
Measure of dispersion part I (Range, Quartile Deviation, Interquartile devi...
Measure of dispersion part   I (Range, Quartile Deviation, Interquartile devi...Measure of dispersion part   I (Range, Quartile Deviation, Interquartile devi...
Measure of dispersion part I (Range, Quartile Deviation, Interquartile devi...Shakehand with Life
 
Measure of central tendency (Mean, Median and Mode)
Measure of central tendency (Mean, Median and Mode)Measure of central tendency (Mean, Median and Mode)
Measure of central tendency (Mean, Median and Mode)Shakehand with Life
 
New Syllabus MBA 2yrs MDU DDE, Rohtak
New Syllabus MBA 2yrs MDU DDE, RohtakNew Syllabus MBA 2yrs MDU DDE, Rohtak
New Syllabus MBA 2yrs MDU DDE, RohtakShakehand with Life
 

Más de Shakehand with Life (20)

Activity Network diagram
Activity Network diagramActivity Network diagram
Activity Network diagram
 
Process Decision and Program Chart
Process Decision and Program ChartProcess Decision and Program Chart
Process Decision and Program Chart
 
New 7 QC Tools Module 5 | Prioritization matrices
New 7 QC Tools Module 5 | Prioritization matricesNew 7 QC Tools Module 5 | Prioritization matrices
New 7 QC Tools Module 5 | Prioritization matrices
 
New 7 QC Tools Module 4 | Matrix diagram
New 7 QC Tools Module 4 | Matrix diagramNew 7 QC Tools Module 4 | Matrix diagram
New 7 QC Tools Module 4 | Matrix diagram
 
New 7 QC Tools Module 3 | Tree diagram
New 7 QC Tools Module 3 | Tree diagramNew 7 QC Tools Module 3 | Tree diagram
New 7 QC Tools Module 3 | Tree diagram
 
New 7 QC Tools Module 2 | Interrelationship Digraph
New 7 QC Tools Module 2 | Interrelationship DigraphNew 7 QC Tools Module 2 | Interrelationship Digraph
New 7 QC Tools Module 2 | Interrelationship Digraph
 
New 7 QC Tools | 7 Management Development Tools
New 7 QC Tools | 7 Management Development ToolsNew 7 QC Tools | 7 Management Development Tools
New 7 QC Tools | 7 Management Development Tools
 
New 7 QC Tool-Module 1 | Affinity diagram
New 7 QC Tool-Module 1 | Affinity diagramNew 7 QC Tool-Module 1 | Affinity diagram
New 7 QC Tool-Module 1 | Affinity diagram
 
Course Catalog 2016 - 17
Course Catalog 2016 - 17Course Catalog 2016 - 17
Course Catalog 2016 - 17
 
7 qc tools and spc training, December. 2015
7 qc tools and spc training, December. 20157 qc tools and spc training, December. 2015
7 qc tools and spc training, December. 2015
 
Hypothesis testing; z test, t-test. f-test
Hypothesis testing; z test, t-test. f-testHypothesis testing; z test, t-test. f-test
Hypothesis testing; z test, t-test. f-test
 
Seven QC Tools Training; Control Charts (Mean Chart and Range Chart)
Seven QC Tools Training; Control Charts (Mean Chart and Range Chart)Seven QC Tools Training; Control Charts (Mean Chart and Range Chart)
Seven QC Tools Training; Control Charts (Mean Chart and Range Chart)
 
Seven QC Tools Training; Scatter Diagram
Seven QC Tools Training; Scatter DiagramSeven QC Tools Training; Scatter Diagram
Seven QC Tools Training; Scatter Diagram
 
Seven QC Tools Training; Process Flow Chart
Seven QC Tools Training; Process Flow ChartSeven QC Tools Training; Process Flow Chart
Seven QC Tools Training; Process Flow Chart
 
Measure of dispersion part II ( Standard Deviation, variance, coefficient of ...
Measure of dispersion part II ( Standard Deviation, variance, coefficient of ...Measure of dispersion part II ( Standard Deviation, variance, coefficient of ...
Measure of dispersion part II ( Standard Deviation, variance, coefficient of ...
 
Measure of dispersion part I (Range, Quartile Deviation, Interquartile devi...
Measure of dispersion part   I (Range, Quartile Deviation, Interquartile devi...Measure of dispersion part   I (Range, Quartile Deviation, Interquartile devi...
Measure of dispersion part I (Range, Quartile Deviation, Interquartile devi...
 
Measure of central tendency (Mean, Median and Mode)
Measure of central tendency (Mean, Median and Mode)Measure of central tendency (Mean, Median and Mode)
Measure of central tendency (Mean, Median and Mode)
 
Introduction of matrices
Introduction of matricesIntroduction of matrices
Introduction of matrices
 
New Syllabus MBA 2yrs MDU DDE, Rohtak
New Syllabus MBA 2yrs MDU DDE, RohtakNew Syllabus MBA 2yrs MDU DDE, Rohtak
New Syllabus MBA 2yrs MDU DDE, Rohtak
 
Table quantitative techniques
Table quantitative techniquesTable quantitative techniques
Table quantitative techniques
 

Último

MANUFACTURING PROCESS-II UNIT-5 NC MACHINE TOOLS
MANUFACTURING PROCESS-II UNIT-5 NC MACHINE TOOLSMANUFACTURING PROCESS-II UNIT-5 NC MACHINE TOOLS
MANUFACTURING PROCESS-II UNIT-5 NC MACHINE TOOLSSIVASHANKAR N
 
Structural Analysis and Design of Foundations: A Comprehensive Handbook for S...
Structural Analysis and Design of Foundations: A Comprehensive Handbook for S...Structural Analysis and Design of Foundations: A Comprehensive Handbook for S...
Structural Analysis and Design of Foundations: A Comprehensive Handbook for S...Dr.Costas Sachpazis
 
Russian Call Girls in Nagpur Grishma Call 7001035870 Meet With Nagpur Escorts
Russian Call Girls in Nagpur Grishma Call 7001035870 Meet With Nagpur EscortsRussian Call Girls in Nagpur Grishma Call 7001035870 Meet With Nagpur Escorts
Russian Call Girls in Nagpur Grishma Call 7001035870 Meet With Nagpur EscortsCall Girls in Nagpur High Profile
 
Call Girls Service Nashik Vaishnavi 7001305949 Independent Escort Service Nashik
Call Girls Service Nashik Vaishnavi 7001305949 Independent Escort Service NashikCall Girls Service Nashik Vaishnavi 7001305949 Independent Escort Service Nashik
Call Girls Service Nashik Vaishnavi 7001305949 Independent Escort Service NashikCall Girls in Nagpur High Profile
 
BSides Seattle 2024 - Stopping Ethan Hunt From Taking Your Data.pptx
BSides Seattle 2024 - Stopping Ethan Hunt From Taking Your Data.pptxBSides Seattle 2024 - Stopping Ethan Hunt From Taking Your Data.pptx
BSides Seattle 2024 - Stopping Ethan Hunt From Taking Your Data.pptxfenichawla
 
Top Rated Pune Call Girls Budhwar Peth ⟟ 6297143586 ⟟ Call Me For Genuine Se...
Top Rated  Pune Call Girls Budhwar Peth ⟟ 6297143586 ⟟ Call Me For Genuine Se...Top Rated  Pune Call Girls Budhwar Peth ⟟ 6297143586 ⟟ Call Me For Genuine Se...
Top Rated Pune Call Girls Budhwar Peth ⟟ 6297143586 ⟟ Call Me For Genuine Se...Call Girls in Nagpur High Profile
 
Processing & Properties of Floor and Wall Tiles.pptx
Processing & Properties of Floor and Wall Tiles.pptxProcessing & Properties of Floor and Wall Tiles.pptx
Processing & Properties of Floor and Wall Tiles.pptxpranjaldaimarysona
 
Coefficient of Thermal Expansion and their Importance.pptx
Coefficient of Thermal Expansion and their Importance.pptxCoefficient of Thermal Expansion and their Importance.pptx
Coefficient of Thermal Expansion and their Importance.pptxAsutosh Ranjan
 
Introduction to Multiple Access Protocol.pptx
Introduction to Multiple Access Protocol.pptxIntroduction to Multiple Access Protocol.pptx
Introduction to Multiple Access Protocol.pptxupamatechverse
 
Introduction to IEEE STANDARDS and its different types.pptx
Introduction to IEEE STANDARDS and its different types.pptxIntroduction to IEEE STANDARDS and its different types.pptx
Introduction to IEEE STANDARDS and its different types.pptxupamatechverse
 
The Most Attractive Pune Call Girls Budhwar Peth 8250192130 Will You Miss Thi...
The Most Attractive Pune Call Girls Budhwar Peth 8250192130 Will You Miss Thi...The Most Attractive Pune Call Girls Budhwar Peth 8250192130 Will You Miss Thi...
The Most Attractive Pune Call Girls Budhwar Peth 8250192130 Will You Miss Thi...ranjana rawat
 
Extrusion Processes and Their Limitations
Extrusion Processes and Their LimitationsExtrusion Processes and Their Limitations
Extrusion Processes and Their Limitations120cr0395
 
(ANVI) Koregaon Park Call Girls Just Call 7001035870 [ Cash on Delivery ] Pun...
(ANVI) Koregaon Park Call Girls Just Call 7001035870 [ Cash on Delivery ] Pun...(ANVI) Koregaon Park Call Girls Just Call 7001035870 [ Cash on Delivery ] Pun...
(ANVI) Koregaon Park Call Girls Just Call 7001035870 [ Cash on Delivery ] Pun...ranjana rawat
 
Online banking management system project.pdf
Online banking management system project.pdfOnline banking management system project.pdf
Online banking management system project.pdfKamal Acharya
 
(PRIYA) Rajgurunagar Call Girls Just Call 7001035870 [ Cash on Delivery ] Pun...
(PRIYA) Rajgurunagar Call Girls Just Call 7001035870 [ Cash on Delivery ] Pun...(PRIYA) Rajgurunagar Call Girls Just Call 7001035870 [ Cash on Delivery ] Pun...
(PRIYA) Rajgurunagar Call Girls Just Call 7001035870 [ Cash on Delivery ] Pun...ranjana rawat
 
result management system report for college project
result management system report for college projectresult management system report for college project
result management system report for college projectTonystark477637
 
The Most Attractive Pune Call Girls Manchar 8250192130 Will You Miss This Cha...
The Most Attractive Pune Call Girls Manchar 8250192130 Will You Miss This Cha...The Most Attractive Pune Call Girls Manchar 8250192130 Will You Miss This Cha...
The Most Attractive Pune Call Girls Manchar 8250192130 Will You Miss This Cha...ranjana rawat
 
UNIT - IV - Air Compressors and its Performance
UNIT - IV - Air Compressors and its PerformanceUNIT - IV - Air Compressors and its Performance
UNIT - IV - Air Compressors and its Performancesivaprakash250
 

Último (20)

MANUFACTURING PROCESS-II UNIT-5 NC MACHINE TOOLS
MANUFACTURING PROCESS-II UNIT-5 NC MACHINE TOOLSMANUFACTURING PROCESS-II UNIT-5 NC MACHINE TOOLS
MANUFACTURING PROCESS-II UNIT-5 NC MACHINE TOOLS
 
Structural Analysis and Design of Foundations: A Comprehensive Handbook for S...
Structural Analysis and Design of Foundations: A Comprehensive Handbook for S...Structural Analysis and Design of Foundations: A Comprehensive Handbook for S...
Structural Analysis and Design of Foundations: A Comprehensive Handbook for S...
 
Russian Call Girls in Nagpur Grishma Call 7001035870 Meet With Nagpur Escorts
Russian Call Girls in Nagpur Grishma Call 7001035870 Meet With Nagpur EscortsRussian Call Girls in Nagpur Grishma Call 7001035870 Meet With Nagpur Escorts
Russian Call Girls in Nagpur Grishma Call 7001035870 Meet With Nagpur Escorts
 
Call Girls Service Nashik Vaishnavi 7001305949 Independent Escort Service Nashik
Call Girls Service Nashik Vaishnavi 7001305949 Independent Escort Service NashikCall Girls Service Nashik Vaishnavi 7001305949 Independent Escort Service Nashik
Call Girls Service Nashik Vaishnavi 7001305949 Independent Escort Service Nashik
 
BSides Seattle 2024 - Stopping Ethan Hunt From Taking Your Data.pptx
BSides Seattle 2024 - Stopping Ethan Hunt From Taking Your Data.pptxBSides Seattle 2024 - Stopping Ethan Hunt From Taking Your Data.pptx
BSides Seattle 2024 - Stopping Ethan Hunt From Taking Your Data.pptx
 
DJARUM4D - SLOT GACOR ONLINE | SLOT DEMO ONLINE
DJARUM4D - SLOT GACOR ONLINE | SLOT DEMO ONLINEDJARUM4D - SLOT GACOR ONLINE | SLOT DEMO ONLINE
DJARUM4D - SLOT GACOR ONLINE | SLOT DEMO ONLINE
 
Top Rated Pune Call Girls Budhwar Peth ⟟ 6297143586 ⟟ Call Me For Genuine Se...
Top Rated  Pune Call Girls Budhwar Peth ⟟ 6297143586 ⟟ Call Me For Genuine Se...Top Rated  Pune Call Girls Budhwar Peth ⟟ 6297143586 ⟟ Call Me For Genuine Se...
Top Rated Pune Call Girls Budhwar Peth ⟟ 6297143586 ⟟ Call Me For Genuine Se...
 
Processing & Properties of Floor and Wall Tiles.pptx
Processing & Properties of Floor and Wall Tiles.pptxProcessing & Properties of Floor and Wall Tiles.pptx
Processing & Properties of Floor and Wall Tiles.pptx
 
Coefficient of Thermal Expansion and their Importance.pptx
Coefficient of Thermal Expansion and their Importance.pptxCoefficient of Thermal Expansion and their Importance.pptx
Coefficient of Thermal Expansion and their Importance.pptx
 
Introduction to Multiple Access Protocol.pptx
Introduction to Multiple Access Protocol.pptxIntroduction to Multiple Access Protocol.pptx
Introduction to Multiple Access Protocol.pptx
 
Introduction to IEEE STANDARDS and its different types.pptx
Introduction to IEEE STANDARDS and its different types.pptxIntroduction to IEEE STANDARDS and its different types.pptx
Introduction to IEEE STANDARDS and its different types.pptx
 
The Most Attractive Pune Call Girls Budhwar Peth 8250192130 Will You Miss Thi...
The Most Attractive Pune Call Girls Budhwar Peth 8250192130 Will You Miss Thi...The Most Attractive Pune Call Girls Budhwar Peth 8250192130 Will You Miss Thi...
The Most Attractive Pune Call Girls Budhwar Peth 8250192130 Will You Miss Thi...
 
Roadmap to Membership of RICS - Pathways and Routes
Roadmap to Membership of RICS - Pathways and RoutesRoadmap to Membership of RICS - Pathways and Routes
Roadmap to Membership of RICS - Pathways and Routes
 
Extrusion Processes and Their Limitations
Extrusion Processes and Their LimitationsExtrusion Processes and Their Limitations
Extrusion Processes and Their Limitations
 
(ANVI) Koregaon Park Call Girls Just Call 7001035870 [ Cash on Delivery ] Pun...
(ANVI) Koregaon Park Call Girls Just Call 7001035870 [ Cash on Delivery ] Pun...(ANVI) Koregaon Park Call Girls Just Call 7001035870 [ Cash on Delivery ] Pun...
(ANVI) Koregaon Park Call Girls Just Call 7001035870 [ Cash on Delivery ] Pun...
 
Online banking management system project.pdf
Online banking management system project.pdfOnline banking management system project.pdf
Online banking management system project.pdf
 
(PRIYA) Rajgurunagar Call Girls Just Call 7001035870 [ Cash on Delivery ] Pun...
(PRIYA) Rajgurunagar Call Girls Just Call 7001035870 [ Cash on Delivery ] Pun...(PRIYA) Rajgurunagar Call Girls Just Call 7001035870 [ Cash on Delivery ] Pun...
(PRIYA) Rajgurunagar Call Girls Just Call 7001035870 [ Cash on Delivery ] Pun...
 
result management system report for college project
result management system report for college projectresult management system report for college project
result management system report for college project
 
The Most Attractive Pune Call Girls Manchar 8250192130 Will You Miss This Cha...
The Most Attractive Pune Call Girls Manchar 8250192130 Will You Miss This Cha...The Most Attractive Pune Call Girls Manchar 8250192130 Will You Miss This Cha...
The Most Attractive Pune Call Girls Manchar 8250192130 Will You Miss This Cha...
 
UNIT - IV - Air Compressors and its Performance
UNIT - IV - Air Compressors and its PerformanceUNIT - IV - Air Compressors and its Performance
UNIT - IV - Air Compressors and its Performance
 

7 qc toolsTraining pdf

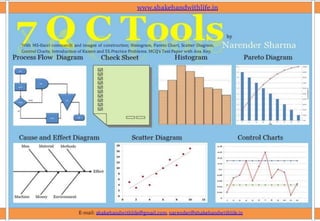
  • 1. E-mail: shakehandwithlife@gmail.com, narender@shakehandwithlife.in ShakehandwithLife.in With MS-Excel commands and images of construction; Histogram, Pareto Chart, Scatter Diagram, Control Charts. Introduction of Kaizen and 5S.Practice Problems. MCQ’s Test Paper with Ans. Key. by
  • 2. ShakehandwithLife.in www.shakehandwithlife.in Page i 7QC Tools E-Book Code: 7QCTT Telephonic Training + e-book+ login Id and password of your Online Study Room To Practice MCQ’s test paper, Online assignments, Discussion forum and many more things to do……. . Visit: www.shakehandwithlife.in e-mail shakehandwithlife@gmail.com , narender@shakehandwithlife.in “Save Paper, Save Trees, Save Environment”
  • 3. ShakehandwithLife.in www.shakehandwithlife.in Page ii Dedicated to my loving parents (Sh. Somdutt Sharma) and (Smt. Urmila Devi).
  • 4. ShakehandwithLife.in www.shakehandwithlife.in Page iii Salient features of the Book The workshop is specially designed and prepared for senior, middle and junior level quality professionals, engineers, managers of manufacturing and service industries. Graphics in the workshop elucidates the text and help to better understand the tools. Excel Images for Histogram, Pareto Analysis, Scatter diagram and Control charts are given with excel commands. This helps the learner to work easy in excel while construction the tools. Illustrative worked examples with manual calculation for better understanding. Data based practical problems for self practice. Project work based on 7QC Tools. Test paper with Multiple Choice Questions to check learning. Introduction of Kaizen and 5-S.
  • 5. ShakehandwithLife.in www.shakehandwithlife.in Page iv About Author Narender Sharma has worked with a leading container glass manufacturing organization since 2001 to 2014 as a quality professional. He passed his B.Sc. (Mathematics, Physics and Electronics) in 1997. After passing his B.Sc. he had been in school education since 1997. In 2001 he successfully completed his B.Ed. in (Teaching of mathematics and teaching of Science). But he did not remain in the field of school teaching and enter into corporate life. In 2008 he completed his course work for MBA (Production and Operation Management) along with his job. He has gone under various training programs like Six Sigma Green Belt, ISO9001:2008, Internal Auditor Course. Teaching gives him immense pleasure ‘cause he understands that in this area we are not only teaching but learning also and expand our boundary of knowledge from our next generation. He writes blogs, makes sketches, read books as his part of hobby. Presently he is working on E-Learning through his website ; www.shakehandwithlife.in . Narender Sharma tried to put his all experience and knowledge gained from his work and study area. “It is very difficult to make things easy to understand by others and I sincerely do this by designing graphics in this book. If you still find difficult to understand these tools, definitely I need to work more hard to make things easier. The book contains not only the theoretical concept of all 7 QC tools but the practical application with illustrative worked examples and construction of tools like Histogram, Pareto Chart, Scatter diagram, Control charts in MS Excel with help of commands and images also.” …………………..Narender Sharma The Trainer can be contacted at Website: www.shakehandwithlife.in E-Mail : narender@shakehandwithlife.in shakehandwithlife@gmail.com Facebook : www.facebook.com/shakehandwithlife SlideShare: www.slideshare.net/shakehandwithlife Google + : www.google.com/+narendersharma Linkedin : http://www.linkedin.com/pub/narender-sharma/1a/a95/872 Twitter www.twitter.com/sharma_ndr Mobile : +91-9315132462 Narender Sharma
  • 6. ShakehandwithLife.in www.shakehandwithlife.in Page v Testimonials Awesome post this is such a great resource that you are providing and you give it away for free. I love seeing websites that understand the value of providing a quality resource for free…………….Rajesh Master Commented on the blog post “ Kaoru Ishikawa: Father of QCC” http://shakehandwithlife.blogspot.in/2013/04/kaoru-ishikawa-father-of-qcc.html Generally I do not learn article on blogs, but I would like to say that this write-up very compelled me to take a look at and do so! Your writing taste has been surprised me. Thanks, very great article………….William J. Cornett Commented on the blog post “Honesty is the Best Policy* - conditions apply” http://shakehandwithlife.blogspot.in/2012/01/honesty-is-best-policy-conditions-apply. html Very simple & hence nice explanation. When the line balancing is done Line of Balance need to be monitored for efficiency..............Pramod Nice explanation of Line Balancing. Make-times on each work station should, after they have been balanced, equal TAKT time. TAKT time is the average time between customer orders. If perfect balance can be obtained so that Make-Times are equal and are equal to TAKT Time then inventories will be minimised........Anonymous Commented on the blog post “Line Balancing Vs Line of Balance” http://shakehandwithlife.blogspot.in/2011/08/line-balancing-vs-line-of-balance.html I absolutely adore reading your blog posts, the variety of writing is smashing. This blog as usual was educational, I have had to bookmark your site and subscribe to your feed in ifeed. Your theme looks lovely. Thanks for sharing……….Iso9000 Commented on the blog post “Correction , Corrective Action and Preventive Action with illustrations” http://shakehandwithlife.blogspot.in/2011/06/correction-corrective- action-and.html Wow! these two factor can change our life definitely. Such a nice blog, people should read this. Really very nice...............vk Commented on the blog post “Personality of person is same as an engine for a train.” http://shakehandwithlife.blogspot.in/2011/05/personality-of-person-is-same-as-engine. html Nice and comprehensive article on the use of six sigma in process improvement…………..Carl wright This site certainly has all the information I needed about this subject and didn’t know who to ask………..Anonymous Commented on the blog post “Six Sigma : A gauge of measuring goodness of our product, services and processes” http://shakehandwithlife.blogspot.in/2011/04/six-sigma- gauge-of-measuring-goodness.html Hi, Mr. Sharma, It is really touching for me ........after reading there are some tears in my eyes, some thing is very true in that blog.......thanks for writing .......Keep rocking and writing Thanks……………Anonymous Commented on the blog post “I am here because she was there..........” http://shakehandwithlife.blogspot.in/2011/03/i-am-here-because-she-was-there.html Thank you Narender. What you have said makes perfect sense and a great antidote for those who confuse loving with being loved……Val Mckie Commented on the blog post “Love: A sense of Responsibility” http://shakehandwithlife.blogspot.in/2011/02/love-sense-of-responsibility.html
  • 7. ShakehandwithLife.in www.shakehandwithlife.in Page vi Nice information. keep it up……………..Anonymous Commented on the blog post “AIDS: Striking on Backbone of Nation” http://shakehandwithlife.blogspot.in/2010/11/aids-striking-on-backbone-of-nation.html Good one ...........but usually girls are not so much logical as explained in the story in deciding their partners.......anyhow interesting story explaining significance of stats in human life.....................Anonymous WOW... just hope it could be as true and as easy as depicted by this example... nonetheless, stats always allow you to reach a point :))………………..Praveen Good one.... But may be we should give other two guys chance to reduce the variation by carrying DMAIC and lets observe the improvement……….Manish Rawat Commented on the blog post “Statistics of Love” http://shakehandwithlife.blogspot.in/2010/10/statistics-of-love.html Εxcellent blog pοst. I аbsоlutely lovе thiѕ websіte. Contіnuе thе good work……………..Anonymous Excellent Narender!!! Would like to learn more………………Anonymous Commented on the blog post “5S : Best Management Practices from Kitchen to workplace.” http://shakehandwithlife.blogspot.in/2010/09/5s-best-management-practices- from.html
  • 8. ShakehandwithLife.in www.shakehandwithlife.in Page vii Click on Contents Introduction ...................................................................................................................................................................................................................................... 1 Tool No. 1 – Process Flow Diagram ................................................................................................................................................................................................. 2 What is Process Flow Diagram? .................................................................................................................................................................................................................................................................... 2 Application and uses of Process Flow Diagram ...................................................................................................................................................................................................................................... 3 Value Added Steps .......................................................................................................................................................................................................................................... 3 Non- Value Added Steps ................................................................................................................................................................................................................................. 3 Construction of Process Flow Diagram ...................................................................................................................................................................................................................................................... 5 Illustrative Work Examples ............................................................................................................................................................................................................................................................................. 6 Measuring Cycle Time .................................................................................................................................................................................................................................................................................... 10 Process Efficiency ............................................................................................................................................................................................................................................................................................. 10 Tool No. 2 – Check Sheet ................................................................................................................................................................................................................ 11 What is Check Sheet? ...................................................................................................................................................................................................................................................................................... 11 Application and uses of Check Sheet ........................................................................................................................................................................................................................................................ 11 Construction of Check Sheet ........................................................................................................................................................................................................................................................................ 11 Illustrative Worked Examples..................................................................................................................................................................................................................................................................... 12 Tool No. 3 – Histogram ...................................................................................................................................................................................................................14 What is Histogram? ......................................................................................................................................................................................................................................................................................... 14 Histogram Shapes ......................................................................................................................................................................................................................................... 14 Application and uses of Histogram ........................................................................................................................................................................................................................................................... 15 Construction of Histogram ........................................................................................................................................................................................................................................................................... 15 Histogram For Ungrouped Data ................................................................................................................................................................................................................... 15 Histogram for Grouped data ........................................................................................................................................................................................................................ 16 Illustrative Worked Examples..................................................................................................................................................................................................................................................................... 17 Construction of Histogram in Excel .......................................................................................................................................................................................................................................................... 19 Tool No. 4 – Pareto Diagram ..........................................................................................................................................................................................................21
  • 9. ShakehandwithLife.in www.shakehandwithlife.in Page viii What is Pareto Diagram? ............................................................................................................................................................................................................................................................................... 21 Who was Pareto? ......................................................................................................................................................................................................................................... 21 ABC Analysis. ................................................................................................................................................................................................................................................ 22 80 – 20 Rule .................................................................................................................................................................................................................................................. 22 Application and uses of Pareto Diagram ...................................................................................................................................................................................................... 22 Manual Construction of Pareto Chart....................................................................................................................................................................................................................................................... 23 Construction of Pareto Chart in Excel ...................................................................................................................................................................................................................................................... 24 Illustrative Worked Example ....................................................................................................................................................................................................................................................................... 27 Tool No. 5 – Cause and Effect Diagram ......................................................................................................................................................................................... 28 What is Cause and Effect diagram? ........................................................................................................................................................................................................................................................... 28 Application and uses of C&E Diagram ..................................................................................................................................................................................................................................................... 29 Construction of Cause and Effect Diagram ............................................................................................................................................................................................................................................ 30 Brainstorming ............................................................................................................................................................................................................................................... 30 Essentials for organizing Brainstorming sessions to get more accurate and usable result ......................................................................................................................... 30 Illustrative Worked Example ....................................................................................................................................................................................................................................................................... 31 Tool No. 6 Scatter Diagram ............................................................................................................................................................................................................ 33 What is Scatter Diagram? .............................................................................................................................................................................................................................................................................. 33 Application and uses of scatter diagram................................................................................................................................................................................................................................................. 33 Interpretation of Different Patterns of Scatter Diagram .................................................................................................................................................................................................................. 34 Algebraic value of relationship between two variables (X and Y) i.e. Correlation Coefficient ........................................................................................................................................ 36 Karl Pearson’s Coefficient of Correlation (r). ....................................................................................................................................................................................................................................... 36 Interpretation of value of 'r' ......................................................................................................................................................................................................................... 37 Construction of Scatter diagram ............................................................................................................................................................................................................................................................... 38 Illustrative Worked Examples..................................................................................................................................................................................................................................................................... 39 Construction of Scatter Diagram in Excel ............................................................................................................................................................................................................................................... 41 Calculation of Coefficient of Correlation (r) ................................................................................................................................................................................................. 43
  • 10. ShakehandwithLife.in www.shakehandwithlife.in Page ix Tool No. 7 Control Chart ................................................................................................................................................................................................................ 44 What is Control Chart? ................................................................................................................................................................................................................................................................................... 44 Types of Charts ............................................................................................................................................................................................................................................. 45 Mean Charts ................................................................................................................................................................................................................................................. 45 Run Charts .................................................................................................................................................................................................................................................... 45 Accuracy and Precision .................................................................................................................................................................................................................................................................................. 46 Archer’s Bow and Target analogy for understanding accuracy and precision ............................................................................................................................................. 47 Application and uses of Control Charts ................................................................................................................................................................................................................................................... 48 Continuous Use of Control Charts, Showing Improved Quality .................................................................................................................................................................................................... 49 Construction of Control Charts ................................................................................................................................................................................................................................................................... 50 Steps of Construction of Mean Chart ........................................................................................................................................................................................................... 50 Steps of construction of Run/Range charts .................................................................................................................................................................................................. 51 Illustrative Worked Example ....................................................................................................................................................................................................................................................................... 52 Construction of Control Chart in Excel .................................................................................................................................................................................................................................................... 56 Mean Chart ................................................................................................................................................................................................................................................... 57 Range Chart ................................................................................................................................................................................................................................................. 59 Problems for Practice ......................................................................................................................................................................................................................61 Project work : Reduce monthly electricity bill by 50% using 7qc tools .......................................................................................................................................... 63 Test Paper ....................................................................................................................................................................................................................................... 65 Answer Key ...................................................................................................................................................................................................................................... 71 Result .............................................................................................................................................................................................................................................. 72 Introduction of Kaizen ................................................................................................................................................................................................................... 73 What is Kaizen? ................................................................................................................................................................................................................................................................................................. 73 Foundation for Kaizen: ................................................................................................................................................................................................................................................................................... 73 Kaizen Strategy .................................................................................................................................................................................................................................................................................................. 74 Kaizen Practices ................................................................................................................................................................................................................................................................................................ 75
  • 11. ShakehandwithLife.in www.shakehandwithlife.in Page x Introduction of 5 S .......................................................................................................................................................................................................................... 76 What is 5S? .......................................................................................................................................................................................................................................................................................................... 76 Why does 5S practice useful? ...................................................................................................................................................................................................................................................................... 77 How to implement 5S? .................................................................................................................................................................................................................................................................................. 77 References ...................................................................................................................................................................................................................................... 78 Feedback ......................................................................................................................................................................................................................................... 78
  • 12. 7QC Tools : Introduction ShakehandwithLife.in www.shakehandwithlife.in Page 1 Introduction Fundamental Tools to solve 95% quality related problems These seven effective methods or tools which will offer any organization means of collecting, presenting, and analyzing most of its data problems. 95% of quality related problems in the factory can be solved with these 7 fundamental quality tools. Developed by The Seven QC tools were developed by Prof. Kaoru Ishikawa, ‘The father of QCCs’ (Quality Control Circle). Through his experience, he identifies a set of tools which can be used by teams and individuals to interpret the data fully and derive the maximum information out from it. Can be used by Business owners, Junior, Middle and Senior level quality professionals, Engineers, Managers in different kind of manufacturing and service industries, Sports, Research. Applied in Production ,Quality Control, Warehouse , Sales and Purchase, Personnel Management, Storekeeping, Marketing , Service delivery, Housekeeping, Accounting, Banking , Airline, Insurance, Telecommunication, Medical and healthcare, Education and so on……. Applied by an individual or team in Process Audit, Data Collection and Analysis, Data presentation, Identifying Critical Issues, Identification of root causes, Brain Storming, Quality control , Process Control, Problem solving , Decision Making, Continual Improvement , Maintaining Accuracy and Precision, Kaizen Activities, Six Sigma projects, Cost reduction Business Research etc…. Getting expertise in various skills while using 7QC Tools Control over the process, Finding value added and Non value added activities, Reducing cycle time, Learning of data collection techniques, Smart presentation of data, Tracking the most appropriate cause for a problem, Dig out the root cause for a problem, Calculation of degree of relation between cause and effect of a problem, Accuracy of results, data analytic skills, Comparing past and future trends of data with present, Learning statistics process control, MS-Excel.
  • 13. 7QC Tools : Process Flow Diagram ShakehandwithLife.in www.shakehandwithlife.in Page 2 Tool No. 1 – Process Flow Diagram What is Process Flow Diagram? Process flow diagram is a symbolic representation of all steps of whole process through which any product or service move. All steps of process shown diagrammatically in a sequential manner. Process flow diagram can easily be seen nearby the actual process in the organization.
  • 14. 7QC Tools : Process Flow Diagram ShakehandwithLife.in www.shakehandwithlife.in Page 3 Application and uses of Process Flow Diagram It uses to clearly define and analyzing the processes. Step by Step picture of the process use for the purpose of analysis, discussion or communication. It uses for standardization of the process. It uses for locating the areas of improvement in the process. It uses for the purpose of training and development of new employees before working on actual process. Process flow diagram improve the efficiency of process The diagram makes it easy to visualize the entire system, identify potential trouble spots, and locate control activities. It answers the question, “Who/What is next?” Improvements can be accomplished by changing, reducing, combining or eliminating steps. It helps to finding NVA ( Non Valuable Activities) tasks and their elimination. It helps to avoid the duplication of the work. Its helps to avoid unnecessary activities. Total cycle time and time per activity can be calculated with help of process flow diagram. Idle time between two steps or throughout the process can be calculated and eliminated. To elude repetition of work. Value Added Steps Customers are willing to pay for it It physically changes the product It’s done right the first time Example value added activities; Entering order, ordering materials preparing drawing, Assembling, Mandatory testing, packaging, Shipping to customer. Non- Value Added Steps Not essential to produce output Does not add value to the output. Example activities : Waiting, Storing , Staging, Counting, Inspecting, Recording, Obtaining approvals, Testing, Reviewing, Copying, Filing, Reworking, Tracking
  • 15. 7QC Tools : Process Flow Diagram ShakehandwithLife.in www.shakehandwithlife.in Page 4 Symbols use to make process flow diagram are Rounded Rectangle uses for Start or Terminate the process Rectangle like symbol uses for an operation. Any kind of activity on product is comes under operation. It indicates main steps in a process, method or procedure. Usually the part , material , or product concerned is modified or changed during operation, e.g. In a garment industry the cloth passes under different kind of operation like stitching, washing, folding, press, embroidery, making border etc. similarly in an Insurance industry to do an Insurance policy of a customer different kind of operation are collecting data of the customer, filling the form, printing the form, dispatch the form, collection of payments etc. Diamond like symbol uses for decision or any condition like “yes or no, OK or Not OK”. If the condition satisfied or the decision is ‘yes’ then process move with arrow coming out in forward direction otherwise follow the arrow coming our left or right An arrow like symbol uses for the purpose of sequence flow of the process. It connect each step and helps to read the Flow Chart. ‘D’ like symbol uses for the ‘Delay’. This show the temporary hold for any correction or wait. Inverted Triangle uses for the storage of the product. When product do not go for any further operation or the product has passed all the stages of process then product needs to be stored at some specific place then this stage of the process will be shown by the inverted triangle in the process diagram. Note : There are many other symbols use to make process flow diagram. But most of time only these symbols shown above are use . Some time Round shape is used for operation instead of Rectangle. This is because there is no standard rule for using symbols to make process flow diagram. Different organization and different department using symbols according to there technical areas. Some time they make there own symbols. But still the basic rule of process flow diagram is same and very much necessary to learn by all quality professionals.
  • 16. 7QC Tools : Process Flow Diagram ShakehandwithLife.in www.shakehandwithlife.in Page 5 Construction of Process Flow Diagram Steps of construction of process flow diagram. 1. Make the team of those persons related to the process. 2. Fix the Start and End point to create the boundaries of the process.  Where does the process begin?  Where does the process terminate? 3. Write down all the steps of the process separately.  Write down Activities, Decision points or conditions, store or delay points.  Write the connecting sequences of all steps explaining the process flow. 4. Select proper symbol for each step of the process. 5. Put all the symbols at one place. 6. Connect all the symbols by arrows in a proper sequence flow. 7. No. the steps of process and time elapse in each step to calculate cycle time. 8. Write mandatory Heading on the process flow diagram.  Task  Starting point of the diagram  Terminating point of the diagram  Process diagram made by  Date of Charting/Making 9. Finalize the process diagram  Confirm the process is actually working in the same way as designed.  People related to the process are following the process as charted.  Make a consensus among all members on designed process diagram.  If any logical suggestion then remove the extra step and add if any step is missing.
  • 17. 7QC Tools : Process Flow Diagram ShakehandwithLife.in www.shakehandwithlife.in Page 6 Illustrative Work Examples Example 1. Prepare Process flow diagram of Tea Making in kitchen. Title/ Task :Tea Making in Kitchen Starting Point : Ignite the Burner End Point: Close the Burner Process Diagram Made by : Narender Sharma Date of Charting : Summary Event Sequence Flow Frequency 2 10 1 15 Start/End Activity Decision n