Financial and management accounting assignment
•Descargar como DOCX, PDF•
3 recomendaciones•696 vistas

Financial and management accounting assignment

Recomendados
Más contenido relacionado
La actualidad más candente
La actualidad más candente (20)
Destacado
Destacado (18)
Similar a Financial and management accounting assignment
Similar a Financial and management accounting assignment (20)
Más de GIEDEEAM SOLAR and Gajanana Publications, LIC
Más de GIEDEEAM SOLAR and Gajanana Publications, LIC (20)
Último
Último (20)
Financial and management accounting assignment
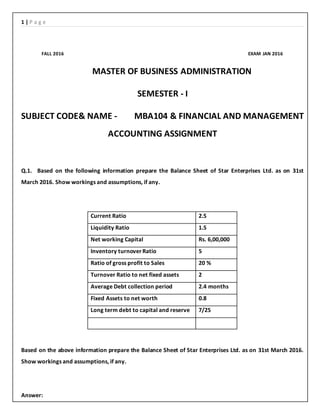
- 1. 1 | P a g e FALL 2016 EXAM JAN 2016 MASTER OF BUSINESS ADMINISTRATION SEMESTER - I SUBJECT CODE& NAME - MBA104 & FINANCIAL AND MANAGEMENT ACCOUNTING ASSIGNMENT Q.1. Based on the following information prepare the Balance Sheet of Star Enterprises Ltd. as on 31st March 2016. Show workings and assumptions, if any. Current Ratio 2.5 Liquidity Ratio 1.5 Net working Capital Rs. 6,00,000 Inventory turnoverRatio 5 Ratio of gross profit to Sales 20 % Turnover Ratio to net fixed assets 2 Average Debt collection period 2.4 months Fixed Assets to net worth 0.8 Long term debt to capital and reserve 7/25 Based on the above information prepare the Balance Sheet of Star Enterprises Ltd. as on 31st March 2016. Show workings and assumptions, if any. Answer:
- 2. 2 | P a g e Balance Sheet of Star Enterprises Ltd. as on 31st March 2016 Liabilities Amount Assets Amount Share Capital & reserves (h) Long term debt (i) Current Liabilities (b) 12,50,000 3,50,000 4,00,000 Fixed Assets (f) Current Assets Stock (c) Debtors (g) Bank (10,00,000 – 9,00,000) (b/f) 10,00,000 4,00,000 5,00,000 1,00,000 20,00,000 20,00,000 Workings a. Current ratio : Current Assets / Current Liabilities Therefore Current Assets = 2.5 Current Liabilities = 2.5 Times b. Net Working capital = current Assets – Current Liabilities = 2.5 Times Current Liabilities – Current Liabilities Current Liabilities = 6,00,000 / 1.5 = 4,00,000 Therefore Current Assets = 4,00,000 X 2.5 = 10,00,000 c. Quick Ratio = Current Assets - Stock / Current Liabilities =10,00,000-(1.5X4,00,000) Therefore Stock= 4,00,000 d. Stock turnover ratio = Cost of goods sold / average stock = 5 Times Cost of goods sold = 4,00,000 X 5 = 20,00,000 e. Gross profit = 20% of sales = Cost of goods sold = 80% of sales = 20,00,000, therefore, gross profit is (20/80) X 20,00,000 = 5,00,000 Therefore Sales =(cost of Sales+Gross profit) = (20,00,000+5,00,000)= 25,00,000 f. Cost of goods sold / net fixed assets = 2 Times Net Fixed Assets= 20,00,000 / 2 = 10,00,000 g. Average Collection Period = 2.4 months Therefore Debtors = 25,00,000 X 2.4 /12 = 5,00,000
- 3. 3 | P a g e h. Fixed Assets / Net worth = 0.80 Times Therefore Net worth = 10,00,000 / 0.80 = 12,50,000 i. Long term Debt / capital & reserves = 7 / 25 Therefore Long term Debt = 12,50,000 X 7 / 25 = 3,50,000 Q2. Explain Balance Scorecard. Give an illustration of Balance Score Card. Answer: A balanced scorecard is a performance metric used in strategic management to identify and improve various internal functions of a business and their resulting external outcomes. It is used to measure and provide feedback to organizations. Data collection is crucial to providing quantitative results, as the information gathered is interpreted by managers and executives, and used to make better decisions for the organization. Purpose behind the Balanced Scorecard: The balanced scorecard is used to reinforce good behaviors in an organization by isolating four separate areas that need to be analyzed. These four areas, also called legs, involve learning and growth, business processes, customers, and finance. The balanced scorecard is used to attain objectives, measurements, initiatives and goals that result from these four primary functions of a business. Companies can easily identify factors hindering company performance and outline strategic changes tracked by future scorecards. With the balanced scorecard, they look at the company as a whole when viewing company objectives. An organization may use the balanced scorecard to implement strategy mapping to see where value is added within an organization. A company also utilizes the balanced scorecard to develop strategic initiatives and strategy objectives. The Four Legs of the Balanced Scorecard: Information is collected and analyzed from four aspects of a business. First, learning and growth are analyzed through the investigation of training and knowledge resources. This first leg handles how well information is captured and how effectively employees utilize the information to convert it to a competitive advantage over the industry. Second, business processes are evaluated by investigating how well products are manufactured. Operational management is analyzed to track any gaps, delays, bottlenecks, shortages or waste.
- 4. 4 | P a g e Third, customer perspectives are collected to gauge customer satisfaction with quality, price and availability of products or services. Customers provide feedback regarding if their needs are being met with current products. Finally, financial data such as sales, expenditures and income are used to understand financial performance. These financial metrics may include dollar amounts, financial ratios, budget variances or income targets. These four legs encompass the vision and strategy of an organization and require active management to analyze the data collected. Therefore, the balanced scorecard is often referred to as a management tool, not a measurement tool. Illustration of Balance Score Card: Balanced scorecard is an example of a closed-loop controller or cybernetic control applied to the management of the implementation of a strategy. Closed-loop or cybernetic control is where actual performance is measured, the measured value is compared to a reference value and based on the difference between the two corrective interventions are made as required. Initially, Balanced Scorecard emerged as a performance management system, over a period of time it has come to be known as a strategy management system, with its ultimate aim being the achievement of long term financial performance. Balanced scorecard is seen as a strategic management system enabling business leaders to meet the challenge of strategy execution. Two of the ideas that underpin modern balanced scorecard designs concern facilitating the creation of such a control – through making it easier to select which data to observe, and ensuring that the choice of data is consistent with the ability of the observer to intervene. One such holistic performance measurement system was developed by Dr. Robert Kaplan and Dr. David Norton. They called it the balanced scorecard. It is a framework for integrating measures derived from strategy. While retaining financial measures of past performance, the balanced scorecard introduces the drivers of future financial performance as shown in figure 1 The drivers (customer, internal business process, learning, and growth perspectives) are derived from the organisation's strategy translated into objectives and measures. Figure 1 depicts a balanced scorecard showing perspectives as developed by Dr. Robert Kaplan and Dr. David Norton.
- 5. 5 | P a g e For each of the above perspectives, a company must have its own stated objectives (goals) and specifically defined units of measurements for each such objective. Q3. From following Balance Sheet of ABC Ltd. as on 31. 03. 2015 and 31. 03. 2016, prepare Cash Flow Statement as per AS-3 using the Indirect method: Liabilities 31.03.2015 31.03.2016 Capital 50,00,000 50,00,000 Retained Earnings 26,50,000 36,90,000 Debentures - 9,00,000 Current liabilities Creditors 8,80,000 8,20,000 Bank loan 1,50,000 3,00,000 Liability for Expenses 3,30,000 2,70,000 Dividend Payable 1,50,000 3,00,000 91,60,000 1,12,80,000 Assets
- 6. 6 | P a g e Plant and Machinery 27,30,000 40,70,000 Less : Depreciation 6,10,000 7,90,000 21,20,000 32,80,000 Current Assets Debtors 23,90,000 28,30,000 Less: Provision 1,50,000 1,90,000 22,40,000 26,40,000 Cash 15,20,000 18,20,000 Marketable Securities 11,80,000 15,00,000 Inventories 20,10,000 19,20,000 Prepaid Expenses 90,000 1,20,000 91,60,000 1,12,80,000 Additional Information: 1. Net profit for the year ended 31.03.2016, after charging depreciation Rs. 1,80,000 is Rs. 22,40,000. 2. Debtors of Rs. 2,30,000 were determined to be worthless and were written off against the provisions for doubtful debts account during the year. 3. ABC Ltd. declared dividend Rs. 12,00,000 for the year 2015-16. (From the above Balance Sheet of ABC Ltd. as on 31. 03. 2015 and 31. 03. 2016, prepare Cash Flow Statement as per AS-3 using the Indirect method.)
- 7. 7 | P a g e Solution: ABC Ltd. Cash Flow Statement for the year ended 31 march 2016 Particulars rs rs Cash flow from operating activities Net profit 22,40,000 Add back: Depreciation 1,80,000 Cash generated from operations before working capital changes 24,20,000 Increase in debtors 4,40,000 Increase in provision 40,000 Decrease in inventories 90,000 Increase in prepaid expenses 30,000 Decrease in creditors 60,000 Decrease in outstanding expenses 60,000 Net cash from operating activities 19,60,000 Cash flows from investing activities Purchases of plant and machinery (40,7000-27,30,000) 13,40,000 Net cash from investing activities 13,40,000 Cash flows from financing activities
- 8. 8 | P a g e Issue of debentures 9,00,000 Bank loan taken 1,50,000 Dividend paid (12,00,000-3,00,000+1,50,000) 10,50,000 Net cash from financing activities Nill Net increase in cash and cash equivalents 6,20,000 Cash and cash equivalents at the beginning of the period (note 2) 23,00,000 Cash and cash equivalents at the end of the period (note 2) 33,20,000 Working Notes: 1) Adjustment for bad debts is to be ignored. Actual balance of debtors and provision for bad debts are to be considered. 2) A marketable security is to be treated as cash equivalents. Cash and cash equivalent at the beginning of the period will be: Rs 15,20,000 + Rs 11,80,000= Rs 27,00,000. Similarly, cash and cash equivalents at the end of the period will be: Rs 18,20,000 + Rs 15,00,000= Rs 33,20,000. 3) Retained Earnings: Opening balance 26,50,000 Add: Net profit for the year 22,40,000 48,90,000 Less: dividend declared 12,00,000 Balance as on 31.3.2016 36,90,000