SlideShare una empresa de Scribd logo
1 de 38
Ellipsoidal representations about correlations
       (Towards general correlation theory)


              Toshiyuki Shimono
          tshimono@05.alumni.u-tokyo.ac.jp

              KAKENHI* Symposium
                *Grant-in-Aid for Scientific Research
               University of Tsukuba
                        2011-11-8
My profile
• My jobs are mainly building algorithms using
  data in large amounts such as:
   o web access log
   o newspaper articles
   o POS(Point of Sales) data
   o tags of millions of pictures
   o links among billions of pages
   o psychology test results of a human resource company
   o data produced used for recommendation engines
   o data produced an original search engine

• This presentation touches on those above.
Background
1. Paradoxes of real world data :
    o any elaborate regression analysis mostly gives ρ < 0.7
        (This is when the observation is not very accurate, and 0.7 is arbitrary.)
           -> so how to deal with them?
    o   data accuracy seems not important to see ρ if ρ < 0.7,
           -> details shown later.

2. My temporal answer :
    o The correlations are very important,
        so we need interpretation methods.
    o The ellipsoids will give you insights.


3. Then we will :
    o understand the real world dominated by weak correlations.
    o find new rules and findings in broad science, hopefully.
Main contents
§1. What is ρ?
   o   Shape of ellipse/ellipsoid
   o   Mysterious robustness


§2. Geometry of regression
   o   Similarity ratio of ellips*s
   o   Graduated rulers
   o   Linear scalar fields
§1. What is ρ ?
      (ρ : the correlation coefficient)


It was developed by Karl Pearson from a similar but slightly
different idea introduced by Francis Galton in the 1880s.
                               (quoted from en.wikipedia.org)
The shapes of correlation ellipses (1)
                            Each entry of the left
                            figure shows the 2-
                            dimensional Gaussian
                            distributions with ρ
                            changing from -1 to +1
                            stepping with
                            0.1. (5000 points are
                            plotted for each)
The shapes of correlation ellipses (2)
The density function of 2-dim Gauss-
distribution with standardizations.


Note: for higher dimensions,
                                       The ellipse inscribes the unit
                                       square at 4 points (±1,±ρ)
                                       and (±ρ,±1).
The shapes of correlation ellipses (3)


•   Displacement and axial-
    rescaling are allowed.
    (Rotation or rescaling along
    other direction is prohibited.)
                                      When you draw the ellipses above,
                                       1. draw an ellipse with the height and width of √(1±ρ),
                                       2. rotate it 45 degree,
                                       3. do parallel-shift and axial-rescaling.
The shapes of correlation ellipses (4)
 [Baseball example] 6 teams of the Central League played 130 games in the
 each of past 31 years. Each dot below corresponds to each team and each year
 (N = 186 = 6 × 31).


                                                            x : total score lost(L)
x : total score gained(G)                                   y : - rank
y : - rank                                                  ρ = -0.471
ρ = 0.419


x : total score gained                                      x : -rank prediction
                                                            from both G & L
y : total score lost
                                                            y : - rank
ρ = 0.423
                                                            ρ = -0.828

                                                            (The prediction is
                                                            through the multiple
                                                            regression analysis)
The shapes of correlations (5) SKIP
Correlation ellipsoid (higher dimension)
                                  z        ( 0.5 , 0.7 , 1 )
                                                                        ρ-matrix herein is,
             (-1,-0.3,-0.5)
                                                                        1 0.3 0.5
                                                    ( 0.3 , 1 , 0.7 )   0.3 1 0.7
                                                                        0.5 0.7 1
                   ( 1 , 0.3 , 0.5 )
-0.3 ,-1 ,-0.7 )                                          y
                   x
                       (-0.5 ,-0.7 ,-1 )

 For 3-dim case, the probability ellipsoid touches the unit cube
 at 6 points of ±( ρ・1 , ρ・2 , ρ・3 ) where ・ = 1,2,3.
 (For k-dimensions, the hyper-ellipsoid touches the unit hyper-cube
 at 2×k points of of ±( ρ・1 , ρ・2 ,.., ρ・k ) where ・ = 1,2,..,k.
The mysterious robustness (1)
ρ[X:Y] and ρ [ f(X) : g(Y) ] seems to differ only little each
other
 • when f and g are both increasing functions
 • unless X, Y, f(X) or g(Y) contains `outlier(s)'.

            (Sampling fluctuations of ρ are much more than the effect
                           caused by non-linearity as well as error ε.)


            * A function f(・) is increasing iff f(x) ≦ f(y) holds for any x ≦ y.
The mysterious robustness (2)


   ρ[X:Y]=0.557                   ρ[X2:Y]=0.519   ρ[X:Y2]=0.536 ρ[X:log(Y)]=0.539
  (x,y)=(u,0.5*u+0.707*v) with         Xを2乗            Yを2乗           Yを対数化
  (u,v) from an uniform square.


ρ[Xrank:Yrank]=0.537 ρ[X(7):Y(7)]=0.524 ρ[X(5):Y(5)]=0.507
      X,Yを順位化             X,Yを7値化             X,Yを5値化
                                                                   Even N=200 causes the sampling
                                                                   correlations rather big fluctuations,
• The deformations cause less effect on ρ,                         whereas the X marks from the
• N=200 ≫ 1 causes bigger ρ fluctuations.                          experiments rather concentrates.
The mysterious robustness (3)


  Sampled ρ are perturbed corresponding to the sampling size with
  N=30(blue) or N=300(red). The deformation effect by f( ) is less.
Where does the champion come from?
The champion of a game is often not the true champion.


                                                    potential ability


If ρ of the game is not close to 1, the true cannot win.
The winner is approximately ρ times as strong as the true guy.
(If the results and abilities form a 2-dim 0-centered Gaussian.)
Summary of `§1. What is ρ? '


•   ρ is recognizable as an ellipse.
•   ρ-matrix is recognizable as an ellipsoid.
•   ρ seems robust against axial deformations unless outliers exist.
•   ρ of a game is suggested by the champions.
§2. Geometry of Regression


        The figures herein show the
        possible region where
        (x,y,z)=(ρ[Y:Z],ρ[Z:X],ρ[X:Y])
        can exist.
Multiple-ρ is the similarity ratio of ellipses
[ Formulation of MRA ]


 [ Multiple - ρ ]

                                             The multiple-ρ (≦ 1) is the
                                             similarity ratio of the ellipses.


 (When X・ is k-dimentional, the hyper-ellipsoid is determined by k×k matrix
 whose elements are ρ [ Xi : Xj ], and the inner point is at p-dimensional vector
 whose elements are ρ [ Xi : Y ] . )
Examples : Multiple-ρ from the ellipses


Many interesting phenomena would be systematically
explained.
Partial-ρ is read by a ruler in the ellipse
          The partial correlation r1' comes form the idea of the
          correlation between X1 and Y but X2 is fixed.


                                       The red ruler
                                        • parallel to the corresponding axis,
                                        • passing through (r1,r2),
                                        • fully expanding inside the ellipse,
                                        • graduated linearly ranging ±1,
                                       reads the partial-ρ.
   r1' = 0.75 for this case.
   r2' is also read by changing the ruler direction vertically.
Standardized partial regression coefficients


  • ai are called the partial regression coefficients.
  • Assume X1,X2,Y are standardized.

                   Make a scalar field inside the ellipse
                    • 1 on the plus-side boundary of k-th axis,
                    • 0 on the boundary of the other axis,
                    • interpolate the assigning values linearly.
                   Then, ak is read by the value at (r1,r2).
                   Note:
                    • Extension to higher dimensions are easy.
                    • Boundary points at each facet is single.
                    • This pictorialization may be useful to SEM
                      (Structural Equation Analysis).
The elliptical depiction for the baseball example
         This page is added after the symposium

                      Red : for the multiple-ρ (0.828),
                      Blue : for the two partial-ρ
                      Magenta : for the partial regression coefficients.

                      Each value corresponds to the length ratio of the
                      bold part to the whole same-colored line section.

                      X1 : annual total score gained
                      X2: annual total score lost
                      Y: zero minus annual ranking

                      ( ρ[Y:X1] , ρ[Y:X2] ) = (0.419,-0.471) is plotted
                      inside the ellipse slanted with ρ[X1:X2]=0.423.

                      -> The meaning of numbers becomes clearer.
Summary and findings
 of §2 Geometry of regression
 • Multiple-ρ is the similarity ratio of two ellipses/ellipsoids.
 • Partial-ρ is read by a graduated ruler in the ellipse/ellipsoids.
 • Each regression coefficients are given by the schalar field.
So far, the derived numbers from MRA (Multiple Regression Analysis)
have often said to be hard to recognize. But this situation can be
changed.
Summary as a whole
[ Main resutls ]
Using the ellipse or hyper-ellipsoid,
  • any correlation matrix is wholly pictorialized.
  • multiple regression is translated into geometric quotients.

[ Sub results ]
  • ρ seems quite robust against axial deformations unless outliers exist.
  • (Spherical trigonometry may give you insights). <- Not referred today.

[ Next steps ]
  • treat the parameter/sampling perturbations
  • systematize interesting statistical phenomena
  • produce new theories further on
  • give new twists to other research areas
  • make useful applications to the real world cases
  • organize a new logic system for this ambiguous world.
Refs
1. 岩波数学辞典
  Encyclopedic Dictionary of Mathematics, The Mathematical Society of Japan

2. R, http://www.r-project.org/

3. 共分散構造分析 [事例編]

 The author sincerely welcomes any related literature.
Background of this presentation SKIP
1. We make judgements from related things
   in daily or social life, but this real world is
   noisy and filled with exceptions.
e.g. "Does the better posture and mental
concentration cause the better performance?"

2. The real world data causes paradoxes :
     o any elaborate regression analysis mostly gives ρ < 0.7, how to deal?
     o data accuracy is not important when ρ < 0.7, details shown later.
     o why subjective sense works in the real?

3. Geometric interpretations of multiple regression analysis may be useful
      o that wholly takes in any correlation matrix
      o that is geometric using ellipsoids
   to observe, analyze the background phenomena in detail.

4. Then we will understand weak correlations that dominates our world.
A primitive question SKIP
Question
    Why(How) is data analysing important?

My Answer
    It gives you inspirations and
        updates your recognition to the real world.

  Knowing the numbers μ, σ, ρ, ranking, VaR *
       from phenomena you have met
     is crucially important to make your next action
       in either of your daily, social or business life!!
          * average, std deviation, correlation coefficient, the rank order, Value at Risk


     And so, the interpretation of the numbers is necessary.

     (And I provides you that of ρ today!)
Main ideas in more detail SKIP
Using the ellipse or hyper-ellipsoid,
 • 2nd order moments are completely imaginable in a picture.
 • the numbers from Multiple-Regression are also imaginable.

1. (Pearson's) Correlation Coefficient
 • basic of statistics (as you know)
 • may change well when outliers are contained
 • however, changes only few against `monotone' map
 • depicted as 'correlation ellipse'

2. Multiple Regression Analysis
 • (Spherical Surface Interpretation)
 • Ellipse Interpretation
Main ideas SKIP

1. What is the correlation coefficient after all?
2. Geometric interpretations of Multiple Regression
   Analysis.
The mysterious robustness (3) SKIP


front figures: x - original sampling correlation. y - 3-valued then
correlation calculated. back figures: sample of 100.
Summary of `§1. What is ρ?
    'REDUNDANT

•   A correlation ρ is recognizable as an ellipse.
•   A correlation matrix is also recognizable as an ellipsoid.
•   ρ seems robust against axial deformations unless outliers exist.
•   You can guess `ρ' of a game by the champion.
When partial-ρ is zero. (SKIP)

The condition partial-ρ = 0 ⇔
 • The inner angle of the spheric triangle is 90 degrees.
 • The two `hyper-planes' cross at 90 degrees at the `hyper-
   axis'. The axis corresponds the fixed variables and each of
   the planes contains each of the two variables.
 • On the ellipse/ellipsoid, the characteristic point is on the
   midpoint of the ruler.
Multiple-ρ is the similarity ratio of ellipses
[REDUNDANT ]
 Formulation of MRA


 [ Multiple - ρ ]

                                                  The multiple-ρ (≦ 1) is the
                                                  similarity ratio of the ellipses.
For arbitrary variables number case, you
calculate: the inverse of the correlation
                                               (When X・ is k-dimentional, the hyper-
matrix → the reciprocal of each of the
diagonal elements → 1 minus each of them       ellipsoid is determined by k×k matrix
→ take the square root of each → each are      whose elements are ρ [ Xi : Xj ], and the
the multiple-ρ of the corresponding variable   inner point is at p-dimensional vector whose
from the rest variables.                       elements are ρ [ Xi : Y ] . )
Summary and findings
 of §2 Geometry of regressionREDUNDANT
 • Multiple-ρ is the similarity ratio of two ellipses/ellipsoids.
 • Partial-ρ is read by a graduated ruler in the ellipse/ellipsoids.
 • Each regression coefficients are given by the scholar field.
 • (Spherical trigonometry)
So far, the derived numbers from MRA have often said to be hard
to recognize. But this situation can be changed.
Introduction This page is added after the symposium
         This page may need intensive proofreading by the author.
There is a Japanese word `kaizen', which means improvement.
                                                                     The problems still existing today are as follows:
The real world is, however, so ambiguous that it often is hard to - The meaning of correlation value is not yet well known.
know whether any kaizen action would make positive effect or not.- The meaning of multiple regression analysis is also not yet
                                                                       well known(, although when the correlation is weak the reasonable
Sometimes your action may cause negative effect or zero effect         choice of analysis is multiple analysis or its elaborate
in an averaged sense even if you believe your action is a good         derivatives).
one. Assume a situation that you can control a variable to make
some effect on the outcome variable (the number of control
variables                                                            The author found that correlation is very robust against any
would increase in the following).                                    `axial deformations’ unless variables contain outliers. Rather
                                                                     sampling correlation coefficient perturbs much more in many
The author's hypothetical proposition is that the correlation        cases when N is less than 1000. The author also found
coefficient indeed plays important role. A reason is that when the geometrical backgrounds of correlations of multiple regression
correlation is positive then your rational action is just increasing analysis (Perhaps R.A.Fisher already knew that, but any person
the value of the control variable. And it seems very reasonable around me didn’t know that) that is producing many insights.
that you should select a strongly correlated variable to the output
variable.                                                            (The robustness is not well analyzed at this moment (some
                                                                     pieces of analysis and numerical examples) The
                                                                     geometrical background is analyzed in basic points so
                                                                     the author is considering to investigate further for parameter
                                                                     perturbations.)

Más contenido relacionado

La actualidad más candente

3 polar equations
3 polar equations3 polar equations
3 polar equations
math267
 
Advanced Functions Unit 1
Advanced Functions Unit 1Advanced Functions Unit 1
Advanced Functions Unit 1
leefong2310
 
INVERSE TRIGONOMETRIC FUNCTIONS by Sadiq hussain
INVERSE TRIGONOMETRIC FUNCTIONS by Sadiq hussainINVERSE TRIGONOMETRIC FUNCTIONS by Sadiq hussain
INVERSE TRIGONOMETRIC FUNCTIONS by Sadiq hussain
ficpsh
 
Inverse trig functions
Inverse trig functionsInverse trig functions
Inverse trig functions
Jessica Garcia
 
Do you know matrix transformations
Do you know matrix transformationsDo you know matrix transformations
Do you know matrix transformations
Tarun Gehlot
 

La actualidad más candente (20)

3 polar equations
3 polar equations3 polar equations
3 polar equations
 
1
11
1
 
The inverse trigonometric functions
The inverse trigonometric functionsThe inverse trigonometric functions
The inverse trigonometric functions
 
Introduction to the theory of optimization
Introduction to the theory of optimizationIntroduction to the theory of optimization
Introduction to the theory of optimization
 
Approximate Inference (Chapter 10, PRML Reading)
Approximate Inference (Chapter 10, PRML Reading)Approximate Inference (Chapter 10, PRML Reading)
Approximate Inference (Chapter 10, PRML Reading)
 
Introductory maths analysis chapter 13 official
Introductory maths analysis   chapter 13 officialIntroductory maths analysis   chapter 13 official
Introductory maths analysis chapter 13 official
 
Classical optimization theory Unconstrained Problem
Classical optimization theory Unconstrained ProblemClassical optimization theory Unconstrained Problem
Classical optimization theory Unconstrained Problem
 
1533 game mathematics
1533 game mathematics1533 game mathematics
1533 game mathematics
 
Parent functions and Transformations
Parent functions and TransformationsParent functions and Transformations
Parent functions and Transformations
 
14 graphs of factorable rational functions x
14 graphs of factorable rational functions x14 graphs of factorable rational functions x
14 graphs of factorable rational functions x
 
Advanced Functions Unit 1
Advanced Functions Unit 1Advanced Functions Unit 1
Advanced Functions Unit 1
 
INVERSE TRIGONOMETRIC FUNCTIONS by Sadiq hussain
INVERSE TRIGONOMETRIC FUNCTIONS by Sadiq hussainINVERSE TRIGONOMETRIC FUNCTIONS by Sadiq hussain
INVERSE TRIGONOMETRIC FUNCTIONS by Sadiq hussain
 
Inverse Trigonometric Functions
Inverse Trigonometric FunctionsInverse Trigonometric Functions
Inverse Trigonometric Functions
 
Lecture co3 math21-1
Lecture co3 math21-1Lecture co3 math21-1
Lecture co3 math21-1
 
Yangs First Lecture Ppt
Yangs First Lecture PptYangs First Lecture Ppt
Yangs First Lecture Ppt
 
Inverse trig functions
Inverse trig functionsInverse trig functions
Inverse trig functions
 
Do you know matrix transformations
Do you know matrix transformationsDo you know matrix transformations
Do you know matrix transformations
 
Introductory maths analysis chapter 17 official
Introductory maths analysis   chapter 17 officialIntroductory maths analysis   chapter 17 official
Introductory maths analysis chapter 17 official
 
Anov af03
Anov af03Anov af03
Anov af03
 
Relations and functions
Relations and functionsRelations and functions
Relations and functions
 

Destacado

時系列の相関係数の解釈は注意を要する(ランダムウォーク同士の相関係数は±0.72の外側に15%も分布することなど)
時系列の相関係数の解釈は注意を要する(ランダムウォーク同士の相関係数は±0.72の外側に15%も分布することなど)時系列の相関係数の解釈は注意を要する(ランダムウォーク同士の相関係数は±0.72の外側に15%も分布することなど)
時系列の相関係数の解釈は注意を要する(ランダムウォーク同士の相関係数は±0.72の外側に15%も分布することなど)
Toshiyuki Shimono
 
Cognitive principles of instruction (edet 722) ctml
Cognitive principles of instruction (edet 722) ctmlCognitive principles of instruction (edet 722) ctml
Cognitive principles of instruction (edet 722) ctml
academic3
 
Tceq 2011
Tceq 2011Tceq 2011
Tceq 2011
scswa
 
Dallas partnermeeting april 2012
Dallas partnermeeting april 2012Dallas partnermeeting april 2012
Dallas partnermeeting april 2012
bscisteam
 
My lucky number
My lucky numberMy lucky number
My lucky number
huehue122
 
6 challenges project management teams face
6 challenges project management teams face6 challenges project management teams face
6 challenges project management teams face
ramsaas
 

Destacado (20)

How Random Points distributes on a plane? (To see the variety of the shape)
How Random Points distributes on a plane?  (To see the variety of the shape)How Random Points distributes on a plane?  (To see the variety of the shape)
How Random Points distributes on a plane? (To see the variety of the shape)
 
Correlations about random_walks
Correlations about random_walksCorrelations about random_walks
Correlations about random_walks
 
便利な数を100億個の乱数から算出
便利な数を100億個の乱数から算出便利な数を100億個の乱数から算出
便利な数を100億個の乱数から算出
 
時系列の相関係数の解釈は注意を要する(ランダムウォーク同士の相関係数は±0.72の外側に15%も分布することなど)
時系列の相関係数の解釈は注意を要する(ランダムウォーク同士の相関係数は±0.72の外側に15%も分布することなど)時系列の相関係数の解釈は注意を要する(ランダムウォーク同士の相関係数は±0.72の外側に15%も分布することなど)
時系列の相関係数の解釈は注意を要する(ランダムウォーク同士の相関係数は±0.72の外側に15%も分布することなど)
 
A Hacking Toolset for Big Tabular Files (3)
A Hacking Toolset for Big Tabular Files (3)A Hacking Toolset for Big Tabular Files (3)
A Hacking Toolset for Big Tabular Files (3)
 
Cognitive principles of instruction (edet 722) ctml
Cognitive principles of instruction (edet 722) ctmlCognitive principles of instruction (edet 722) ctml
Cognitive principles of instruction (edet 722) ctml
 
Complete time plan Joe Hennessy
Complete time plan Joe HennessyComplete time plan Joe Hennessy
Complete time plan Joe Hennessy
 
Central Adiposity and Mortality after First-Ever Acute Ischemic Stroke
Central Adiposity and Mortality after First-Ever Acute Ischemic StrokeCentral Adiposity and Mortality after First-Ever Acute Ischemic Stroke
Central Adiposity and Mortality after First-Ever Acute Ischemic Stroke
 
Tceq 2011
Tceq 2011Tceq 2011
Tceq 2011
 
Weird photos pics on floidbox.com
Weird photos pics on floidbox.comWeird photos pics on floidbox.com
Weird photos pics on floidbox.com
 
Dallas partnermeeting april 2012
Dallas partnermeeting april 2012Dallas partnermeeting april 2012
Dallas partnermeeting april 2012
 
Untrash summit presentation 1
Untrash summit presentation 1Untrash summit presentation 1
Untrash summit presentation 1
 
Dogs
DogsDogs
Dogs
 
imagenes
imagenesimagenes
imagenes
 
My lucky number
My lucky numberMy lucky number
My lucky number
 
Russian and Ukrainian banks activities in social media analytic review
Russian and Ukrainian banks activities in social media analytic reviewRussian and Ukrainian banks activities in social media analytic review
Russian and Ukrainian banks activities in social media analytic review
 
Events
EventsEvents
Events
 
Monalisa arya
Monalisa aryaMonalisa arya
Monalisa arya
 
administracion de empresas
administracion de empresasadministracion de empresas
administracion de empresas
 
6 challenges project management teams face
6 challenges project management teams face6 challenges project management teams face
6 challenges project management teams face
 

Similar a Ellipsoidal Representations about correlations (2011-11, Tsukuba, Kakenhi-Symposium)

Similar a Ellipsoidal Representations about correlations (2011-11, Tsukuba, Kakenhi-Symposium) (20)

Algebric Functions.pdf
Algebric Functions.pdfAlgebric Functions.pdf
Algebric Functions.pdf
 
Sintering
SinteringSintering
Sintering
 
Program on Quasi-Monte Carlo and High-Dimensional Sampling Methods for Applie...
Program on Quasi-Monte Carlo and High-Dimensional Sampling Methods for Applie...Program on Quasi-Monte Carlo and High-Dimensional Sampling Methods for Applie...
Program on Quasi-Monte Carlo and High-Dimensional Sampling Methods for Applie...
 
Scatter plot
Scatter plotScatter plot
Scatter plot
 
CLIM Fall 2017 Course: Statistics for Climate Research, Nonstationary Covaria...
CLIM Fall 2017 Course: Statistics for Climate Research, Nonstationary Covaria...CLIM Fall 2017 Course: Statistics for Climate Research, Nonstationary Covaria...
CLIM Fall 2017 Course: Statistics for Climate Research, Nonstationary Covaria...
 
CST 504 Linear Equations
CST 504 Linear EquationsCST 504 Linear Equations
CST 504 Linear Equations
 
Stats chapter 3
Stats chapter 3Stats chapter 3
Stats chapter 3
 
関数(&統計の続き)(人間科学のための基礎数学)
関数(&統計の続き)(人間科学のための基礎数学)関数(&統計の続き)(人間科学のための基礎数学)
関数(&統計の続き)(人間科学のための基礎数学)
 
Regression Analysis.pdf
Regression Analysis.pdfRegression Analysis.pdf
Regression Analysis.pdf
 
Regression Analysis
Regression AnalysisRegression Analysis
Regression Analysis
 
Regression and Co-Relation
Regression and Co-RelationRegression and Co-Relation
Regression and Co-Relation
 
Corr-and-Regress (1).ppt
Corr-and-Regress (1).pptCorr-and-Regress (1).ppt
Corr-and-Regress (1).ppt
 
Corr-and-Regress.ppt
Corr-and-Regress.pptCorr-and-Regress.ppt
Corr-and-Regress.ppt
 
Cr-and-Regress.ppt
Cr-and-Regress.pptCr-and-Regress.ppt
Cr-and-Regress.ppt
 
Corr-and-Regress.ppt
Corr-and-Regress.pptCorr-and-Regress.ppt
Corr-and-Regress.ppt
 
Corr-and-Regress.ppt
Corr-and-Regress.pptCorr-and-Regress.ppt
Corr-and-Regress.ppt
 
Corr-and-Regress.ppt
Corr-and-Regress.pptCorr-and-Regress.ppt
Corr-and-Regress.ppt
 
Correlation & Regression for Statistics Social Science
Correlation & Regression for Statistics Social ScienceCorrelation & Regression for Statistics Social Science
Correlation & Regression for Statistics Social Science
 
Relations and functions
Relations and functions Relations and functions
Relations and functions
 
10. functions
10. functions10. functions
10. functions
 

Más de Toshiyuki Shimono

新型コロナの感染者数 全国の状況 2021年2月上旬まで
新型コロナの感染者数 全国の状況 2021年2月上旬まで新型コロナの感染者数 全国の状況 2021年2月上旬まで
新型コロナの感染者数 全国の状況 2021年2月上旬まで
Toshiyuki Shimono
 

Más de Toshiyuki Shimono (20)

国際産業数理・応用数理会議のポスター(作成中)
国際産業数理・応用数理会議のポスター(作成中)国際産業数理・応用数理会議のポスター(作成中)
国際産業数理・応用数理会議のポスター(作成中)
 
インターネット等からデータを自動収集するソフトウェアに必要な補助機能とその実装
インターネット等からデータを自動収集するソフトウェアに必要な補助機能とその実装インターネット等からデータを自動収集するソフトウェアに必要な補助機能とその実装
インターネット等からデータを自動収集するソフトウェアに必要な補助機能とその実装
 
extracting only a necessary file from a zip file
extracting only a necessary file from a zip fileextracting only a necessary file from a zip file
extracting only a necessary file from a zip file
 
A Hacking Toolset for Big Tabular Files -- JAPAN.PM 2021
A Hacking Toolset for Big Tabular Files -- JAPAN.PM 2021A Hacking Toolset for Big Tabular Files -- JAPAN.PM 2021
A Hacking Toolset for Big Tabular Files -- JAPAN.PM 2021
 
新型コロナの感染者数 全国の状況 2021年2月上旬まで
新型コロナの感染者数 全国の状況 2021年2月上旬まで新型コロナの感染者数 全国の状況 2021年2月上旬まで
新型コロナの感染者数 全国の状況 2021年2月上旬まで
 
Multiplicative Decompositions of Stochastic Distributions and Their Applicat...
 Multiplicative Decompositions of Stochastic Distributions and Their Applicat... Multiplicative Decompositions of Stochastic Distributions and Their Applicat...
Multiplicative Decompositions of Stochastic Distributions and Their Applicat...
 
Theory to consider an inaccurate testing and how to determine the prior proba...
Theory to consider an inaccurate testing and how to determine the prior proba...Theory to consider an inaccurate testing and how to determine the prior proba...
Theory to consider an inaccurate testing and how to determine the prior proba...
 
Interpreting Multiple Regression via an Ellipse Inscribed in a Square Extensi...
Interpreting Multiple Regressionvia an Ellipse Inscribed in a Square Extensi...Interpreting Multiple Regressionvia an Ellipse Inscribed in a Square Extensi...
Interpreting Multiple Regression via an Ellipse Inscribed in a Square Extensi...
 
Sqlgen190412.pdf
Sqlgen190412.pdfSqlgen190412.pdf
Sqlgen190412.pdf
 
BigQueryを使ってみた(2018年2月)
BigQueryを使ってみた(2018年2月)BigQueryを使ってみた(2018年2月)
BigQueryを使ってみた(2018年2月)
 
Seminar0917
Seminar0917Seminar0917
Seminar0917
 
既存分析ソフトへ
データを投入する前に
簡便な分析するためのソフトの作り方の提案
既存分析ソフトへ
データを投入する前に
簡便な分析するためのソフトの作り方の提案既存分析ソフトへ
データを投入する前に
簡便な分析するためのソフトの作り方の提案
既存分析ソフトへ
データを投入する前に
簡便な分析するためのソフトの作り方の提案
 
To Make Graphs Such as Scatter Plots Numerically Readable (PacificVis 2018, K...
To Make Graphs Such as Scatter Plots Numerically Readable (PacificVis 2018, K...To Make Graphs Such as Scatter Plots Numerically Readable (PacificVis 2018, K...
To Make Graphs Such as Scatter Plots Numerically Readable (PacificVis 2018, K...
 
To Make Graphs Such as Scatter Plots Numerically Readable (PacificVis 2018, K...
To Make Graphs Such as Scatter Plots Numerically Readable (PacificVis 2018, K...To Make Graphs Such as Scatter Plots Numerically Readable (PacificVis 2018, K...
To Make Graphs Such as Scatter Plots Numerically Readable (PacificVis 2018, K...
 
Make Accumulated Data in Companies Eloquent by SQL Statement Constructors (PDF)
Make Accumulated Data in Companies Eloquent by SQL Statement Constructors (PDF)Make Accumulated Data in Companies Eloquent by SQL Statement Constructors (PDF)
Make Accumulated Data in Companies Eloquent by SQL Statement Constructors (PDF)
 
企業等に蓄積されたデータを分析するための処理機能の提案
企業等に蓄積されたデータを分析するための処理機能の提案企業等に蓄積されたデータを分析するための処理機能の提案
企業等に蓄積されたデータを分析するための処理機能の提案
 
新入社員の頃に教えて欲しかったようなことなど
新入社員の頃に教えて欲しかったようなことなど新入社員の頃に教えて欲しかったようなことなど
新入社員の頃に教えて欲しかったようなことなど
 
ページャ lessを使いこなす
ページャ lessを使いこなすページャ lessを使いこなす
ページャ lessを使いこなす
 
Guiを使わないテキストデータ処理
Guiを使わないテキストデータ処理Guiを使わないテキストデータ処理
Guiを使わないテキストデータ処理
 
データ全貌把握の方法170324
データ全貌把握の方法170324データ全貌把握の方法170324
データ全貌把握の方法170324
 

Último

1029-Danh muc Sach Giao Khoa khoi 6.pdf
1029-Danh muc Sach Giao Khoa khoi  6.pdf1029-Danh muc Sach Giao Khoa khoi  6.pdf
1029-Danh muc Sach Giao Khoa khoi 6.pdf
QucHHunhnh
 
1029 - Danh muc Sach Giao Khoa 10 . pdf
1029 -  Danh muc Sach Giao Khoa 10 . pdf1029 -  Danh muc Sach Giao Khoa 10 . pdf
1029 - Danh muc Sach Giao Khoa 10 . pdf
QucHHunhnh
 
Salient Features of India constitution especially power and functions
Salient Features of India constitution especially power and functionsSalient Features of India constitution especially power and functions
Salient Features of India constitution especially power and functions
KarakKing
 

Último (20)

Dyslexia AI Workshop for Slideshare.pptx
Dyslexia AI Workshop for Slideshare.pptxDyslexia AI Workshop for Slideshare.pptx
Dyslexia AI Workshop for Slideshare.pptx
 
Food safety_Challenges food safety laboratories_.pdf
Food safety_Challenges food safety laboratories_.pdfFood safety_Challenges food safety laboratories_.pdf
Food safety_Challenges food safety laboratories_.pdf
 
Mehran University Newsletter Vol-X, Issue-I, 2024
Mehran University Newsletter Vol-X, Issue-I, 2024Mehran University Newsletter Vol-X, Issue-I, 2024
Mehran University Newsletter Vol-X, Issue-I, 2024
 
How to Create and Manage Wizard in Odoo 17
How to Create and Manage Wizard in Odoo 17How to Create and Manage Wizard in Odoo 17
How to Create and Manage Wizard in Odoo 17
 
Making communications land - Are they received and understood as intended? we...
Making communications land - Are they received and understood as intended? we...Making communications land - Are they received and understood as intended? we...
Making communications land - Are they received and understood as intended? we...
 
1029-Danh muc Sach Giao Khoa khoi 6.pdf
1029-Danh muc Sach Giao Khoa khoi  6.pdf1029-Danh muc Sach Giao Khoa khoi  6.pdf
1029-Danh muc Sach Giao Khoa khoi 6.pdf
 
1029 - Danh muc Sach Giao Khoa 10 . pdf
1029 -  Danh muc Sach Giao Khoa 10 . pdf1029 -  Danh muc Sach Giao Khoa 10 . pdf
1029 - Danh muc Sach Giao Khoa 10 . pdf
 
SKILL OF INTRODUCING THE LESSON MICRO SKILLS.pptx
SKILL OF INTRODUCING THE LESSON MICRO SKILLS.pptxSKILL OF INTRODUCING THE LESSON MICRO SKILLS.pptx
SKILL OF INTRODUCING THE LESSON MICRO SKILLS.pptx
 
On National Teacher Day, meet the 2024-25 Kenan Fellows
On National Teacher Day, meet the 2024-25 Kenan FellowsOn National Teacher Day, meet the 2024-25 Kenan Fellows
On National Teacher Day, meet the 2024-25 Kenan Fellows
 
Understanding Accommodations and Modifications
Understanding  Accommodations and ModificationsUnderstanding  Accommodations and Modifications
Understanding Accommodations and Modifications
 
Mixin Classes in Odoo 17 How to Extend Models Using Mixin Classes
Mixin Classes in Odoo 17  How to Extend Models Using Mixin ClassesMixin Classes in Odoo 17  How to Extend Models Using Mixin Classes
Mixin Classes in Odoo 17 How to Extend Models Using Mixin Classes
 
How to Manage Global Discount in Odoo 17 POS
How to Manage Global Discount in Odoo 17 POSHow to Manage Global Discount in Odoo 17 POS
How to Manage Global Discount in Odoo 17 POS
 
Salient Features of India constitution especially power and functions
Salient Features of India constitution especially power and functionsSalient Features of India constitution especially power and functions
Salient Features of India constitution especially power and functions
 
How to Give a Domain for a Field in Odoo 17
How to Give a Domain for a Field in Odoo 17How to Give a Domain for a Field in Odoo 17
How to Give a Domain for a Field in Odoo 17
 
Sociology 101 Demonstration of Learning Exhibit
Sociology 101 Demonstration of Learning ExhibitSociology 101 Demonstration of Learning Exhibit
Sociology 101 Demonstration of Learning Exhibit
 
Unit-IV- Pharma. Marketing Channels.pptx
Unit-IV- Pharma. Marketing Channels.pptxUnit-IV- Pharma. Marketing Channels.pptx
Unit-IV- Pharma. Marketing Channels.pptx
 
ComPTIA Overview | Comptia Security+ Book SY0-701
ComPTIA Overview | Comptia Security+ Book SY0-701ComPTIA Overview | Comptia Security+ Book SY0-701
ComPTIA Overview | Comptia Security+ Book SY0-701
 
Google Gemini An AI Revolution in Education.pptx
Google Gemini An AI Revolution in Education.pptxGoogle Gemini An AI Revolution in Education.pptx
Google Gemini An AI Revolution in Education.pptx
 
General Principles of Intellectual Property: Concepts of Intellectual Proper...
General Principles of Intellectual Property: Concepts of Intellectual  Proper...General Principles of Intellectual Property: Concepts of Intellectual  Proper...
General Principles of Intellectual Property: Concepts of Intellectual Proper...
 
Accessible Digital Futures project (20/03/2024)
Accessible Digital Futures project (20/03/2024)Accessible Digital Futures project (20/03/2024)
Accessible Digital Futures project (20/03/2024)
 

Ellipsoidal Representations about correlations (2011-11, Tsukuba, Kakenhi-Symposium)

  • 1. Ellipsoidal representations about correlations (Towards general correlation theory) Toshiyuki Shimono tshimono@05.alumni.u-tokyo.ac.jp KAKENHI* Symposium *Grant-in-Aid for Scientific Research University of Tsukuba 2011-11-8
  • 2. My profile • My jobs are mainly building algorithms using data in large amounts such as: o web access log o newspaper articles o POS(Point of Sales) data o tags of millions of pictures o links among billions of pages o psychology test results of a human resource company o data produced used for recommendation engines o data produced an original search engine • This presentation touches on those above.
  • 3. Background 1. Paradoxes of real world data : o any elaborate regression analysis mostly gives ρ < 0.7 (This is when the observation is not very accurate, and 0.7 is arbitrary.) -> so how to deal with them? o data accuracy seems not important to see ρ if ρ < 0.7, -> details shown later. 2. My temporal answer : o The correlations are very important, so we need interpretation methods. o The ellipsoids will give you insights. 3. Then we will : o understand the real world dominated by weak correlations. o find new rules and findings in broad science, hopefully.
  • 4. Main contents §1. What is ρ? o Shape of ellipse/ellipsoid o Mysterious robustness §2. Geometry of regression o Similarity ratio of ellips*s o Graduated rulers o Linear scalar fields
  • 5. §1. What is ρ ? (ρ : the correlation coefficient) It was developed by Karl Pearson from a similar but slightly different idea introduced by Francis Galton in the 1880s. (quoted from en.wikipedia.org)
  • 6. The shapes of correlation ellipses (1) Each entry of the left figure shows the 2- dimensional Gaussian distributions with ρ changing from -1 to +1 stepping with 0.1. (5000 points are plotted for each)
  • 7. The shapes of correlation ellipses (2) The density function of 2-dim Gauss- distribution with standardizations. Note: for higher dimensions, The ellipse inscribes the unit square at 4 points (±1,±ρ) and (±ρ,±1).
  • 8. The shapes of correlation ellipses (3) • Displacement and axial- rescaling are allowed. (Rotation or rescaling along other direction is prohibited.) When you draw the ellipses above, 1. draw an ellipse with the height and width of √(1±ρ), 2. rotate it 45 degree, 3. do parallel-shift and axial-rescaling.
  • 9. The shapes of correlation ellipses (4) [Baseball example] 6 teams of the Central League played 130 games in the each of past 31 years. Each dot below corresponds to each team and each year (N = 186 = 6 × 31). x : total score lost(L) x : total score gained(G) y : - rank y : - rank ρ = -0.471 ρ = 0.419 x : total score gained x : -rank prediction from both G & L y : total score lost y : - rank ρ = 0.423 ρ = -0.828 (The prediction is through the multiple regression analysis)
  • 10. The shapes of correlations (5) SKIP
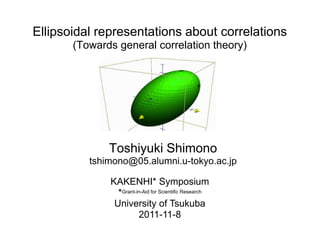
  • 11. Correlation ellipsoid (higher dimension) z ( 0.5 , 0.7 , 1 ) ρ-matrix herein is, (-1,-0.3,-0.5) 1 0.3 0.5 ( 0.3 , 1 , 0.7 ) 0.3 1 0.7 0.5 0.7 1 ( 1 , 0.3 , 0.5 ) -0.3 ,-1 ,-0.7 ) y x (-0.5 ,-0.7 ,-1 ) For 3-dim case, the probability ellipsoid touches the unit cube at 6 points of ±( ρ・1 , ρ・2 , ρ・3 ) where ・ = 1,2,3. (For k-dimensions, the hyper-ellipsoid touches the unit hyper-cube at 2×k points of of ±( ρ・1 , ρ・2 ,.., ρ・k ) where ・ = 1,2,..,k.
  • 12. The mysterious robustness (1) ρ[X:Y] and ρ [ f(X) : g(Y) ] seems to differ only little each other • when f and g are both increasing functions • unless X, Y, f(X) or g(Y) contains `outlier(s)'. (Sampling fluctuations of ρ are much more than the effect caused by non-linearity as well as error ε.) * A function f(・) is increasing iff f(x) ≦ f(y) holds for any x ≦ y.
  • 13. The mysterious robustness (2) ρ[X:Y]=0.557 ρ[X2:Y]=0.519 ρ[X:Y2]=0.536 ρ[X:log(Y)]=0.539 (x,y)=(u,0.5*u+0.707*v) with Xを2乗 Yを2乗 Yを対数化 (u,v) from an uniform square. ρ[Xrank:Yrank]=0.537 ρ[X(7):Y(7)]=0.524 ρ[X(5):Y(5)]=0.507 X,Yを順位化 X,Yを7値化 X,Yを5値化 Even N=200 causes the sampling correlations rather big fluctuations, • The deformations cause less effect on ρ, whereas the X marks from the • N=200 ≫ 1 causes bigger ρ fluctuations. experiments rather concentrates.
  • 14. The mysterious robustness (3) Sampled ρ are perturbed corresponding to the sampling size with N=30(blue) or N=300(red). The deformation effect by f( ) is less.
  • 15. Where does the champion come from? The champion of a game is often not the true champion. potential ability If ρ of the game is not close to 1, the true cannot win. The winner is approximately ρ times as strong as the true guy. (If the results and abilities form a 2-dim 0-centered Gaussian.)
  • 16. Summary of `§1. What is ρ? ' • ρ is recognizable as an ellipse. • ρ-matrix is recognizable as an ellipsoid. • ρ seems robust against axial deformations unless outliers exist. • ρ of a game is suggested by the champions.
  • 17. §2. Geometry of Regression The figures herein show the possible region where (x,y,z)=(ρ[Y:Z],ρ[Z:X],ρ[X:Y]) can exist.
  • 18. Multiple-ρ is the similarity ratio of ellipses [ Formulation of MRA ] [ Multiple - ρ ] The multiple-ρ (≦ 1) is the similarity ratio of the ellipses. (When X・ is k-dimentional, the hyper-ellipsoid is determined by k×k matrix whose elements are ρ [ Xi : Xj ], and the inner point is at p-dimensional vector whose elements are ρ [ Xi : Y ] . )
  • 19. Examples : Multiple-ρ from the ellipses Many interesting phenomena would be systematically explained.
  • 20. Partial-ρ is read by a ruler in the ellipse The partial correlation r1' comes form the idea of the correlation between X1 and Y but X2 is fixed. The red ruler • parallel to the corresponding axis, • passing through (r1,r2), • fully expanding inside the ellipse, • graduated linearly ranging ±1, reads the partial-ρ. r1' = 0.75 for this case. r2' is also read by changing the ruler direction vertically.
  • 21. Standardized partial regression coefficients • ai are called the partial regression coefficients. • Assume X1,X2,Y are standardized. Make a scalar field inside the ellipse • 1 on the plus-side boundary of k-th axis, • 0 on the boundary of the other axis, • interpolate the assigning values linearly. Then, ak is read by the value at (r1,r2). Note: • Extension to higher dimensions are easy. • Boundary points at each facet is single. • This pictorialization may be useful to SEM (Structural Equation Analysis).
  • 22. The elliptical depiction for the baseball example This page is added after the symposium Red : for the multiple-ρ (0.828), Blue : for the two partial-ρ Magenta : for the partial regression coefficients. Each value corresponds to the length ratio of the bold part to the whole same-colored line section. X1 : annual total score gained X2: annual total score lost Y: zero minus annual ranking ( ρ[Y:X1] , ρ[Y:X2] ) = (0.419,-0.471) is plotted inside the ellipse slanted with ρ[X1:X2]=0.423. -> The meaning of numbers becomes clearer.
  • 23. Summary and findings of §2 Geometry of regression • Multiple-ρ is the similarity ratio of two ellipses/ellipsoids. • Partial-ρ is read by a graduated ruler in the ellipse/ellipsoids. • Each regression coefficients are given by the schalar field. So far, the derived numbers from MRA (Multiple Regression Analysis) have often said to be hard to recognize. But this situation can be changed.
  • 24. Summary as a whole [ Main resutls ] Using the ellipse or hyper-ellipsoid, • any correlation matrix is wholly pictorialized. • multiple regression is translated into geometric quotients. [ Sub results ] • ρ seems quite robust against axial deformations unless outliers exist. • (Spherical trigonometry may give you insights). <- Not referred today. [ Next steps ] • treat the parameter/sampling perturbations • systematize interesting statistical phenomena • produce new theories further on • give new twists to other research areas • make useful applications to the real world cases • organize a new logic system for this ambiguous world.
  • 25. Refs 1. 岩波数学辞典 Encyclopedic Dictionary of Mathematics, The Mathematical Society of Japan 2. R, http://www.r-project.org/ 3. 共分散構造分析 [事例編] The author sincerely welcomes any related literature.
  • 26. Background of this presentation SKIP 1. We make judgements from related things in daily or social life, but this real world is noisy and filled with exceptions. e.g. "Does the better posture and mental concentration cause the better performance?" 2. The real world data causes paradoxes : o any elaborate regression analysis mostly gives ρ < 0.7, how to deal? o data accuracy is not important when ρ < 0.7, details shown later. o why subjective sense works in the real? 3. Geometric interpretations of multiple regression analysis may be useful o that wholly takes in any correlation matrix o that is geometric using ellipsoids to observe, analyze the background phenomena in detail. 4. Then we will understand weak correlations that dominates our world.
  • 27. A primitive question SKIP Question Why(How) is data analysing important? My Answer It gives you inspirations and updates your recognition to the real world. Knowing the numbers μ, σ, ρ, ranking, VaR * from phenomena you have met is crucially important to make your next action in either of your daily, social or business life!! * average, std deviation, correlation coefficient, the rank order, Value at Risk And so, the interpretation of the numbers is necessary. (And I provides you that of ρ today!)
  • 28. Main ideas in more detail SKIP Using the ellipse or hyper-ellipsoid, • 2nd order moments are completely imaginable in a picture. • the numbers from Multiple-Regression are also imaginable. 1. (Pearson's) Correlation Coefficient • basic of statistics (as you know) • may change well when outliers are contained • however, changes only few against `monotone' map • depicted as 'correlation ellipse' 2. Multiple Regression Analysis • (Spherical Surface Interpretation) • Ellipse Interpretation
  • 29.
  • 30. Main ideas SKIP 1. What is the correlation coefficient after all? 2. Geometric interpretations of Multiple Regression Analysis.
  • 31. The mysterious robustness (3) SKIP front figures: x - original sampling correlation. y - 3-valued then correlation calculated. back figures: sample of 100.
  • 32.
  • 33. Summary of `§1. What is ρ? 'REDUNDANT • A correlation ρ is recognizable as an ellipse. • A correlation matrix is also recognizable as an ellipsoid. • ρ seems robust against axial deformations unless outliers exist. • You can guess `ρ' of a game by the champion.
  • 34.
  • 35. When partial-ρ is zero. (SKIP) The condition partial-ρ = 0 ⇔ • The inner angle of the spheric triangle is 90 degrees. • The two `hyper-planes' cross at 90 degrees at the `hyper- axis'. The axis corresponds the fixed variables and each of the planes contains each of the two variables. • On the ellipse/ellipsoid, the characteristic point is on the midpoint of the ruler.
  • 36. Multiple-ρ is the similarity ratio of ellipses [REDUNDANT ] Formulation of MRA [ Multiple - ρ ] The multiple-ρ (≦ 1) is the similarity ratio of the ellipses. For arbitrary variables number case, you calculate: the inverse of the correlation (When X・ is k-dimentional, the hyper- matrix → the reciprocal of each of the diagonal elements → 1 minus each of them ellipsoid is determined by k×k matrix → take the square root of each → each are whose elements are ρ [ Xi : Xj ], and the the multiple-ρ of the corresponding variable inner point is at p-dimensional vector whose from the rest variables. elements are ρ [ Xi : Y ] . )
  • 37. Summary and findings of §2 Geometry of regressionREDUNDANT • Multiple-ρ is the similarity ratio of two ellipses/ellipsoids. • Partial-ρ is read by a graduated ruler in the ellipse/ellipsoids. • Each regression coefficients are given by the scholar field. • (Spherical trigonometry) So far, the derived numbers from MRA have often said to be hard to recognize. But this situation can be changed.
  • 38. Introduction This page is added after the symposium This page may need intensive proofreading by the author. There is a Japanese word `kaizen', which means improvement. The problems still existing today are as follows: The real world is, however, so ambiguous that it often is hard to - The meaning of correlation value is not yet well known. know whether any kaizen action would make positive effect or not.- The meaning of multiple regression analysis is also not yet well known(, although when the correlation is weak the reasonable Sometimes your action may cause negative effect or zero effect choice of analysis is multiple analysis or its elaborate in an averaged sense even if you believe your action is a good derivatives). one. Assume a situation that you can control a variable to make some effect on the outcome variable (the number of control variables The author found that correlation is very robust against any would increase in the following). `axial deformations’ unless variables contain outliers. Rather sampling correlation coefficient perturbs much more in many The author's hypothetical proposition is that the correlation cases when N is less than 1000. The author also found coefficient indeed plays important role. A reason is that when the geometrical backgrounds of correlations of multiple regression correlation is positive then your rational action is just increasing analysis (Perhaps R.A.Fisher already knew that, but any person the value of the control variable. And it seems very reasonable around me didn’t know that) that is producing many insights. that you should select a strongly correlated variable to the output variable. (The robustness is not well analyzed at this moment (some pieces of analysis and numerical examples) The geometrical background is analyzed in basic points so the author is considering to investigate further for parameter perturbations.)