2. Contouring
• Basic Definitions in Contouring
• Contour Interval
• Characteristics of Contours
• purpose (uses) of contouring/contour map
2
3. 2
Basic Definitions in Contouring
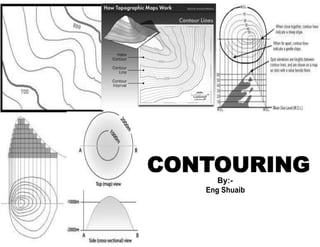
•Contour An imaginary line on the ground surface joining the
points of equal elevation is known as contour.
•It facilitates depiction of the relief of terrain in a two-
dimensional plan or map.
•In other words, contour is a line in which the ground surface
is intersected by a level surface obtained by joining points of
equal elevation. This line on the map represents a contour and
is called contour line.
•Contouring is the science of representing the vertical
dimension of the terrain on a two-dimensional map.
3
CONTOURING
4. Er. Pramesh Hada, Assistant
Professor, nec
4
Contours
Contour interval = 30 m
7. Relief or shape of the land is shown by
Contours
• Contours are those light
brown or orange lines that can
see on maps.
• A contour line is an imaginary
line that joins points of equal
height above sea level.
• The lines are numbered giving
the height above sea level in
meters.
• It is important to remember that
the closer together the contour lines
the steeper the slope
9. • Contour Map : A map showing contour lines is
known as Contour map.
• A contour map gives an idea of the altitudes of the
surface features as well as their relative positions in
plan serves the purpose of both, a planand a section.
• Contouring : The process of tracing contour lines
on the surface of the earth is called Contouring.
9
10. × Contour Line : A Contour line is an imaginary outline of the terrain
obtained by joining its points of equal elevation.
× Contour Interval (CI) – It is the vertical distance between any two
consecutive contours.
Suppose a map includes contour lines of 100m, 98m ,96 m and so
on. The contour interval here is 2 m.
This interval depends upon
(i) the nature of the ground (i.e. whether flat or sleep).
(ii) the scale of the map
(iii) the purpose of the survey.
Contour intervals for flat country are generally small, e g. 0.25 m,
0.5 m, 0.75m. etc. Contour interval for a steep slope in a hilly area
is generally greater. e.g. 5m. 10 m, 15 m etc.
It should be remembered that the contour interval for a particular
map is Constant.
12. • Horizontal Equivalent (HE)
Horizontal equivalent is the horizontal distance
between two consecutive contour lines measured to
the scale of the map.
– It is not constant. It varies according to the steepness of
the ground.
– For steep slopes, the contour lines run close together, and
for flatter slopes they are widely spaced.
12
13. uniformly spaced.
iv) A plane surface when they are straight, parallel and
equally spaced.
CHARACTERISTICS OF CONTOURS
i) All points in a contour line have the same elevation.
ii) Flat ground is indicated where the contours are widely
separated and steep-slope where they run close together.
iii) A uniform slope is indicated when the contour lines are
16. CHARACTERISTICS OF CONTOURS
v) A series of closed
contour lines on the 80
map represent a hill 75
, if the higher values 70
are inside 65
60
HILL
60
65
70
75
80
17. CHARACTERISTICS OF CONTOURS
80
vi) A series of 75
closed contour 70
lines on the map 65
indicate a
depression if the 60
higher values are
outside
DEPRESSION
70
6
0
65
70
75
80
A DEPRESSION
17
18. CHARACTERISTICS OF CONTOURS
vii) Contour line cross ridge or valley line at
right angles. If the higher values
100
90
80
are inside the bend or
loop in the contour, it
indicates a Ridge.
70
60
50
RIDGE LINE
19. CHARACTERISTICS OF CONTOURS
vii) Contour line cross ridge or valley line at
right angles.
If the higher values are
outside the bend, it
100 represents a Valley
90
80
70
60
50
VALLEY LINE
21. CHARACTERISTICS OF CONTOURS
ix).
Contour lines cannot 40
merge or cross one 30
another on map 20
except in the case of
an overhanging cliff.
40 30 20 10
OVERHANGING CLIFF
10
22. CHARACTERISTICS OF CONTOURS
x) Contour lines 50
never run into one
another except in
the case of a 30
vertical cliff. In 20
this case ,several 10
contours coincide
and the horizontal
equivalent becomes
zero.
OVERHANGING CLIFF
VERTIC
CLIFF
10 20 30 40
50
40
23. CHARACTERISTICS OF CONTOURS
XI) Depressions between
summits is called a saddle. It
is represented by four sets of
contours as shown. It
represents a dip in a ridge or
the junction of two ridges. 70
And
in the case of a mountain 80 range
,it takes the form of a 90
pass .
SADDLE 70
80
90
90
100
110
Line passing through the
saddles and summits gives
water shed line.
23
24. Think where is the steepest slope on this island?
200
150
100
50
25. Steepest slope –
contour lines are
closest together
Sparrow
point 227
.76
150
200
100
50
Sometimes spot heights can be shown as a dot with a note
of the height of that particular place.
A trigonometrical point (or trig point) shows the highest
26. point in an area (in meters and is shown as a blue triangle
32. 4
PURPOSE (uses) OF CONTOURING/CONTOUR MAP
Contour survey is carried out at the starting of any
engineering project such as a road, a railway, a canal, a
dam, a building etc.
i) contour maps are prepared in order to select the most
economical or suitable site.
ii) It helps to locate the alignment of a canal so that it
should follow a ridge line.
iii) It helps to mark the alignment of roads and railways so
that the quantity of earthwork both in cutting and filling
should be minimum.
33. iv) It helps for getting information about the ground
whether it is flat, undulating or mountainous.
v) It helps to find the capacity of a reservoir and volume
of earthwork especially in a mountainous region.
vi) It helps to trace out the given grade of a particular
route.
vii) It helps to locate the physical features of the ground
such as a pond depression, hill, steep or small slopes.
(Undulating – rising & falling