SlideShare una empresa de Scribd logo
1 de 4
Descargar para leer sin conexión
www.uila.com 1
Application-aware Virtual
Infrastructure Performance Management
Today’s virtualized data centers are opaque to traditional monitoring approaches
and enterprise IT lack the tools to be able to correlate application and infrastructure
performance to determine what is causing the application slowdown.
A Data Center’s infrastructure components – CPU, Memory, Network and Storage – may
have their own management tools but these tools are incapable of providing visibility
to the whole system or correlating that information back to a specific application’s
performance. As a result, organizations lack the resources to quickly and efficiently
resolve application performance issues and spend the majority of their valuable time
engaged in reactive troubleshooting or inter-departmental finger pointing, rather than
proactively improving application delivery.
Uila Application-aware Infrastructure Performance Management allows data centers to
gain visibility into their complex, virtualized infrastructure; reduce application outages
from hours to minutes; prevent outages that may arise from stressed infrastructure; and
proactively tune the performance of business-critical applications.
CPU
Application Topology & Performance
Memory Storage Networks
Solution Benefits
Align Infrastructure Performance Management
with Application Performance Management
•	 Full stack visibility – Application to
infrastructure correlation
•	 Gain key insights for virtualized data
center operations
Improve IT Efficiency by Reducing
Troubleshooting from Days to Minutes 

•	 Bridging silos – virtual/physical compute,
storage & network 

•	 One-click to application issue root cause
for remediation
Ensure Application Availability and Peak
Performance by Enabling Proactive Planning
•	 Identify application performance bottleneck
for optimization 

•	 Auto base-lining and trending for resource
capacity tuning
www.uila.com 2
Product Highlights
Application Visibility - 4000+ Applications Awareness
•	 Application auto discovery is completed with Uila
application classification technology to identify and group
data center applications.
•	 Application performance is measured and tracked real-time
in application response time in millisecond granularity to
ensure application service level.
•	 Application topology provides powerful application visibility
for complex multi-tier application interdependency mapping,
analysis and troubleshooting.
•	 Application transaction query, response and volume
information is recorded for deeper investigation into
application internals for specific transaction issue.
•	 Application server OS level details (per process) is gathered
to enable deeper root cause analysis.
•	 Agentless architecture leads the industry in application
visibility and virtual infrastructure monitoring for IT OPS.
•	 Embedded Deep Packet Inspection (DPI) 
technology
identifies more than 4,000 unique applications

Virtual Infrastructure Visibility - Virtualization
Visualized and Analyzed
•	 Virtual and physical network analysis fills the gap of data
center east-west (VM-to-VM) traffic blind spot unaddressed
or band-aided by most network monitoring solutions
•	 Virtual to physical resource map shines spotlights on usage
and bottleneck culprits with true infrastructure visibility
covering compute, storage and network
•	 Multi-vendor virtualization such as VMware, Hyper-V and
hybrid cloud are supported with a single pane of glass and
standard user interface
•	 Scalable Architecture powered by Big Data technology and
distributed virtual network traffic tap can be easily deployed
to support large size data center
•	 Visualization for the virtualized data center provides the
most intuitively infrastructure visibility leading to meaningful
and insightful analysis results
Converged Visibility - Application to
Infrastructure Correlation
•	 Data center full stack visibility converges application
visibility and infrastructure visibility to bridge the traditional
IT siloes and legacy solution deficiencies
•	 Immediate Root Cause Identification for application
performance issues can be quickly achieved and pinpointed
to infrastructure elements
•	 Application service outage prevention is guided by
integrated alerting and reporting available for data center
application, infrastructure and their correlation
•	 Planning and optimization for data center resources can
be best guided by Uila application-to-infrastructure
dependency map
Uila Dashboard
Root Cause Analysis
Flow Analysis
Application Topology
www.uila.com 3
Architecture & Solution Components
Uila
Management
and Analytics
System
(UMAS)
The core of Uila virtual infrastructure architecture is a big data store and analytics engine that are designed from ground
up to scale-out to accommodate large data center deployment with thousands of servers, to scale-in to record data in high
resolution, maintain history data while maintaining real time responsiveness. Built-in redundancy offers high availability,
removes downtime, and reduces maintenance overhead.
The patent-pending analytics engine is the brain that correlates application to infrastructure performance metrics, the smarts
to pinpoint infrastructure root cause why application performance is degraded. The trending reports generated from historical
data helps identify infrastructure hot spots, and maintains optimal application performance. The Uila Dashboard offers simple
and yet powerful way to view the results of the analytics engine and reveal the health of applications and the underlying
infrastructure in compute, storage, physical and virtual networks.
Virtual Smart
Tap (vST)
Virtual Smart Tap (vST) is deployed in a distributed manner across the data center. The vST installs in the host as a small foot print
and efficiently designed guest VM where it promiscuously listens to all traffic that traverses the virtual networks (North-South and
East-West). Using embedded Deep Packet Inspection (DPI) technology, the vST identifies unique applications and their attributes.
The vST measures application response time, network latency, and other network performance data in meta data form. No packet
payload is stored, thus removing the risk of exposing sensitive data. The vST passes this Application & Network Metadata to the
Virtual Information Controller (vIC) for further processing and correlating with the infrastructure metadata collected by the vIC.
Virtual
Information
Controller
(vIC)
Virtual Information Controller (vIC) is the integration conduit to the data center Virtualization Management System e.g.
VMware vCenter. The vIC retrieves your infrastructure configuration as a template to build Uila monitoring domain and to
streamline deployment.
The vIC collects network, storage and compute performance metrics that are maintained by vCenter, combines it with the
application and network metadata from all deployed vSTs, and then securely transmits it to the Uila Management and
Analytics System, either on-premise or in the cloud.
Uila Management
and Analytics
System (UMAS)
Uila vIC
Virtual
Information
Controller
Converged Physical Infrastructure
EventManager/
HelpDesk
Virtualization
Management
Center
Application &Infrastructure
Metadata(SSL)
Application&
NetworkMetadata
Compute Network Storage
Computer,Storage,
NetworkConfiguration
+ PerformanceData
Data
Storage
Uila vST
Virtual
SmartTap
vSwitch
Hypervisor
Servers
www.uila.com 4
Uila, Inc.
2905 Stender Way, Suite 76E
Santa Clara, California 95054
www.uila.com
(408) 819-0777
sales@uila.com
© Uila, Inc. All rights reserved. Uila is trademark of Uila, Inc. All specifications are subject to change without notice.
System Requirements
CPU Memory Storage Remark
Virtual Smart Tap
(vST)
1 vCPU (1 Core) 1 GB virtual memory 2 GB virtual storage, local
Virtual Information
Controller (vIC)
1 vCPU (1 Core) Virtual memory
4 GB (reservation)
8GB (max)
8 GB virtual storage, local,
thin provision
Uila Management
& Analytics System
(UMAS)
1 vCPU (4 Core) 32 GB virtual memory 2 TB virtual storage, local 1. Not required for Uila Cloud
2. Storage for six month of
data
Note: The default requirement is for monitoring up to 1,000 VM and Physical Devices. Refer to Installation Guide or Contact Uila if your
deployment is larger than 1,000 units.
Internet Browser Windows: Firefox, Edge, Chrome
OS X: Safari, Firefox, Chrome, Opera
Linux: Firefox, Chrome
Hypervisor VMware
VMware/NSX
Hyper-V
System SKUs
Description Remark
Uila AA-IPM Annual Subscription License for x number of pCPU sockets Including software updates and support
(Refer to www.uila.Com/support)
Uila AA-IPM Perpetual License for x number of pCPU sockets Software update and support
purchased separately. See PS-AIPM-x
Annual Support for Uila AA-IPM Perpetual License for x number of pCPU sockets Including software updates and support
(Refer to www.uila.Com/support)
1.	 pCPU is a physical socket populated with CPU chipset in a server or host.
2.	 x starts from 5, 10, 25, 50, 100, 500. Call Uila for additional SKU
About Uila
Uila has created a game-changing application-aware infrastructure performance management solution that redefines the way data
centers are able to manage and optimize system infrastructure and applications. Uila allows data centers to gain visibility into their
complex, virtualized infrastructure; reduce application outages from hours to minutes, prevent outages that may arise from stressed
infrastructure, and proactively tune the performance of business-critical applications. Designed specifically for virtualized environments,
Uila avoids the cost and deployment complexity of application or OS agents and the visibility issues associated with hardware-based
approaches. For more information, please visit www.uila.com.
vSphere ESXi 5.0, or higher vCenter Server 5.0 or higher
vSphere ESXi 5.5, or higher NSX 6.2, or higher
Standalone or Cluster mode Windows 2012 R2 or higher

Más contenido relacionado

Más de PT. Siwali Swantika

10 Langkah Kalibrasi Termometer.pdf
10 Langkah Kalibrasi Termometer.pdf10 Langkah Kalibrasi Termometer.pdf
10 Langkah Kalibrasi Termometer.pdfPT. Siwali Swantika
 
Pengujian Sistem Photovoltaic.pdf
Pengujian Sistem Photovoltaic.pdfPengujian Sistem Photovoltaic.pdf
Pengujian Sistem Photovoltaic.pdfPT. Siwali Swantika
 
Fluke Process Calibration Tools Catalog
Fluke Process Calibration Tools CatalogFluke Process Calibration Tools Catalog
Fluke Process Calibration Tools CatalogPT. Siwali Swantika
 
Fluke Temperature Calibration Catalog
Fluke Temperature Calibration CatalogFluke Temperature Calibration Catalog
Fluke Temperature Calibration CatalogPT. Siwali Swantika
 
Identifikasi dan Mitigasi Sumber Interferensi
Identifikasi dan Mitigasi Sumber InterferensiIdentifikasi dan Mitigasi Sumber Interferensi
Identifikasi dan Mitigasi Sumber InterferensiPT. Siwali Swantika
 

Más de PT. Siwali Swantika (20)

3 Metode Kalibrasi Sensor Suhu
3 Metode Kalibrasi Sensor Suhu3 Metode Kalibrasi Sensor Suhu
3 Metode Kalibrasi Sensor Suhu
 
10 Langkah Kalibrasi Termometer.pdf
10 Langkah Kalibrasi Termometer.pdf10 Langkah Kalibrasi Termometer.pdf
10 Langkah Kalibrasi Termometer.pdf
 
Pengujian Sistem Photovoltaic.pdf
Pengujian Sistem Photovoltaic.pdfPengujian Sistem Photovoltaic.pdf
Pengujian Sistem Photovoltaic.pdf
 
Fluke Process Calibration Tools Catalog
Fluke Process Calibration Tools CatalogFluke Process Calibration Tools Catalog
Fluke Process Calibration Tools Catalog
 
Fluke Temperature Calibration Catalog
Fluke Temperature Calibration CatalogFluke Temperature Calibration Catalog
Fluke Temperature Calibration Catalog
 
Vitrek Catalog
Vitrek CatalogVitrek Catalog
Vitrek Catalog
 
Rotronic Water Activity Series
Rotronic Water Activity SeriesRotronic Water Activity Series
Rotronic Water Activity Series
 
Rotronic Catalog 2022
Rotronic Catalog 2022Rotronic Catalog 2022
Rotronic Catalog 2022
 
Rotronic RMS Catalog
Rotronic RMS CatalogRotronic RMS Catalog
Rotronic RMS Catalog
 
Fluke Catalog 2022
Fluke Catalog 2022Fluke Catalog 2022
Fluke Catalog 2022
 
Metrel Catalog 2022
Metrel Catalog 2022Metrel Catalog 2022
Metrel Catalog 2022
 
NetAlly Product Family Brochure
NetAlly Product Family BrochureNetAlly Product Family Brochure
NetAlly Product Family Brochure
 
Trend Networks Catalog
Trend Networks CatalogTrend Networks Catalog
Trend Networks Catalog
 
SignalTEK-10G_Brochure
SignalTEK-10G_BrochureSignalTEK-10G_Brochure
SignalTEK-10G_Brochure
 
AirMagnet ® Survey PRO
AirMagnet ® Survey PROAirMagnet ® Survey PRO
AirMagnet ® Survey PRO
 
Pengukuran Water Activity
Pengukuran Water ActivityPengukuran Water Activity
Pengukuran Water Activity
 
10 Langkah Kalibrasi Termometer
10 Langkah Kalibrasi Termometer10 Langkah Kalibrasi Termometer
10 Langkah Kalibrasi Termometer
 
5 Keuntungan LanTEK IV-S
5 Keuntungan LanTEK IV-S5 Keuntungan LanTEK IV-S
5 Keuntungan LanTEK IV-S
 
Identifikasi dan Mitigasi Sumber Interferensi
Identifikasi dan Mitigasi Sumber InterferensiIdentifikasi dan Mitigasi Sumber Interferensi
Identifikasi dan Mitigasi Sumber Interferensi
 
Permasalahan Konektivitas WiFi
Permasalahan Konektivitas WiFiPermasalahan Konektivitas WiFi
Permasalahan Konektivitas WiFi
 

Último

Cloud Frontiers: A Deep Dive into Serverless Spatial Data and FME
Cloud Frontiers:  A Deep Dive into Serverless Spatial Data and FMECloud Frontiers:  A Deep Dive into Serverless Spatial Data and FME
Cloud Frontiers: A Deep Dive into Serverless Spatial Data and FMESafe Software
 
Real Time Object Detection Using Open CV
Real Time Object Detection Using Open CVReal Time Object Detection Using Open CV
Real Time Object Detection Using Open CVKhem
 
Strategies for Unlocking Knowledge Management in Microsoft 365 in the Copilot...
Strategies for Unlocking Knowledge Management in Microsoft 365 in the Copilot...Strategies for Unlocking Knowledge Management in Microsoft 365 in the Copilot...
Strategies for Unlocking Knowledge Management in Microsoft 365 in the Copilot...Drew Madelung
 
MINDCTI Revenue Release Quarter One 2024
MINDCTI Revenue Release Quarter One 2024MINDCTI Revenue Release Quarter One 2024
MINDCTI Revenue Release Quarter One 2024MIND CTI
 
EMPOWERMENT TECHNOLOGY GRADE 11 QUARTER 2 REVIEWER
EMPOWERMENT TECHNOLOGY GRADE 11 QUARTER 2 REVIEWEREMPOWERMENT TECHNOLOGY GRADE 11 QUARTER 2 REVIEWER
EMPOWERMENT TECHNOLOGY GRADE 11 QUARTER 2 REVIEWERMadyBayot
 
DBX First Quarter 2024 Investor Presentation
DBX First Quarter 2024 Investor PresentationDBX First Quarter 2024 Investor Presentation
DBX First Quarter 2024 Investor PresentationDropbox
 
Strategies for Landing an Oracle DBA Job as a Fresher
Strategies for Landing an Oracle DBA Job as a FresherStrategies for Landing an Oracle DBA Job as a Fresher
Strategies for Landing an Oracle DBA Job as a FresherRemote DBA Services
 
Polkadot JAM Slides - Token2049 - By Dr. Gavin Wood
Polkadot JAM Slides - Token2049 - By Dr. Gavin WoodPolkadot JAM Slides - Token2049 - By Dr. Gavin Wood
Polkadot JAM Slides - Token2049 - By Dr. Gavin WoodJuan lago vázquez
 
Strategize a Smooth Tenant-to-tenant Migration and Copilot Takeoff
Strategize a Smooth Tenant-to-tenant Migration and Copilot TakeoffStrategize a Smooth Tenant-to-tenant Migration and Copilot Takeoff
Strategize a Smooth Tenant-to-tenant Migration and Copilot Takeoffsammart93
 
Powerful Google developer tools for immediate impact! (2023-24 C)
Powerful Google developer tools for immediate impact! (2023-24 C)Powerful Google developer tools for immediate impact! (2023-24 C)
Powerful Google developer tools for immediate impact! (2023-24 C)wesley chun
 
Web Form Automation for Bonterra Impact Management (fka Social Solutions Apri...
Web Form Automation for Bonterra Impact Management (fka Social Solutions Apri...Web Form Automation for Bonterra Impact Management (fka Social Solutions Apri...
Web Form Automation for Bonterra Impact Management (fka Social Solutions Apri...Jeffrey Haguewood
 
Emergent Methods: Multi-lingual narrative tracking in the news - real-time ex...
Emergent Methods: Multi-lingual narrative tracking in the news - real-time ex...Emergent Methods: Multi-lingual narrative tracking in the news - real-time ex...
Emergent Methods: Multi-lingual narrative tracking in the news - real-time ex...Zilliz
 
"I see eyes in my soup": How Delivery Hero implemented the safety system for ...
"I see eyes in my soup": How Delivery Hero implemented the safety system for ..."I see eyes in my soup": How Delivery Hero implemented the safety system for ...
"I see eyes in my soup": How Delivery Hero implemented the safety system for ...Zilliz
 
FWD Group - Insurer Innovation Award 2024
FWD Group - Insurer Innovation Award 2024FWD Group - Insurer Innovation Award 2024
FWD Group - Insurer Innovation Award 2024The Digital Insurer
 
AWS Community Day CPH - Three problems of Terraform
AWS Community Day CPH - Three problems of TerraformAWS Community Day CPH - Three problems of Terraform
AWS Community Day CPH - Three problems of TerraformAndrey Devyatkin
 
Apidays New York 2024 - Scaling API-first by Ian Reasor and Radu Cotescu, Adobe
Apidays New York 2024 - Scaling API-first by Ian Reasor and Radu Cotescu, AdobeApidays New York 2024 - Scaling API-first by Ian Reasor and Radu Cotescu, Adobe
Apidays New York 2024 - Scaling API-first by Ian Reasor and Radu Cotescu, Adobeapidays
 
Exploring the Future Potential of AI-Enabled Smartphone Processors
Exploring the Future Potential of AI-Enabled Smartphone ProcessorsExploring the Future Potential of AI-Enabled Smartphone Processors
Exploring the Future Potential of AI-Enabled Smartphone Processorsdebabhi2
 
Apidays New York 2024 - The Good, the Bad and the Governed by David O'Neill, ...
Apidays New York 2024 - The Good, the Bad and the Governed by David O'Neill, ...Apidays New York 2024 - The Good, the Bad and the Governed by David O'Neill, ...
Apidays New York 2024 - The Good, the Bad and the Governed by David O'Neill, ...apidays
 
Ransomware_Q4_2023. The report. [EN].pdf
Ransomware_Q4_2023. The report. [EN].pdfRansomware_Q4_2023. The report. [EN].pdf
Ransomware_Q4_2023. The report. [EN].pdfOverkill Security
 
A Beginners Guide to Building a RAG App Using Open Source Milvus
A Beginners Guide to Building a RAG App Using Open Source MilvusA Beginners Guide to Building a RAG App Using Open Source Milvus
A Beginners Guide to Building a RAG App Using Open Source MilvusZilliz
 

Último (20)

Cloud Frontiers: A Deep Dive into Serverless Spatial Data and FME
Cloud Frontiers:  A Deep Dive into Serverless Spatial Data and FMECloud Frontiers:  A Deep Dive into Serverless Spatial Data and FME
Cloud Frontiers: A Deep Dive into Serverless Spatial Data and FME
 
Real Time Object Detection Using Open CV
Real Time Object Detection Using Open CVReal Time Object Detection Using Open CV
Real Time Object Detection Using Open CV
 
Strategies for Unlocking Knowledge Management in Microsoft 365 in the Copilot...
Strategies for Unlocking Knowledge Management in Microsoft 365 in the Copilot...Strategies for Unlocking Knowledge Management in Microsoft 365 in the Copilot...
Strategies for Unlocking Knowledge Management in Microsoft 365 in the Copilot...
 
MINDCTI Revenue Release Quarter One 2024
MINDCTI Revenue Release Quarter One 2024MINDCTI Revenue Release Quarter One 2024
MINDCTI Revenue Release Quarter One 2024
 
EMPOWERMENT TECHNOLOGY GRADE 11 QUARTER 2 REVIEWER
EMPOWERMENT TECHNOLOGY GRADE 11 QUARTER 2 REVIEWEREMPOWERMENT TECHNOLOGY GRADE 11 QUARTER 2 REVIEWER
EMPOWERMENT TECHNOLOGY GRADE 11 QUARTER 2 REVIEWER
 
DBX First Quarter 2024 Investor Presentation
DBX First Quarter 2024 Investor PresentationDBX First Quarter 2024 Investor Presentation
DBX First Quarter 2024 Investor Presentation
 
Strategies for Landing an Oracle DBA Job as a Fresher
Strategies for Landing an Oracle DBA Job as a FresherStrategies for Landing an Oracle DBA Job as a Fresher
Strategies for Landing an Oracle DBA Job as a Fresher
 
Polkadot JAM Slides - Token2049 - By Dr. Gavin Wood
Polkadot JAM Slides - Token2049 - By Dr. Gavin WoodPolkadot JAM Slides - Token2049 - By Dr. Gavin Wood
Polkadot JAM Slides - Token2049 - By Dr. Gavin Wood
 
Strategize a Smooth Tenant-to-tenant Migration and Copilot Takeoff
Strategize a Smooth Tenant-to-tenant Migration and Copilot TakeoffStrategize a Smooth Tenant-to-tenant Migration and Copilot Takeoff
Strategize a Smooth Tenant-to-tenant Migration and Copilot Takeoff
 
Powerful Google developer tools for immediate impact! (2023-24 C)
Powerful Google developer tools for immediate impact! (2023-24 C)Powerful Google developer tools for immediate impact! (2023-24 C)
Powerful Google developer tools for immediate impact! (2023-24 C)
 
Web Form Automation for Bonterra Impact Management (fka Social Solutions Apri...
Web Form Automation for Bonterra Impact Management (fka Social Solutions Apri...Web Form Automation for Bonterra Impact Management (fka Social Solutions Apri...
Web Form Automation for Bonterra Impact Management (fka Social Solutions Apri...
 
Emergent Methods: Multi-lingual narrative tracking in the news - real-time ex...
Emergent Methods: Multi-lingual narrative tracking in the news - real-time ex...Emergent Methods: Multi-lingual narrative tracking in the news - real-time ex...
Emergent Methods: Multi-lingual narrative tracking in the news - real-time ex...
 
"I see eyes in my soup": How Delivery Hero implemented the safety system for ...
"I see eyes in my soup": How Delivery Hero implemented the safety system for ..."I see eyes in my soup": How Delivery Hero implemented the safety system for ...
"I see eyes in my soup": How Delivery Hero implemented the safety system for ...
 
FWD Group - Insurer Innovation Award 2024
FWD Group - Insurer Innovation Award 2024FWD Group - Insurer Innovation Award 2024
FWD Group - Insurer Innovation Award 2024
 
AWS Community Day CPH - Three problems of Terraform
AWS Community Day CPH - Three problems of TerraformAWS Community Day CPH - Three problems of Terraform
AWS Community Day CPH - Three problems of Terraform
 
Apidays New York 2024 - Scaling API-first by Ian Reasor and Radu Cotescu, Adobe
Apidays New York 2024 - Scaling API-first by Ian Reasor and Radu Cotescu, AdobeApidays New York 2024 - Scaling API-first by Ian Reasor and Radu Cotescu, Adobe
Apidays New York 2024 - Scaling API-first by Ian Reasor and Radu Cotescu, Adobe
 
Exploring the Future Potential of AI-Enabled Smartphone Processors
Exploring the Future Potential of AI-Enabled Smartphone ProcessorsExploring the Future Potential of AI-Enabled Smartphone Processors
Exploring the Future Potential of AI-Enabled Smartphone Processors
 
Apidays New York 2024 - The Good, the Bad and the Governed by David O'Neill, ...
Apidays New York 2024 - The Good, the Bad and the Governed by David O'Neill, ...Apidays New York 2024 - The Good, the Bad and the Governed by David O'Neill, ...
Apidays New York 2024 - The Good, the Bad and the Governed by David O'Neill, ...
 
Ransomware_Q4_2023. The report. [EN].pdf
Ransomware_Q4_2023. The report. [EN].pdfRansomware_Q4_2023. The report. [EN].pdf
Ransomware_Q4_2023. The report. [EN].pdf
 
A Beginners Guide to Building a RAG App Using Open Source Milvus
A Beginners Guide to Building a RAG App Using Open Source MilvusA Beginners Guide to Building a RAG App Using Open Source Milvus
A Beginners Guide to Building a RAG App Using Open Source Milvus
 

UILA Application-aware Virtual Infrastructure Performance Management

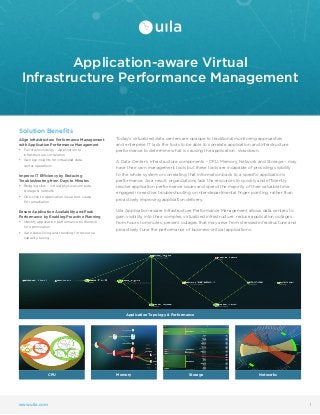
  • 1. www.uila.com 1 Application-aware Virtual Infrastructure Performance Management Today’s virtualized data centers are opaque to traditional monitoring approaches and enterprise IT lack the tools to be able to correlate application and infrastructure performance to determine what is causing the application slowdown. A Data Center’s infrastructure components – CPU, Memory, Network and Storage – may have their own management tools but these tools are incapable of providing visibility to the whole system or correlating that information back to a specific application’s performance. As a result, organizations lack the resources to quickly and efficiently resolve application performance issues and spend the majority of their valuable time engaged in reactive troubleshooting or inter-departmental finger pointing, rather than proactively improving application delivery. Uila Application-aware Infrastructure Performance Management allows data centers to gain visibility into their complex, virtualized infrastructure; reduce application outages from hours to minutes; prevent outages that may arise from stressed infrastructure; and proactively tune the performance of business-critical applications. CPU Application Topology & Performance Memory Storage Networks Solution Benefits Align Infrastructure Performance Management with Application Performance Management • Full stack visibility – Application to infrastructure correlation • Gain key insights for virtualized data center operations Improve IT Efficiency by Reducing Troubleshooting from Days to Minutes 
 • Bridging silos – virtual/physical compute, storage & network 
 • One-click to application issue root cause for remediation Ensure Application Availability and Peak Performance by Enabling Proactive Planning • Identify application performance bottleneck for optimization 
 • Auto base-lining and trending for resource capacity tuning
  • 2. www.uila.com 2 Product Highlights Application Visibility - 4000+ Applications Awareness • Application auto discovery is completed with Uila application classification technology to identify and group data center applications. • Application performance is measured and tracked real-time in application response time in millisecond granularity to ensure application service level. • Application topology provides powerful application visibility for complex multi-tier application interdependency mapping, analysis and troubleshooting. • Application transaction query, response and volume information is recorded for deeper investigation into application internals for specific transaction issue. • Application server OS level details (per process) is gathered to enable deeper root cause analysis. • Agentless architecture leads the industry in application visibility and virtual infrastructure monitoring for IT OPS. • Embedded Deep Packet Inspection (DPI) 
technology identifies more than 4,000 unique applications
 Virtual Infrastructure Visibility - Virtualization Visualized and Analyzed • Virtual and physical network analysis fills the gap of data center east-west (VM-to-VM) traffic blind spot unaddressed or band-aided by most network monitoring solutions • Virtual to physical resource map shines spotlights on usage and bottleneck culprits with true infrastructure visibility covering compute, storage and network • Multi-vendor virtualization such as VMware, Hyper-V and hybrid cloud are supported with a single pane of glass and standard user interface • Scalable Architecture powered by Big Data technology and distributed virtual network traffic tap can be easily deployed to support large size data center • Visualization for the virtualized data center provides the most intuitively infrastructure visibility leading to meaningful and insightful analysis results Converged Visibility - Application to Infrastructure Correlation • Data center full stack visibility converges application visibility and infrastructure visibility to bridge the traditional IT siloes and legacy solution deficiencies • Immediate Root Cause Identification for application performance issues can be quickly achieved and pinpointed to infrastructure elements • Application service outage prevention is guided by integrated alerting and reporting available for data center application, infrastructure and their correlation • Planning and optimization for data center resources can be best guided by Uila application-to-infrastructure dependency map Uila Dashboard Root Cause Analysis Flow Analysis Application Topology
  • 3. www.uila.com 3 Architecture & Solution Components Uila Management and Analytics System (UMAS) The core of Uila virtual infrastructure architecture is a big data store and analytics engine that are designed from ground up to scale-out to accommodate large data center deployment with thousands of servers, to scale-in to record data in high resolution, maintain history data while maintaining real time responsiveness. Built-in redundancy offers high availability, removes downtime, and reduces maintenance overhead. The patent-pending analytics engine is the brain that correlates application to infrastructure performance metrics, the smarts to pinpoint infrastructure root cause why application performance is degraded. The trending reports generated from historical data helps identify infrastructure hot spots, and maintains optimal application performance. The Uila Dashboard offers simple and yet powerful way to view the results of the analytics engine and reveal the health of applications and the underlying infrastructure in compute, storage, physical and virtual networks. Virtual Smart Tap (vST) Virtual Smart Tap (vST) is deployed in a distributed manner across the data center. The vST installs in the host as a small foot print and efficiently designed guest VM where it promiscuously listens to all traffic that traverses the virtual networks (North-South and East-West). Using embedded Deep Packet Inspection (DPI) technology, the vST identifies unique applications and their attributes. The vST measures application response time, network latency, and other network performance data in meta data form. No packet payload is stored, thus removing the risk of exposing sensitive data. The vST passes this Application & Network Metadata to the Virtual Information Controller (vIC) for further processing and correlating with the infrastructure metadata collected by the vIC. Virtual Information Controller (vIC) Virtual Information Controller (vIC) is the integration conduit to the data center Virtualization Management System e.g. VMware vCenter. The vIC retrieves your infrastructure configuration as a template to build Uila monitoring domain and to streamline deployment. The vIC collects network, storage and compute performance metrics that are maintained by vCenter, combines it with the application and network metadata from all deployed vSTs, and then securely transmits it to the Uila Management and Analytics System, either on-premise or in the cloud. Uila Management and Analytics System (UMAS) Uila vIC Virtual Information Controller Converged Physical Infrastructure EventManager/ HelpDesk Virtualization Management Center Application &Infrastructure Metadata(SSL) Application& NetworkMetadata Compute Network Storage Computer,Storage, NetworkConfiguration + PerformanceData Data Storage Uila vST Virtual SmartTap vSwitch Hypervisor Servers
  • 4. www.uila.com 4 Uila, Inc. 2905 Stender Way, Suite 76E Santa Clara, California 95054 www.uila.com (408) 819-0777 sales@uila.com © Uila, Inc. All rights reserved. Uila is trademark of Uila, Inc. All specifications are subject to change without notice. System Requirements CPU Memory Storage Remark Virtual Smart Tap (vST) 1 vCPU (1 Core) 1 GB virtual memory 2 GB virtual storage, local Virtual Information Controller (vIC) 1 vCPU (1 Core) Virtual memory 4 GB (reservation) 8GB (max) 8 GB virtual storage, local, thin provision Uila Management & Analytics System (UMAS) 1 vCPU (4 Core) 32 GB virtual memory 2 TB virtual storage, local 1. Not required for Uila Cloud 2. Storage for six month of data Note: The default requirement is for monitoring up to 1,000 VM and Physical Devices. Refer to Installation Guide or Contact Uila if your deployment is larger than 1,000 units. Internet Browser Windows: Firefox, Edge, Chrome OS X: Safari, Firefox, Chrome, Opera Linux: Firefox, Chrome Hypervisor VMware VMware/NSX Hyper-V System SKUs Description Remark Uila AA-IPM Annual Subscription License for x number of pCPU sockets Including software updates and support (Refer to www.uila.Com/support) Uila AA-IPM Perpetual License for x number of pCPU sockets Software update and support purchased separately. See PS-AIPM-x Annual Support for Uila AA-IPM Perpetual License for x number of pCPU sockets Including software updates and support (Refer to www.uila.Com/support) 1. pCPU is a physical socket populated with CPU chipset in a server or host. 2. x starts from 5, 10, 25, 50, 100, 500. Call Uila for additional SKU About Uila Uila has created a game-changing application-aware infrastructure performance management solution that redefines the way data centers are able to manage and optimize system infrastructure and applications. Uila allows data centers to gain visibility into their complex, virtualized infrastructure; reduce application outages from hours to minutes, prevent outages that may arise from stressed infrastructure, and proactively tune the performance of business-critical applications. Designed specifically for virtualized environments, Uila avoids the cost and deployment complexity of application or OS agents and the visibility issues associated with hardware-based approaches. For more information, please visit www.uila.com. vSphere ESXi 5.0, or higher vCenter Server 5.0 or higher vSphere ESXi 5.5, or higher NSX 6.2, or higher Standalone or Cluster mode Windows 2012 R2 or higher