1. Stock Report | July 14, 2008 | BSE SYMBOL: MARUTI.BO MARUTI.BO is in the ADM ADM
MARUTI SUZUKI LTD.
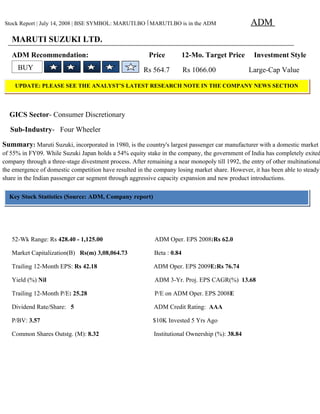
ADM Recommendation: Price 12-Mo. Target Price Investment Style
BUY Rs 564.7 Rs 1066.00 Large-Cap Value
UPDATE: PLEASE SEE THE ANALYST’S LATEST RESEARCH NOTE IN THE COMPANY NEWS SECTION
GICS Sector- Consumer Discretionary
Sub-Industry- Four Wheeler
Summary: Maruti Suzuki, incorporated in 1980, is the country's largest passenger car manufacturer with a domestic market
of 55% in FY09. While Suzuki Japan holds a 54% equity stake in the company, the government of India has completely exited
company through a three-stage divestment process. After remaining a near monopoly till 1992, the entry of other multinational
the emergence of domestic competition have resulted in the company losing market share. However, it has been able to steady
share in the Indian passenger car segment through aggressive capacity expansion and new product introductions.
Key Stock Statistics (Source: ADM, Company report)
52-Wk Range: Rs 428.40 - 1,125.00 ADM Oper. EPS 2008:Rs 62.0
Market Capitalization(B) Rs(m) 3,08,064.73 Beta : 0.84
Trailing 12-Month EPS: Rs 42.18 ADM Oper. EPS 2009E:Rs 76.74
Yield (%) Nil ADM 3-Yr. Proj. EPS CAGR(%) 13.68
Trailing 12-Month P/E: 25.28 P/E on ADM Oper. EPS 2008E
Dividend Rate/Share: 5 ADM Credit Rating: AAA
P/BV: 3.57 $10K Invested 5 Yrs Ago
Common Shares Outstg. (M): 8.32 Institutional Ownership (%): 38.84
5. Stock Report | July 14, 2008 | BSE SYMBOL: MARUTI.BO ADM
MARUTI SUZUKI LTD.
ECONOMIC ANALYSIS
-India at present is the fastest growing economy just after China
- Changing composition of GDP, reduced dependence on agriculture and growing industrial and service
sector acting as a positive momentum for the industry
-Stable Government formation.
-Inflation is under control.
INDUSTRY ANALYSIS
Stock Report | July 14, 2008 | BSE SYMBOL: MARUTI.BO ADM
MARUTI SUZUKI LTD.
Industry Growth [In terms of sales Fig (Units)]
Stock Report | July 14, 2008 | BSE SYMBOL: MARUTI.BO ADM
MARUTI SUZUKI LTD.
-Crude Oil dips to one month low, resistance $70
- Crude Oil prices are facing downward pressure once prices reach above $70 mark, as recent economic data is
still mixed and raising concerns in the mind of investors with regard to early economic recovery. With
unemployment rates at multi year high, consumers are unlikely to expedite consumption in the near term, which can
certainly curb the energy demand. Global risk sentiment is on the edge and if equity markets peak off, then we can
see fall in risk appetite, which can potentially reduce demand for higher yielding assets like commodities. Weekly
inventory data in US is showing that energy demand in world’s largest oil consuming nation is still more than 5%
less than last year. Despite US summer driving season underway, gasoline demand is not picking up, which is
certainly not a positive sign.
CRUDE OIL PRICE TREND
6. Traders will also have to look out for trend in dollar, as rising dollar can also weigh on oil prices. Rising
geopolitical tension in the Nigeria is the only possible factor which can lend support to oil prices. Due to above
mentioned factors; we expect that oil prices can face resistance near $70 levels and it can eventually head towards
$60-61 levels on the downside.
-
Stock Report | July 14, 2008 | BSE SYMBOL: MARUTI.BO Demand: Largely cyclical in nature
ADM
and dependent upon economic growth
MARUTI SUZUKI LTD. and per capita income. Seasonality is
also a vital factor.
The government spending on
OPPORTUNITIES: infrastructure in roads and airports and
higher GDP growth in the future will
• Increasing purchasing power of Indian middleclass category benefit the auto sector in general. We
expect a slew of launches in the Segment
• Govt. subsidies 'B' and Segment ‘C’ of passenger cars.
Utility vehicle segment is expected to
• Tax benefits grow at around 8% to 9% in the long-
• Foreign collaboration
We believe that as Maruti Suzuki is one of
the leading passenger car manufacturers in
India, it needs to make necessary
THREATS: improvements in its rural distribution
channels. Maruti Suzuki , like its other
automobile peers, e.g. Tata Motors,
• Threats from Chinese car manufacturers
Mahindra & Mahindra, Ford Motors etc.
• Indian as well as foreign competitors
MARKET PROFILE: The Indian automobile segment can be divided into
several segments viz. two-wheelers (motorcycles, geared and ungeared scooters
and mopeds), three wheelers, commercial vehicles (light, medium and heavy),
passenger cars, utility vehicles (UVs) and tractors. As compared to their global Board Members:
counterparts, both the two-wheeler as well as four wheeler segments are
relatively lesser fragmented. However, things are changing, especially on the Shuji Oishi
passenger cars front as many foreign majors are eyeing the Indian market. As a Tsuneo Kobayashi
result, pricing power is likely to diminish going forward. Kelichi Asai
O Suzuki
Supply: The Indian automobile market has some amount of excess capacity. Amal Ganguli
Pallavi Shroff
7. Manvinder Singh Banga
D S Brar Employees
Anil Rustgi 6,903
Tsuneo Ohashi
Masayuki Osada Stockholders
1,09.958
Domicile has a
Gurgaon, Haryana
Founded
1981
Stock Report | July 14, 2008 | BSE SYMBOL: MARUTI.BO ADM
MARUTI SUZUKI LTD.
has a large-scale distribution network backed by its effective sales force for the enterprise & government markets,
Company-owned exclusive showrooms, True value stores and Internet websites. More emphasis is required to be made in
the luxury & SUV car division& After-sales services, in our opinion.
The Automobile sector is one of the most booming sectors of India during the recent years. Though due to the negative
impacts of the global downturn, there was a slump in the sales figures of different automobile companies. But there is
17% annual growth rate in the Indian automobile industry since 1991 especially in the passenger car division where the
growth is roughly 28%.The demand for passenger cars is increasing day-by-day. Focusing on the ‘community’ car
segment may help Maruti to increase its market share & customer base.
PORTER’S FIVE FORCE MODEL ON consumers can use other conventional means of
MARUTI SUZUKI transportation such as bicycling or walking.
Threat of New Entrants - Very Low Power of Suppliers – Medium
In order to enter the automotive market a huge amount of Some suppliers are smaller and as such do not have that
capital is required. In addition, an entering firm would much power over the pricing and distribution of their
need to have a tremendous amount of tacit and explicit products. However, there are not that many small parts
knowledge to design and manufacture products. manufacturers in this market and therefore, the majority
of suppliers to major automotive makers are medium to
Threat of Substitutes - Medium
Available substitutes include public transportation such
as buses, trains, boats, and aircraft. In addition, large businesses. As a result they have some flex in
determining product pricing, delivery, and distribution.
8. Power of Buyers - Low Any competitor in this market is generally a global
company with billions of dollars in assets and can
While buyers are individuals and are not grouped compete on any level that Maruti can. Furthermore, there
together, they still have an immense amount of is intense competition on all fronts in the car market in
information available to them regarding the pricing and general, not to mention the luxury car market. Major
cost to manufacture of Maruti Suzuki, though this has a manufacturers such as Toyota, Honda & BMW are
negligible impact on sales of Maruti. As a result, buyers pinching Maruti with their luxury segments (Lexus, Acura,
don’t have any power to negotiate the purchasing price 7-Series) in terms of quality product and reliability.
with Maruti.
Competitive Rivalry – Extremely High
Stock Report | July 14, 2008 | BSE SYMBOL: MARUTI.BO ADM
MARUTI SUZUKI LTD.
BCG MATRIX of MARUTI SUZUKI fallen to ladder 3 & 4 due to introduction of
ZEN ESTALIO and A STAR.
QUESTION MARK: They are also called as
“wild cats” , that are new products with
potential for success but their cash needs are
high and cash generation is low.
In auto industry of MARUTI SX4, GRAND
VITARA, ASTAR, there has to be certain
STAR: The Company has long run opportunity improvements in performance so that the
for growth and profitability. They have high organization reputation can be maintained as
relative market share and high growth rate. they want to be successful not only in Indian
SWIFT, SWIFT DESIRE AND ZEN ESTILO market but as well as in global market.
is the fast growing and has potential to gain
DOG: The dogs have no market share and do
substantial profit in the market.
not have potential to bring in much cash.
CASH COW: It has high relative market share In case of BALENO, OMNI, VERSA; their
but compete in low growth rate as they business have liquidated and trim down thus
generate cash in excess of their needs. the strategies adopted are that are harvest,
MARUTI 800, ALTO AND WAGON-R have divest and drop.
9. Stock Report | July 14, 2008 | BSE SYMBOL: MARUTI.BO ADM
MARUTI SUZUKI LTD.
IMPACT OF MAJOR DEVELOPMENTS: On May & July, 2009, Maruti successfully launched two
of its most awaited cars named Ritz(Compact) & Vitara (SUV).On June, 2009 it won the 'Golden Peacock Eco-
Innovation Award for adopting environment friendly technology in its products and processes.. On the same
month, Maruti declared a price-cut in the passenger cars to pass on the benefits of the excise duty reductions to
their customers. The company is focusing on its cost reduction programs, companywide as well as with business
associates. The company increased its total production capacity to one million units at theGorgaon and Manesar
Plants. Recently the company has inaugurated the new generation KB series engine plant in Gurgaon.Targeting
in a big way to rural as well as corporate clients. Rural sales have accounted for most of the incremental growth
in H1FY09. Rural sales accounted for5% of total sales and grew by 59% in H1FY09 and corporates segments
acoounted for 18-20% of net sales and grew by 50% in H1FY09. Rabi crop was good and Kharib crop is
expected to turn good money in the hands of rurals, so the demand for car is expected to go up. Sixth Pay
commission is expected to boost demand and improve consumer sentiments
QUANTITATIVE EVALUATION
Stock Report | July 14, 2008 | BSE SYMBOL: MARUTI.BO ADM
MARUTI SUZUKI LTD.
Financials
p
10. No. of Months 12 12 12
Year Ending * 31/03/2006 * 31/03/2007 * 31/03/2008
* Results Consolidated
EQUITY SHARE DATA
High Rs 944 991 1,252
Low Rs 393 670 713
Sales per share Rs 420.3 511.9 626.6
Earnings per share Rs 42.2 54.9 62.0
Cash flow per share Rs 52.2 64.4 81.8
Dividends per share Rs 3.50 4.50 5.00
Dividend yield (eoy) % 0.5 0.5 0.5
Book value per share Rs 192.9 242.5 298.6
Shares outstanding (eoy) m 288.91 288.91 288.91
Bonus/Rights/Conversions - - -
Price / Sales ratio x 1.6 1.6 1.6
Avg P/E ratio x 15.8 15.1 15.9
P/CF ratio (eoy) x 12.8 12.9 12.0
Price / Book Value ratio x 3.5 3.4 3.3
Dividend payout % 8.3 8.2 8.1
Avg Mkt Cap Rs m 193,136 239,998 283,854
No. of employees `000 3 3 7
Total wages/salary Rs m 2,377 2,965 3,644
Avg. sales/employee Rs Th 36,422.3 42,827.7 25,534.7
Avg. wages/employee Rs Th 713.0 858.7 514.0
Avg. net profit/employee Rs Th 3,656.6 4,591.4 2,524.5
INCOME DATA
Net Sales Rs m 121,432 147,884 181,041
Other income Rs m 5,267 6,673 9,324
Total revenues Rs m 126,699 154,557 190,365
Gross profit Rs m 15,685 19,312 21,956
Depreciation Rs m 2,891 2,755 5,727
Interest Rs m 223 404 625
Profit before tax Rs m 17,838 22,826 24,928
Minority Interest Rs m 25 0 0
Prior Period Items Rs m 0 0 0
Extraordinary Inc (Exp) Rs m 68 308 849
Tax Rs m 5,740 7,280 7,878
Profit after tax Rs m 12,191 15,854 17,899
Gross profit margin % 12.9 13.1 12.1
Effective tax rate % 32.2 31.9 31.6
Net profit margin % 10.0 10.7 9.9
BALANCE SHEET DATA
Current assets Rs m 42,481 38,938 32,021
Current liabilities Rs m 20,788 25,132 28,399
Net working cap to sales % 17.9 9.3 2.0
Current ratio x 2.0 1.5 1.1
11. Inventory Turnover Days 27 18 21
Debtors Turnover Days 20 19 14
Net fixed assets Rs m 20,491 29,530 41,139
Share capital Rs m 1,445 1,445 1,445
"Free" reserves Rs m 54,096 68,489 84,795
Net worth Rs m 55,730 70,065 86,271
Long term debt Rs m 5,797 5,356 5,395
Total assets Rs m 84,119 103,614 125,809
Interest coverage x 81.0 57.5 40.9
Debt to equity ratio x 0.1 0.1 0.1
Sales to assets ratio x 1.4 1.4 1.4
Return on assets % 20.2 21.6 20.2
Return on equity % 21.9 22.6 20.7
Return on capital % 29.5 31.2 28.8
Exports to sales % 4.8 3.9 4.1
Imports to sales % 13.4 9.6 12.5
Exports (fob) Rs m 5,839 5,781 7,413
Imports (cif) Rs m 16,260 14,230 22,611
Fx inflow Rs m 5,839 5,781 7,413
Fx outflow Rs m 18,652 18,095 28,221
Net fx Rs m -12,813 -12,314 -20,808
* Results Consolidated
EVA 502.74 -3240.44 -4212.78
Stock Report | July 14, 2008 | BSE SYMBOL: MARUTI.BO ADM
MARUTI SUZUKI LTD.
COMPANY ANALYSIS
12. Company standing: With the company being an industry leader in four wheelers with 55% market share, its
standing in the automobile sector is definitely on the stronger side.
Revenue: Maruti is showing a growth in revenue of almost 50% over last 2 years.
EPS Growth: Maruti has grown its net profits at a CAGR of 13.65 % in the past three years.So in the coming years
we expect it to grow further.
Return on capital invested (ROIC): ROIC is an important tool to assess a company's potential to be a quality
investment by determining how well the management is able to allocate capital to its operations for future growth. A
ROIC of above 15% is considered decent for companies that are in an expansionary phase.Maruti has an average
ROIC of 29.83% over the last three years.
Dividend payout: A stable dividend history inspires confidence in the management's intentions of rewarding
shareholders. Maruti’s average payout ratio has been as high as 75% over the past 3 fiscals.
Promoter holding: A larger share of promoter holding indicates the confidence of the people who run it. We believe
that a greater than 40% promoter holding indicates safety for retail investors. Promoter shareholding in Maruti is
54.2%(Foreign Collaborators).
Stock Report | July 14, 2008 | BSE SYMBOL: MARUTI.BO ADM
MARUTI SUZUKI LTD.
FII Holding: We believe that FII holding of greater than 14% can lead to high volatility in the stock price. The FII
holding in Maruti in 2008 stood at 14.8%.
P/E Ratio: This ratio indicates relationship between the no. of times the EPS is covered by its market price. So
higher the ratio indicates superior performance. In case of Maruti, it shows a stable P/E ratio over the past few years.
PEG Ratio: It is a widely employed indicator of a stock’s possible true value. A lower PEG means that the stock is
undervalued more. Here, it is being improving over the past few years.
Debt-Equity Ratio: The greater D/E ratio indicates, greater risk to the creditors/lenders. This ratio indicates long term
solvency position of the Company. Maruti has maintained a preferable ratio of 0.1.
Current Ratio: It shows the short-term solvency position of the firm.In case of Maruti, the Current ratio is showing a
deteriorating trend.
Interest coverage Ratio: It is used to determine how comfortably a company is placed in terms of payment of
interest on outstanding debt .The lower the ratio, the greater is the risk. It is also showing a deteriorating trend.
13. Tobin-Q Ratio: It is a ratio comparing the market value of a company's stock with the value of a company's equity
book value. High Tobin's q values encourage companies to invest more in capital because they are "worth" more than
the price they paid for them. Here it has been increasing, so it favorable for the company.
MVA: The higher the MVA, the better. A high MVA indicates the Company has created substantial worth for
shareholders. For Maruti, the MVA has considerably fell down in 2008 compare to 2006 & 2007.
EVA: In case of Maruti, the EVA is showing a negative trend for last 2 years.So it is a alarming factor for the Maruti.
QUALITATIVE RISK ASSESSMENT
LOW MEDIUM HIGH
-PAT,EPS,EBDIT has been increasing.operating margin to bounce back as commodity show sing of cooling off.
We predict that Maruti’s balance sheet position will be strengthen in future.
CONCLUSION
This is the high time the investors should go for purchasing the shares because it is predicted that the share
price will increase further. Adding to this from the daily stock price also the upward trend is clearly
visible. So the potential investors should invest in the firm.
SOURCE OF INFORMATION
- www.marutisuzuki.com
-CMIE data base
-Finance.yahoo.com
-Equitymaster.com
-BNP Paribas.com
-scribd.com