Boletín 29-04-15
•
0 recomendaciones•261 vistas

Boletín de bolsa diario para el 29 de abril de 2015.

Recomendados
Más contenido relacionado
La actualidad más candente
La actualidad más candente (20)
Destacado
Destacado (10)
Similar a Boletín 29-04-15
Similar a Boletín 29-04-15 (20)
Último
Último (20)
Boletín 29-04-15
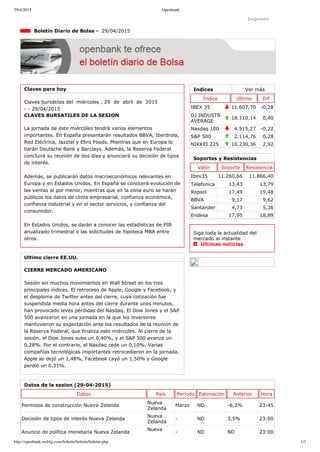
- 1. 29/4/2015 Openbank http://openbank.webfg.com/boletin/boletin/boletin.php 1/3 Indices Ver más Índice Último Dif IBEX 35 11.607,70 0,28 DJ INDUSTR AVERAGE 18.110,14 0,40 Nasdaq 100 4.515,27 0,22 S&P 500 2.114,76 0,28 NIKKEI 225 10.230,36 2,92 Imprimir Boletín Diario de Bolsa 29/04/2015 Claves para hoy Claves bursátiles del miércoles , 29 de abril de 2015 29/04/2015 CLAVES BURSATILES DE LA SESION La jornada de este miércoles tendrá varios elementos importantes. En España presentarán resultados BBVA, Iberdrola, Red Eléctrica, Jazztel y Ebro Foods. Mientras que en Europa lo harán Deutsche Bank y Barclays. Además, la Reserva Federal concluirá su reunión de dos días y anunciará su decisión de tipos de interés. Además, se publicarán datos macroeconómicos relevantes en Europa y en Estados Unidos. En España se conocerá evolución de las ventas al por menor, mientras que en la zona euro se harán públicos los datos de clima empresarial, confianza económica, confianza industrial y en el sector servicios, y confianza del consumidor. En Estados Unidos, se darán a conocer las estadísticas de PIB anualizado trimestral o las solicitudes de hipoteca MBA entre otros. Ultimo cierre EE.UU. CIERRE MERCADO AMERICANO Sesión sin muchos movimientos en Wall Street en los tres principales índices. El retroceso de Apple, Google y Facebook, y el desplome de Twitter antes del cierre, cuya cotización fue suspendida media hora antes del cierre durante unos minutos, han provocado leves pérdidas del Nasdaq. El Dow Jones y el S&P 500 avanzaron en una jornada en la que los inversores mantuvieron su expectación ante los resultados de la reunión de la Reserva Federal, que finaliza este miércoles. Al cierre de la sesión, el Dow Jones sube un 0,40%, y el S&P 500 avanza un 0,28%. Por el contrario, el Nasdaq cede un 0,10%. Varias compañías tecnológicas importantes retrocedieron en la jornada. Apple se dejó un 1,48%, Facebook cayó un 1,50% y Google perdió un 0,31%. Soportes y Resistencias Valor Soporte Resistencia Ibex35 11.260,66 11.866,40 Telefonica 13,43 13,79 Repsol 17,49 19,48 BBVA 9,17 9,62 Santander 4,73 5,36 Endesa 17,95 18,89 Siga toda la actualidad del mercado al instante Últimas noticias Datos de la sesion (29042015) Datos País Período Estimación Anterior Hora Permisos de construcción Nueva Zelanda Nueva Zelanda Marzo ND 6,3% 23:45 Decisión de tipos de interés Nueva Zelanda Nueva Zelanda ND 3,5% 23:00 Anuncio de política monetaria Nueva Zelanda Nueva ND ND 23:00
- 2. 29/4/2015 Openbank http://openbank.webfg.com/boletin/boletin/boletin.php 2/3 Zelanda Decisión de tipos de interés de la Fed EE.UU. EE.UU. ND 0,25% 20:00 Subasta del bono a 7 años EE.UU. EE.UU. ND 1,792% 19:00 Subasta de Bonos del Estado a 2 años EE.UU. EE.UU. ND ND 19:00 Resultados Jazztel 1T ND ND 17:45 Existencias semanales petróleo EIA EE.UU. EE.UU. Abril ND 5,315M 16:30 Ventas de viviendas pendientes EE.UU. EE.UU. Marzo 1,0% 3,1% (12% y/y) 16:00 Índice de precios del PIB EE.UU. EE.UU. 1T 0,5% 0,1% 14:30 Deflactor del gasto en consumo personal EE.UU. EE.UU. 1T 1,8% 4,4% 14:30 Deflactor subyacente del gasto en consumo personal subyacente EE.UU. EE.UU. 1T ND 1,1% 14:30 PIB EE.UU. EE.UU. 1T 1,0% 2,2% 14:30 Producción industrial Canadá Canadá Marzo ND 1,8% 14:30 Índice de precios de materias primas Canadá Canadá Marzo ND 6,1% 14:30 PIB EE.UU. EE.UU. 1T 1,0% 2,2% 14:30 IPC Alemania Alemania Abril ND 0,5% (0,3% y/y) 14:00 Índice armonizado de precios al consumo (IPCA) Alemania Alemania Abril ND 0,5% (0,1% y/y) 14:00 Solicitudes de hipotecas MBA EE.UU. EE.UU. Abril ND 2,3% 13:00 Encuesta sector minorista CBI Reino Unido Reino Unido Abril 25 18 12:00 Confianza industrial Zona Euro Zona Euro Abril ND 2,9 11:30 Clima empresarial Zona Euro Zona Euro Abril ND 0,23 11:00 Boletín mensual BCE Zona Euro Zona Euro ND ND 11:00 Confianza consumidor Zona Euro Zona Euro Abril ND 4,6 11:00 Confianza de servicios Zona Euro Zona Euro Abril ND 6 11:00 Indicador de Sentimiento Económico Zona Euro Zona Euro Abril ND 103,9 11:00 M3 Zona Euro Zona Euro Marzo ND 3,8% (4% y/y) 10:00 Préstamos Netos a Particulares Zona Euro Zona Euro Marzo ND 0,1% y/y 10:00 Confianza consumidor Italia Italia Abril ND 110,9 10:00 Confianza empresarial Italia Italia Abril ND 103,7 10:00 Ventas al por menor España España Marzo ND 2,7% y/y 09:00 Índice precios viviendas Nationwide Reino Unido Reino Unido Abril 0,2% (4,1% y/y) 0,1% (5,1% y/y) 08:00 Indicador UBS de consumo Suiza Suiza Marzo ND 1,19 08:00 Resultados Iberdrola 1T ND ND 08:00 Confianza empresarial ANZ Nueva Zelanda Nueva Zelanda Abril ND 35,8 03:00 Ventas al por menor Alemania Alemania Marzo ND 0,5% (3,6% y/y) 00:00 Subasta bonos a 10 años Reino Unido Reino Unido ND 1,683% 00:00 Resultados Red Eléctrica 1T ND ND 00:00 Resultados BBVA 1T ND ND 00:00 Resultados Ebro Foods 1T ND ND 00:00 Resultados Barclays 1T 0,073 lib/acn ND 00:00 NOTA COMPLEMENTARIA:Las decisiones que se puedan tomar en base a dicha información no implica en ningún caso responsabilidad de Openbank por sus posibles consecuencias tanto financieras, fiscales y cualesquiera otras derivadas de su interpretación. Se recomienda al inversor que sea éste quien realize su propio análisis y evalúe las ventajas y riesgos que implica cada operación. © 20012007 Bolsamania Tech Solution | División de Web Financial Group S.A. Todos los derechos reservados