SlideShare una empresa de Scribd logo
1 de 7
Descargar para leer sin conexión
Mapping of the Kerkennah seabed between 1886 and 2022:
By Mahdi Madi
Objective:
create a map showing the evolution of the seabed
along the eastern coast of Tunisia, including the
Kerknah and Djerba islands, between 1886 and 2022.
Tools and software:
• Bathymetric survey maps 1886
• ArcGIS PRO (Data processing software)
• GEBCO (Current Bathymetric data)
• Microsoft Excel
• The first step was to digitize the map. This involves scanning the physical map and converting it into a digital
format that can be viewed and edited on a computer.
• Once the map was digitized, it was imported into the ArcGIS software for further processing.
• ArcGIS is a powerful geographic information system (GIS) software that allows users to analyse, manage, and
display spatial data. It can be used to create maps, perform spatial analysis, and manage geographic data.
• The digitized map was then overlaid with bathymetry data from GEBCO, a web site that provides global
bathymetry data. This allows the examination of changes in the seabed over time and create a map showing
the evolution of the seabed between 1886 and 2022.
• The results were then presented in a Microsoft Excel spreadsheet, allowing for easy visualization and analysis
of the data.
In ArcGIS Pro, digitizing is the process of creating vector data by tracing over existing features or drawing them
manually on a map. Digitizing is a common task in GIS, as it allows users to create accurate, detailed maps and spatial
data that can be used for a wide range of applications.
To digitize features in ArcGIS Pro, you will need to have a map open and be in an editable layer. You can then use the
"Edit" tab in the ribbon to access the digitizing tools. Some common digitizing tools include:
• "Add Point": Allows you to create a new point feature by clicking on the map.
• "Add Line": Allows you to create a new line feature by clicking on the map to set vertices.
• "Add Polygon": Allows you to create a new polygon feature by clicking on the map to set vertices.
You can also use the "Sketch" tool to draw freehand lines or polygons on the map.
Once you have created a new feature, you can use the "Edit" tab to modify it by adding, deleting, or moving vertices.
You can also use the "Attribute Table" to add or edit the attributes of the feature.
Digitizing can be a time-consuming process, but it is an important skill to have in GIS as it allows you to create
accurate and detailed maps and spatial data.
Digitizing:
study area 4235 - 1
1866 Radial-Basis-Function:
In ArcGIS Pro, a radial basis function (RBF) is a
mathematical function that can be used to
interpolate scattered data points. RBF
interpolation is a method of estimating the value
of a function at a given point based on the values
of the function at nearby points.
RBF interpolation can be useful in many
applications, including creating continuous
surfaces from discrete data points, smoothing
noisy data, and estimating missing data values.
To use RBF interpolation in ArcGIS Pro, you will
need to have the Spatial Analyst extension
installed. With the Spatial Analyst extension, you
can use the "RBF Interpolation" tool to create an
RBF surface from a set of input data points. The
tool allows you to specify the type of RBF
function to use, as well as the search radius and
other parameters that control the interpolation
process.
Once the RBF surface has been created, you can
use it to perform spatial analysis, create maps,
and perform other tasks in ArcGIS Pro.
Reversing the depth data (post radial-basis function)
(The data need to be reversed to negative values to
effectively measure erosion and sedimentation values)
Raster functions are applied to a raster dataset or map
service in a similar way to how a formula is applied to
a cell in a spreadsheet. They take one or more input
rasters and apply a set of operations to them, producing
an output raster as a result.
2022 GEBCO data:
GEBCO (the General Bathymetric
Chart of the Oceans) is a global
bathymetric chart that provides a
comprehensive and publicly available
dataset of the Earth's oceans. GEBCO
is a collaborative effort between the
International Hydrographic
Organization (IHO) and the
Intergovernmental Oceanographic
Commission (IOC) of the United
Nations Educational, Scientific, and
Cultural Organization (UNESCO).
The GEBCO dataset is created using a
combination of data sources,
including ship-based soundings,
satellite altimetry, and digital
elevation models. The data is then
compiled and quality-controlled to
create a consistent and accurate
representation of the Earth's ocean
floor.
The GEBCO dataset is available for
free download from the GEBCO
website and is widely used by ocean
scientists, marine engineers, and
others working in the field of
oceanography. It is also used in the
creation of nautical charts and other
products that help people navigate
the oceans safely.
surface volume 1886
In ArcGIS Pro, the "Surface Volume" tool can be used
to calculate the volume of material that has been
added to or removed from a surface over a specified
period of time. This can be useful for a variety of
applications, including measuring the volume of
earthmoving projects, calculating the volume of
sediment deposited in a river or stream, and
estimating the volume of material that has been
removed from or added to a site due to erosion or
other processes.
To use the "Surface Volume" tool in ArcGIS Pro, you
will need to have the 3D Analyst extension installed.
With the 3D Analyst extension, you can access the
"Surface Volume" tool by going to the "3D Analyst"
tab and clicking on the "Surface Volume" button.
To use the tool, you will need to provide two input
surfaces: a "Before" surface representing the initial
state of the surface, and an "After" surface
representing the final state of the surface. The tool
will then calculate the volume of material that has
been added or removed between the two surfaces.
The results of the calculation can be displayed as a
3D surface or as a table of values.
Surface volume 1866
Surface volume 2022
Cutfill:
In ArcGIS Pro, the "Cut Fill" tool is used to calculate the
volume of material that has been added to or removed
from a surface. This can be useful for a variety of
applications, including estimating the amount of material
required for an earthmoving project, calculating the
volume of sediment deposited in a river or stream, and
estimating the volume of material that has been
removed from or added to a site due to erosion or other
processes.
To use the "Cut Fill" tool in ArcGIS Pro, you will need to
have the 3D Analyst extension installed. With the 3D
Analyst extension, you can access the "Cut Fill" tool by
going to the "3D Analyst" tab and clicking on the "Cut
Fill" button.
To use the tool, you will need to provide two input surfaces: a "Before" surface representing the initial state of the
surface, and an "After" surface representing the final state of the surface. The tool will then calculate the volume of
material that has been added or removed between the two surfaces and display the results as a 3D surface or as a
table of values. The results can be used to visualize the changes in the surface and to estimate the amount of
material required for an earthmoving project.
eroded
volume
sedimented
volume
erosion
speed
sedimentation
speed
area affected
by
sedimentation
Area affected
by erosion
1301766989
m3
-7427727898
m3
9571816.096
m3
/year
-54615646.31
m3
/year
780010741.9
m²
659441258.1
m²
Charting the Transformation of the Seabed: A Historical Journey along Tunisia's Eastern Coast, Encompassing Kerkennah and Djerba Islands from 1886 to 2022

Más contenido relacionado

Similar a Charting the Transformation of the Seabed: A Historical Journey along Tunisia's Eastern Coast, Encompassing Kerkennah and Djerba Islands from 1886 to 2022

brandonbal-afm_tech
brandonbal-afm_techbrandonbal-afm_tech
brandonbal-afm_tech
Brandon Bal
 
ArcGIS_Collector_Field_Guide_201411204_
ArcGIS_Collector_Field_Guide_201411204_ArcGIS_Collector_Field_Guide_201411204_
ArcGIS_Collector_Field_Guide_201411204_
Sacha Selim
 
Geoscience For Gis A
Geoscience For Gis AGeoscience For Gis A
Geoscience For Gis A
Andrew Zolnai
 

Similar a Charting the Transformation of the Seabed: A Historical Journey along Tunisia's Eastern Coast, Encompassing Kerkennah and Djerba Islands from 1886 to 2022 (20)

High Accuracy Data Collection with Esri's Collector App
High Accuracy Data Collection with Esri's Collector AppHigh Accuracy Data Collection with Esri's Collector App
High Accuracy Data Collection with Esri's Collector App
 
brandonbal-afm_tech
brandonbal-afm_techbrandonbal-afm_tech
brandonbal-afm_tech
 
Mapping toolbox
Mapping toolboxMapping toolbox
Mapping toolbox
 
Geographic information system
Geographic information systemGeographic information system
Geographic information system
 
RS and GIS TW- 1&2.pdf
RS and GIS TW- 1&2.pdfRS and GIS TW- 1&2.pdf
RS and GIS TW- 1&2.pdf
 
Argis manual gratuito
Argis manual gratuitoArgis manual gratuito
Argis manual gratuito
 
Argis manual gratuito
Argis manual gratuitoArgis manual gratuito
Argis manual gratuito
 
Concepts and Methods of Embedding Statistical Data into Maps
Concepts and Methods of Embedding Statistical Data into Maps Concepts and Methods of Embedding Statistical Data into Maps
Concepts and Methods of Embedding Statistical Data into Maps
 
Concepts and Methods of Embedding Statistical Data into Maps
Concepts and Methods of Embedding Statistical Data into MapsConcepts and Methods of Embedding Statistical Data into Maps
Concepts and Methods of Embedding Statistical Data into Maps
 
GeoNuggets s1_georeg_basics_j_eleson 2019
GeoNuggets s1_georeg_basics_j_eleson 2019GeoNuggets s1_georeg_basics_j_eleson 2019
GeoNuggets s1_georeg_basics_j_eleson 2019
 
2017 PLSC Track: Using a Standard Version of ArcMap with External VRS Recieve...
2017 PLSC Track: Using a Standard Version of ArcMap with External VRS Recieve...2017 PLSC Track: Using a Standard Version of ArcMap with External VRS Recieve...
2017 PLSC Track: Using a Standard Version of ArcMap with External VRS Recieve...
 
Ex32018.pdf
Ex32018.pdfEx32018.pdf
Ex32018.pdf
 
Geospatial Product Watch 2015
Geospatial Product Watch 2015Geospatial Product Watch 2015
Geospatial Product Watch 2015
 
Plugins in QGIS and its uses
Plugins in QGIS and its usesPlugins in QGIS and its uses
Plugins in QGIS and its uses
 
Abdul Hameed CV
Abdul Hameed CVAbdul Hameed CV
Abdul Hameed CV
 
HERE Maps for the Nokia X platform
HERE Maps for the Nokia X platformHERE Maps for the Nokia X platform
HERE Maps for the Nokia X platform
 
ArcGIS_Collector_Field_Guide_201411204_
ArcGIS_Collector_Field_Guide_201411204_ArcGIS_Collector_Field_Guide_201411204_
ArcGIS_Collector_Field_Guide_201411204_
 
Geographic Information Systems Based Quantity Takeoffs in Buildings Construction
Geographic Information Systems Based Quantity Takeoffs in Buildings ConstructionGeographic Information Systems Based Quantity Takeoffs in Buildings Construction
Geographic Information Systems Based Quantity Takeoffs in Buildings Construction
 
Geoscience For Gis A
Geoscience For Gis AGeoscience For Gis A
Geoscience For Gis A
 
PORTFOLIO
PORTFOLIOPORTFOLIO
PORTFOLIO
 

Último

In vitro evaluation of antibacterial activity of chloroform extract Andrograp...
In vitro evaluation of antibacterial activity of chloroform extract Andrograp...In vitro evaluation of antibacterial activity of chloroform extract Andrograp...
In vitro evaluation of antibacterial activity of chloroform extract Andrograp...
Open Access Research Paper
 
Climate change Presentation for students who need it
Climate change Presentation for students who need itClimate change Presentation for students who need it
Climate change Presentation for students who need it
maythadar1312
 
ch15.pdf 3 environmet geography ba 3rd year
ch15.pdf 3 environmet geography  ba 3rd yearch15.pdf 3 environmet geography  ba 3rd year
ch15.pdf 3 environmet geography ba 3rd year
AdarshMishra17
 

Último (20)

Data analysis and findings
Data analysis and findingsData analysis and findings
Data analysis and findings
 
Coastal and mangrove vulnerability assessment In the Northern Coast of Java, ...
Coastal and mangrove vulnerability assessment In the Northern Coast of Java, ...Coastal and mangrove vulnerability assessment In the Northern Coast of Java, ...
Coastal and mangrove vulnerability assessment In the Northern Coast of Java, ...
 
WhatsUpp In... Alpine Region concerning Hydrogen Valleys - 16 mai 2024
WhatsUpp In... Alpine Region concerning Hydrogen Valleys - 16 mai 2024WhatsUpp In... Alpine Region concerning Hydrogen Valleys - 16 mai 2024
WhatsUpp In... Alpine Region concerning Hydrogen Valleys - 16 mai 2024
 
In vitro evaluation of antibacterial activity of chloroform extract Andrograp...
In vitro evaluation of antibacterial activity of chloroform extract Andrograp...In vitro evaluation of antibacterial activity of chloroform extract Andrograp...
In vitro evaluation of antibacterial activity of chloroform extract Andrograp...
 
A Wide Range of Eco System Services with Mangroves
A Wide Range of Eco System Services with MangrovesA Wide Range of Eco System Services with Mangroves
A Wide Range of Eco System Services with Mangroves
 
2024-05-16 Composting at Home 101 without link to voucher
2024-05-16 Composting at Home 101 without link to voucher2024-05-16 Composting at Home 101 without link to voucher
2024-05-16 Composting at Home 101 without link to voucher
 
Climate change Presentation for students who need it
Climate change Presentation for students who need itClimate change Presentation for students who need it
Climate change Presentation for students who need it
 
The Key to Sustainable Energy Optimization: A Data-Driven Approach for Manufa...
The Key to Sustainable Energy Optimization: A Data-Driven Approach for Manufa...The Key to Sustainable Energy Optimization: A Data-Driven Approach for Manufa...
The Key to Sustainable Energy Optimization: A Data-Driven Approach for Manufa...
 
Travis Hills of Minnesota: Making Livestock Water and Energy the Best in Buil...
Travis Hills of Minnesota: Making Livestock Water and Energy the Best in Buil...Travis Hills of Minnesota: Making Livestock Water and Energy the Best in Buil...
Travis Hills of Minnesota: Making Livestock Water and Energy the Best in Buil...
 
Introducing Blue Carbon Deck seeking for actionable partnerships
Introducing Blue Carbon Deck seeking for actionable partnershipsIntroducing Blue Carbon Deck seeking for actionable partnerships
Introducing Blue Carbon Deck seeking for actionable partnerships
 
Peat land Restoration Project in HLG Londerang
Peat land Restoration Project in HLG LonderangPeat land Restoration Project in HLG Londerang
Peat land Restoration Project in HLG Londerang
 
Carbon Stock Assessment in Banten Province and Demak, Central Java, Indonesia
Carbon Stock Assessment in Banten Province and Demak, Central Java, IndonesiaCarbon Stock Assessment in Banten Province and Demak, Central Java, Indonesia
Carbon Stock Assessment in Banten Province and Demak, Central Java, Indonesia
 
Lab Investigation.pptxjjjjjjjjjjjjjjjjjj
Lab Investigation.pptxjjjjjjjjjjjjjjjjjjLab Investigation.pptxjjjjjjjjjjjjjjjjjj
Lab Investigation.pptxjjjjjjjjjjjjjjjjjj
 
Learn Creative Upcycling Ideas for Old T-Shirts: Transform Your Wardrobe Now
Learn Creative Upcycling Ideas for Old T-Shirts: Transform Your Wardrobe NowLearn Creative Upcycling Ideas for Old T-Shirts: Transform Your Wardrobe Now
Learn Creative Upcycling Ideas for Old T-Shirts: Transform Your Wardrobe Now
 
New Metrics for Sustainable Prosperity: Options for GDP+3 (preliminary study)
New Metrics for Sustainable Prosperity: Options for GDP+3 (preliminary study)New Metrics for Sustainable Prosperity: Options for GDP+3 (preliminary study)
New Metrics for Sustainable Prosperity: Options for GDP+3 (preliminary study)
 
TEST BANK For Geosystems An Introduction to Physical Geography, 5th Canadian ...
TEST BANK For Geosystems An Introduction to Physical Geography, 5th Canadian ...TEST BANK For Geosystems An Introduction to Physical Geography, 5th Canadian ...
TEST BANK For Geosystems An Introduction to Physical Geography, 5th Canadian ...
 
poplar trees field in kurdistan region of iraq.pptx
poplar trees field in kurdistan region of iraq.pptxpoplar trees field in kurdistan region of iraq.pptx
poplar trees field in kurdistan region of iraq.pptx
 
Laplace Transforms.pptxhhhhhhhhhhhhhhhhh
Laplace Transforms.pptxhhhhhhhhhhhhhhhhhLaplace Transforms.pptxhhhhhhhhhhhhhhhhh
Laplace Transforms.pptxhhhhhhhhhhhhhhhhh
 
ch15.pdf 3 environmet geography ba 3rd year
ch15.pdf 3 environmet geography  ba 3rd yearch15.pdf 3 environmet geography  ba 3rd year
ch15.pdf 3 environmet geography ba 3rd year
 
Impacts of agriculture on the environment.
Impacts of agriculture on the environment.Impacts of agriculture on the environment.
Impacts of agriculture on the environment.
 

Charting the Transformation of the Seabed: A Historical Journey along Tunisia's Eastern Coast, Encompassing Kerkennah and Djerba Islands from 1886 to 2022

  • 1. Mapping of the Kerkennah seabed between 1886 and 2022:
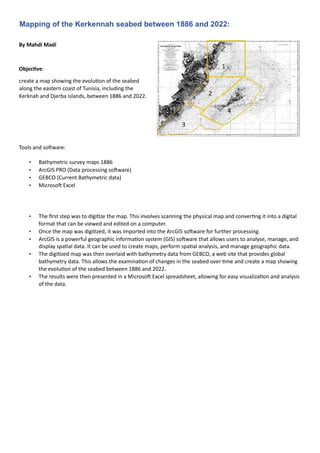
 By Mahdi Madi Objective: create a map showing the evolution of the seabed along the eastern coast of Tunisia, including the Kerknah and Djerba islands, between 1886 and 2022. Tools and software: • Bathymetric survey maps 1886 • ArcGIS PRO (Data processing software) • GEBCO (Current Bathymetric data) • Microsoft Excel • The first step was to digitize the map. This involves scanning the physical map and converting it into a digital format that can be viewed and edited on a computer. • Once the map was digitized, it was imported into the ArcGIS software for further processing. • ArcGIS is a powerful geographic information system (GIS) software that allows users to analyse, manage, and display spatial data. It can be used to create maps, perform spatial analysis, and manage geographic data. • The digitized map was then overlaid with bathymetry data from GEBCO, a web site that provides global bathymetry data. This allows the examination of changes in the seabed over time and create a map showing the evolution of the seabed between 1886 and 2022. • The results were then presented in a Microsoft Excel spreadsheet, allowing for easy visualization and analysis of the data.
  • 2. In ArcGIS Pro, digitizing is the process of creating vector data by tracing over existing features or drawing them manually on a map. Digitizing is a common task in GIS, as it allows users to create accurate, detailed maps and spatial data that can be used for a wide range of applications. To digitize features in ArcGIS Pro, you will need to have a map open and be in an editable layer. You can then use the "Edit" tab in the ribbon to access the digitizing tools. Some common digitizing tools include: • "Add Point": Allows you to create a new point feature by clicking on the map. • "Add Line": Allows you to create a new line feature by clicking on the map to set vertices. • "Add Polygon": Allows you to create a new polygon feature by clicking on the map to set vertices. You can also use the "Sketch" tool to draw freehand lines or polygons on the map. Once you have created a new feature, you can use the "Edit" tab to modify it by adding, deleting, or moving vertices. You can also use the "Attribute Table" to add or edit the attributes of the feature. Digitizing can be a time-consuming process, but it is an important skill to have in GIS as it allows you to create accurate and detailed maps and spatial data. Digitizing: study area 4235 - 1
  • 3. 1866 Radial-Basis-Function: In ArcGIS Pro, a radial basis function (RBF) is a mathematical function that can be used to interpolate scattered data points. RBF interpolation is a method of estimating the value of a function at a given point based on the values of the function at nearby points. RBF interpolation can be useful in many applications, including creating continuous surfaces from discrete data points, smoothing noisy data, and estimating missing data values. To use RBF interpolation in ArcGIS Pro, you will need to have the Spatial Analyst extension installed. With the Spatial Analyst extension, you can use the "RBF Interpolation" tool to create an RBF surface from a set of input data points. The tool allows you to specify the type of RBF function to use, as well as the search radius and other parameters that control the interpolation process. Once the RBF surface has been created, you can use it to perform spatial analysis, create maps, and perform other tasks in ArcGIS Pro. Reversing the depth data (post radial-basis function) (The data need to be reversed to negative values to effectively measure erosion and sedimentation values) Raster functions are applied to a raster dataset or map service in a similar way to how a formula is applied to a cell in a spreadsheet. They take one or more input rasters and apply a set of operations to them, producing an output raster as a result.
  • 4. 2022 GEBCO data: GEBCO (the General Bathymetric Chart of the Oceans) is a global bathymetric chart that provides a comprehensive and publicly available dataset of the Earth's oceans. GEBCO is a collaborative effort between the International Hydrographic Organization (IHO) and the Intergovernmental Oceanographic Commission (IOC) of the United Nations Educational, Scientific, and Cultural Organization (UNESCO). The GEBCO dataset is created using a combination of data sources, including ship-based soundings, satellite altimetry, and digital elevation models. The data is then compiled and quality-controlled to create a consistent and accurate representation of the Earth's ocean floor. The GEBCO dataset is available for free download from the GEBCO website and is widely used by ocean scientists, marine engineers, and others working in the field of oceanography. It is also used in the creation of nautical charts and other products that help people navigate the oceans safely.
  • 5. surface volume 1886 In ArcGIS Pro, the "Surface Volume" tool can be used to calculate the volume of material that has been added to or removed from a surface over a specified period of time. This can be useful for a variety of applications, including measuring the volume of earthmoving projects, calculating the volume of sediment deposited in a river or stream, and estimating the volume of material that has been removed from or added to a site due to erosion or other processes. To use the "Surface Volume" tool in ArcGIS Pro, you will need to have the 3D Analyst extension installed. With the 3D Analyst extension, you can access the "Surface Volume" tool by going to the "3D Analyst" tab and clicking on the "Surface Volume" button. To use the tool, you will need to provide two input surfaces: a "Before" surface representing the initial state of the surface, and an "After" surface representing the final state of the surface. The tool will then calculate the volume of material that has been added or removed between the two surfaces. The results of the calculation can be displayed as a 3D surface or as a table of values. Surface volume 1866 Surface volume 2022
  • 6. Cutfill: In ArcGIS Pro, the "Cut Fill" tool is used to calculate the volume of material that has been added to or removed from a surface. This can be useful for a variety of applications, including estimating the amount of material required for an earthmoving project, calculating the volume of sediment deposited in a river or stream, and estimating the volume of material that has been removed from or added to a site due to erosion or other processes. To use the "Cut Fill" tool in ArcGIS Pro, you will need to have the 3D Analyst extension installed. With the 3D Analyst extension, you can access the "Cut Fill" tool by going to the "3D Analyst" tab and clicking on the "Cut Fill" button. To use the tool, you will need to provide two input surfaces: a "Before" surface representing the initial state of the surface, and an "After" surface representing the final state of the surface. The tool will then calculate the volume of material that has been added or removed between the two surfaces and display the results as a 3D surface or as a table of values. The results can be used to visualize the changes in the surface and to estimate the amount of material required for an earthmoving project. eroded volume sedimented volume erosion speed sedimentation speed area affected by sedimentation Area affected by erosion 1301766989 m3 -7427727898 m3 9571816.096 m3 /year -54615646.31 m3 /year 780010741.9 m² 659441258.1 m²