Grafico diario del dax perfomance index para el 13 06-2012
•
0 recomendaciones•669 vistas


Recomendados
Recomendados
Más contenido relacionado
La actualidad más candente
La actualidad más candente (20)
Destacado
Destacado (20)
Similar a Grafico diario del dax perfomance index para el 13 06-2012
Similar a Grafico diario del dax perfomance index para el 13 06-2012 (20)
Más de Experiencia Trading
Más de Experiencia Trading (20)
Grafico diario del dax perfomance index para el 13 06-2012
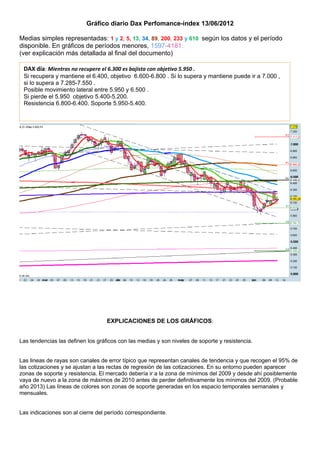
- 1. Gráfico diario Dax Perfomance-index 13/06/2012 Medias simples representadas: 1 y 2, 5, 13, 34, 89, 200, 233 y 610 según los datos y el período disponible. En gráficos de períodos menores, 1597-4181. (ver explicación más detallada al final del documento) DAX día: Mientras no recupere el 6.300 es bajista con objetivo 5.950 . Si recupera y mantiene el 6.400, objetivo 6.600-6.800 . Si lo supera y mantiene puede ir a 7.000 , si lo supera a 7.285-7.550 . Posible movimiento lateral entre 5.950 y 6.500 . Si pierde el 5.950 objetivo 5.400-5.200. Resistencia 6.800-6.400. Soporte 5.950-5.400. EXPLICACIONES DE LOS GRÁFICOS: Las tendencias las definen los gráficos con las medias y son niveles de soporte y resistencia. Las lineas de rayas son canales de error típico que representan canales de tendencia y que recogen el 95% de las cotizaciones y se ajustan a las rectas de regresión de las cotizaciones. En su entorno pueden aparecer zonas de soporte y resistencia. El mercado debería ir a la zona de mínimos del 2009 y desde ahí posiblemente vaya de nuevo a la zona de máximos de 2010 antes de perder definitivamente los mínimos del 2009. (Probable año 2013) Las lineas de colores son zonas de soporte generadas en los espacio temporales semanales y mensuales. Las indicaciones son al cierre del período correspondiente.
- 2. El objeto de estas imágenes es observar como las medias simples pueden orientarnos sobre el comportamiento del mercado. Todo el análisis técnico se basa en poder o intentar intuir el futuro inmediato mediante TECNICAS DE ANÁLISIS de lo sucedido en el pasado. Lo más importante del análisis técnico es suprimir el concepto, EL MERCADO VA A HACER, y sustituirlo por el MERCADO PUEDE HACER y además tener muy presente el principio de CISNE NEGRO. Término acuñado por Nicholas Taber para indicar hechos no predecibles. El desarrollo de los gráficos es muy simple. El gráfico grafía las cotizaciones de una serie de medias simples de la serie de Fibonacci. Las medias simples representadas son: 1 y 2, 5, 13, 34, 89, 200, 233 y 610 como líneas GRUESAS y 1, 3, 8, 21, 55, 144, 377 y 987 como líneas FINAS ,según los datos y el período disponible. Se ha escogido esta serie por su coherencia conceptual y por observar que cumplen bastante bien el mercado al coincidir con los retrocesos de Fibonacci. CONSIDERACIONES • Los espacios temporales usan las mismas medias. • La teoría de Drumond (PLDOT) es de aplicación a cualquier media. • La consideración de tendencia es la siguiente: • Alcista si cierres por arriba de la vela anterior y por encima de la media. o Corto plazo 34 períodos. Color azul o Medio Plazo 89 periodos. Color marrón o Largo plazo 233 periodos. Color rojo o El cruce de las medias nos definen las ondas equivalentes a las de Elliott. .