SlideShare una empresa de Scribd logo
1 de 3
1º) ¿Prefiere el bipartidismo o una sociedad con más partidos políticos
mayoritarios?


                  3% 2%
                                                        Sí

                 12%
                                   26%                  No


                                                        No sé


                                                        Un solo partido
                   57%
                                                        No depende de nosotros


  Esta gráfica representa las respuestas de 102 personas, de las cuales, una clara
mayoría (unas 58 personas) prefiere más de dos partidos políticos mayoritarios. La
segunda opción con más votos (con 27 personas) es la de quedarnos con dos partidos
políticos. El resto de personas no sabe o no quiere responder y unas dos personas
aproximadamente dicen que no depende de nosotros.


2º) ¿Quieren saber como se gastan sus impuestos?


   90
   80                                                        Indiferente
   70
   60                                                        Sería interesante
   50
   40                                                        No quieren saberlo
   30
   20                                                        Nunca se sabrá
   10
    0                                                        Ya lo saben
La gráfica muestra una clara aprobación a la propuesta que enuncia la pregunta; con
88 personas, la opción más votada es la que desea saber dicha información.


3º) ¿Desea erradicar la corrupción política?

   100
                                                                                                                                                                No es importante
    90
    80
    70                                                                                                                                                          Quieren erradicarla
    60
    50                                                                                                                                                          No existe tal
    40                                                                                                                                                          corrupción
    30
                                                                                                                                                                No saben lo que es
    20
    10
     0                                                                                                                                                          No la quieren
                                                                                                                                                                erradicar


  De la gráfica, 94 personas desean erradicar la corrupción política frente a 5 personas
que dicen que no es importante y 2 que dicen que tal corrupción no existe.


4º) ¿Deseas tener voz y voto en las decisiones políticas más importantes?


                                                                                                                                         80
                                                                                                                                         70
                                                                                                                                         60
                                                                                                                                         50
                                                                                                                                         40
                                                                                                                                         30
                                                                                                                                         20
                                                                                                                                         10
                                                                                                                                         0
                                                                                                                                         decisiones politicas
                       Quieren tener voz y voto

                                                  Les da igual

                                                                 No quieren

                                                                              Ya lo tenemos

                                                                                              Depende de qué decisiones

                                                                                                                          Es imposible


  En la gráfica se refleja el deseo de 88 personas de tener voz y voto en las decisiones
que les rodean, frente a 18 que no lo desean y 2 que dicen que es imposible.
                                     Nota informativa
Las personas entrevistadas las cuales tenian entorno a los 20-40 años conocían dicho
tema. En cambio a partir de esa edad los encuestados desonocian el tema

Más contenido relacionado

Destacado

2024 State of Marketing Report – by Hubspot
2024 State of Marketing Report – by Hubspot2024 State of Marketing Report – by Hubspot
2024 State of Marketing Report – by HubspotMarius Sescu
 
Everything You Need To Know About ChatGPT
Everything You Need To Know About ChatGPTEverything You Need To Know About ChatGPT
Everything You Need To Know About ChatGPTExpeed Software
 
Product Design Trends in 2024 | Teenage Engineerings
Product Design Trends in 2024 | Teenage EngineeringsProduct Design Trends in 2024 | Teenage Engineerings
Product Design Trends in 2024 | Teenage EngineeringsPixeldarts
 
How Race, Age and Gender Shape Attitudes Towards Mental Health
How Race, Age and Gender Shape Attitudes Towards Mental HealthHow Race, Age and Gender Shape Attitudes Towards Mental Health
How Race, Age and Gender Shape Attitudes Towards Mental HealthThinkNow
 
AI Trends in Creative Operations 2024 by Artwork Flow.pdf
AI Trends in Creative Operations 2024 by Artwork Flow.pdfAI Trends in Creative Operations 2024 by Artwork Flow.pdf
AI Trends in Creative Operations 2024 by Artwork Flow.pdfmarketingartwork
 
PEPSICO Presentation to CAGNY Conference Feb 2024
PEPSICO Presentation to CAGNY Conference Feb 2024PEPSICO Presentation to CAGNY Conference Feb 2024
PEPSICO Presentation to CAGNY Conference Feb 2024Neil Kimberley
 
Content Methodology: A Best Practices Report (Webinar)
Content Methodology: A Best Practices Report (Webinar)Content Methodology: A Best Practices Report (Webinar)
Content Methodology: A Best Practices Report (Webinar)contently
 
How to Prepare For a Successful Job Search for 2024
How to Prepare For a Successful Job Search for 2024How to Prepare For a Successful Job Search for 2024
How to Prepare For a Successful Job Search for 2024Albert Qian
 
Social Media Marketing Trends 2024 // The Global Indie Insights
Social Media Marketing Trends 2024 // The Global Indie InsightsSocial Media Marketing Trends 2024 // The Global Indie Insights
Social Media Marketing Trends 2024 // The Global Indie InsightsKurio // The Social Media Age(ncy)
 
Trends In Paid Search: Navigating The Digital Landscape In 2024
Trends In Paid Search: Navigating The Digital Landscape In 2024Trends In Paid Search: Navigating The Digital Landscape In 2024
Trends In Paid Search: Navigating The Digital Landscape In 2024Search Engine Journal
 
5 Public speaking tips from TED - Visualized summary
5 Public speaking tips from TED - Visualized summary5 Public speaking tips from TED - Visualized summary
5 Public speaking tips from TED - Visualized summarySpeakerHub
 
ChatGPT and the Future of Work - Clark Boyd
ChatGPT and the Future of Work - Clark Boyd ChatGPT and the Future of Work - Clark Boyd
ChatGPT and the Future of Work - Clark Boyd Clark Boyd
 
Getting into the tech field. what next
Getting into the tech field. what next Getting into the tech field. what next
Getting into the tech field. what next Tessa Mero
 
Google's Just Not That Into You: Understanding Core Updates & Search Intent
Google's Just Not That Into You: Understanding Core Updates & Search IntentGoogle's Just Not That Into You: Understanding Core Updates & Search Intent
Google's Just Not That Into You: Understanding Core Updates & Search IntentLily Ray
 
Time Management & Productivity - Best Practices
Time Management & Productivity -  Best PracticesTime Management & Productivity -  Best Practices
Time Management & Productivity - Best PracticesVit Horky
 
The six step guide to practical project management
The six step guide to practical project managementThe six step guide to practical project management
The six step guide to practical project managementMindGenius
 
Beginners Guide to TikTok for Search - Rachel Pearson - We are Tilt __ Bright...
Beginners Guide to TikTok for Search - Rachel Pearson - We are Tilt __ Bright...Beginners Guide to TikTok for Search - Rachel Pearson - We are Tilt __ Bright...
Beginners Guide to TikTok for Search - Rachel Pearson - We are Tilt __ Bright...RachelPearson36
 

Destacado (20)

2024 State of Marketing Report – by Hubspot
2024 State of Marketing Report – by Hubspot2024 State of Marketing Report – by Hubspot
2024 State of Marketing Report – by Hubspot
 
Everything You Need To Know About ChatGPT
Everything You Need To Know About ChatGPTEverything You Need To Know About ChatGPT
Everything You Need To Know About ChatGPT
 
Product Design Trends in 2024 | Teenage Engineerings
Product Design Trends in 2024 | Teenage EngineeringsProduct Design Trends in 2024 | Teenage Engineerings
Product Design Trends in 2024 | Teenage Engineerings
 
How Race, Age and Gender Shape Attitudes Towards Mental Health
How Race, Age and Gender Shape Attitudes Towards Mental HealthHow Race, Age and Gender Shape Attitudes Towards Mental Health
How Race, Age and Gender Shape Attitudes Towards Mental Health
 
AI Trends in Creative Operations 2024 by Artwork Flow.pdf
AI Trends in Creative Operations 2024 by Artwork Flow.pdfAI Trends in Creative Operations 2024 by Artwork Flow.pdf
AI Trends in Creative Operations 2024 by Artwork Flow.pdf
 
Skeleton Culture Code
Skeleton Culture CodeSkeleton Culture Code
Skeleton Culture Code
 
PEPSICO Presentation to CAGNY Conference Feb 2024
PEPSICO Presentation to CAGNY Conference Feb 2024PEPSICO Presentation to CAGNY Conference Feb 2024
PEPSICO Presentation to CAGNY Conference Feb 2024
 
Content Methodology: A Best Practices Report (Webinar)
Content Methodology: A Best Practices Report (Webinar)Content Methodology: A Best Practices Report (Webinar)
Content Methodology: A Best Practices Report (Webinar)
 
How to Prepare For a Successful Job Search for 2024
How to Prepare For a Successful Job Search for 2024How to Prepare For a Successful Job Search for 2024
How to Prepare For a Successful Job Search for 2024
 
Social Media Marketing Trends 2024 // The Global Indie Insights
Social Media Marketing Trends 2024 // The Global Indie InsightsSocial Media Marketing Trends 2024 // The Global Indie Insights
Social Media Marketing Trends 2024 // The Global Indie Insights
 
Trends In Paid Search: Navigating The Digital Landscape In 2024
Trends In Paid Search: Navigating The Digital Landscape In 2024Trends In Paid Search: Navigating The Digital Landscape In 2024
Trends In Paid Search: Navigating The Digital Landscape In 2024
 
5 Public speaking tips from TED - Visualized summary
5 Public speaking tips from TED - Visualized summary5 Public speaking tips from TED - Visualized summary
5 Public speaking tips from TED - Visualized summary
 
ChatGPT and the Future of Work - Clark Boyd
ChatGPT and the Future of Work - Clark Boyd ChatGPT and the Future of Work - Clark Boyd
ChatGPT and the Future of Work - Clark Boyd
 
Getting into the tech field. what next
Getting into the tech field. what next Getting into the tech field. what next
Getting into the tech field. what next
 
Google's Just Not That Into You: Understanding Core Updates & Search Intent
Google's Just Not That Into You: Understanding Core Updates & Search IntentGoogle's Just Not That Into You: Understanding Core Updates & Search Intent
Google's Just Not That Into You: Understanding Core Updates & Search Intent
 
How to have difficult conversations
How to have difficult conversations How to have difficult conversations
How to have difficult conversations
 
Introduction to Data Science
Introduction to Data ScienceIntroduction to Data Science
Introduction to Data Science
 
Time Management & Productivity - Best Practices
Time Management & Productivity -  Best PracticesTime Management & Productivity -  Best Practices
Time Management & Productivity - Best Practices
 
The six step guide to practical project management
The six step guide to practical project managementThe six step guide to practical project management
The six step guide to practical project management
 
Beginners Guide to TikTok for Search - Rachel Pearson - We are Tilt __ Bright...
Beginners Guide to TikTok for Search - Rachel Pearson - We are Tilt __ Bright...Beginners Guide to TikTok for Search - Rachel Pearson - We are Tilt __ Bright...
Beginners Guide to TikTok for Search - Rachel Pearson - We are Tilt __ Bright...
 

Gráficas proyecto 1

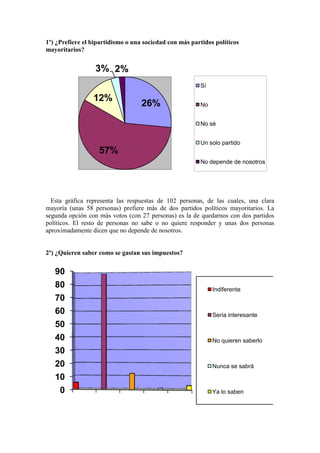
  • 1. 1º) ¿Prefiere el bipartidismo o una sociedad con más partidos políticos mayoritarios? 3% 2% Sí 12% 26% No No sé Un solo partido 57% No depende de nosotros Esta gráfica representa las respuestas de 102 personas, de las cuales, una clara mayoría (unas 58 personas) prefiere más de dos partidos políticos mayoritarios. La segunda opción con más votos (con 27 personas) es la de quedarnos con dos partidos políticos. El resto de personas no sabe o no quiere responder y unas dos personas aproximadamente dicen que no depende de nosotros. 2º) ¿Quieren saber como se gastan sus impuestos? 90 80 Indiferente 70 60 Sería interesante 50 40 No quieren saberlo 30 20 Nunca se sabrá 10 0 Ya lo saben
  • 2. La gráfica muestra una clara aprobación a la propuesta que enuncia la pregunta; con 88 personas, la opción más votada es la que desea saber dicha información. 3º) ¿Desea erradicar la corrupción política? 100 No es importante 90 80 70 Quieren erradicarla 60 50 No existe tal 40 corrupción 30 No saben lo que es 20 10 0 No la quieren erradicar De la gráfica, 94 personas desean erradicar la corrupción política frente a 5 personas que dicen que no es importante y 2 que dicen que tal corrupción no existe. 4º) ¿Deseas tener voz y voto en las decisiones políticas más importantes? 80 70 60 50 40 30 20 10 0 decisiones politicas Quieren tener voz y voto Les da igual No quieren Ya lo tenemos Depende de qué decisiones Es imposible En la gráfica se refleja el deseo de 88 personas de tener voz y voto en las decisiones que les rodean, frente a 18 que no lo desean y 2 que dicen que es imposible. Nota informativa
  • 3. Las personas entrevistadas las cuales tenian entorno a los 20-40 años conocían dicho tema. En cambio a partir de esa edad los encuestados desonocian el tema