SlideShare una empresa de Scribd logo
1 de 9
Trabajo Practico Nº 3 - Gráficos

Un gráfico es la representación gráfica de los datos de una hoja de cálculo y
facilita su interpretación.

Vamos a ver en esta unidad, cómo crear gráficos a partir de unos datos
introducidos en una hoja de cálculo. La utilización de gráficos hace más sencilla e
inmediata la interpretación de los datos. A menudo un gráfico nos dice mucho más que
una serie de datos clasificados por filas y columnas.

Cuando se crea un gráfico en Excel, podemos optar por crearlo:

- Como gráfico incrustado: Insertar el gráfico en una hoja normal como cualquier otro
objeto.

- Como hoja de gráfico: Crear el gráfico en una hoja exclusiva para el gráfico, en las
hojas de gráfico no existen celdas ni ningún otro tipo de objeto.

Crear gráficos

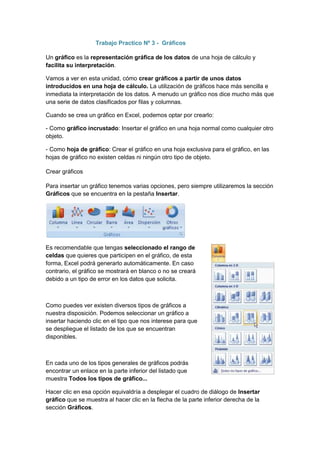
Para insertar un gráfico tenemos varias opciones, pero siempre utilizaremos la sección
Gráficos que se encuentra en la pestaña Insertar.


Es recomendable que tengas seleccionado el rango de
celdas que quieres que participen en el gráfico, de esta
forma, Excel podrá generarlo automáticamente. En caso
contrario, el gráfico se mostrará en blanco o no se creará
debido a un tipo de error en los datos que solicita.


Como puedes ver existen diversos tipos de gráficos a
nuestra disposición. Podemos seleccionar un gráfico a
insertar haciendo clic en el tipo que nos interese para que
se despliegue el listado de los que se encuentran
disponibles.


En cada uno de los tipos generales de gráficos podrás
encontrar un enlace en la parte inferior del listado que
muestra Todos los tipos de gráfico...

Hacer clic en esa opción equivaldría a desplegar el cuadro de diálogo de Insertar
gráfico que se muestra al hacer clic en la flecha de la parte inferior derecha de la
sección Gráficos.
Aquí puedes ver listados todos los gráficos disponibles, selecciona uno y pulsa
Aceptar para empezar a crearlo.

Si seleccionaste un rango de celdas verás tu nuevo gráfico inmediatamente y lo
insertará en la hoja de cálculo con las características predeterminadas del gráfico
escogido. Si has decidido probar suerte y no tenías celdas seleccionadas, deberás
seguir leyendo los siguientes apartados.

Trabajo Practico Nº

Ejercicio Nº1:

   1) crear la siguiente tabla.


   2) seleccionar el rango de celdas comprendidas entre A1:F5
3) En la ficha Insertar, en el grupo Gráficos, haga clic en el iniciador del cuadro
      de diálogo Crear grafico situado junto a Gráficos.


   4) En cuadro de dialogo seleccionar el tipo de grafico Columna y el subtipo
      Columna agrupada. Y luego hacer un clic en Aceptar.


Resultado
5) En la ficha Diseño, en el grupo Diseño de Gráficos, haga clic en el iniciador
   de la ventana desplegable mas situado junto a diseño de Gráficos.


6) Seleccionar el diseño 9
7) resultado


8) en el cuadro de texto Titulo de grafico hacer doble clic y reemplazar el texto
   por el de Elecciones 2007. Y en el cuadro de texto titulo de eje que está
   ubicado a la izquierda reemplazar el texto por el de Votos. Y en el cuadro de
   texto titulo de eje que está ubicado a la en la parte inferior reemplazar el texto
   por el de Provincias.
9) Completar la columna Total de votos, puede utilizar operaciones definidas por
   el usuario o funciones de Excel (función suma ()).


10) resultado


11) seleccionar el rango de celdas A2:A5 y el rango de celdas G2:G5; y construir
    un grafico de tipo circular.
12) seleccionar el rango de celdas A1:G5 y construir el siguiente grafico.

                                 Elecciones 2007


                100000
                 80000
                                                                        Partido Azul
        Votos


                 60000
                 40000                               Partido Verde      Partido Blanco
                                                    Partido Rojo
                 20000                                                  Partido Rojo
                                                   Partido Blanco
                     0                                                  Partido Verde
                                                  Partido Azul


                              Provincias
Elecciones 2007
                  90000
                  80000
                  70000
                  60000
          Votos

                  50000
                  40000
                                                                             Partido Azul
                   30000
                   20000                                                     Partido Blanco
                   10000
                                                                             Partido Rojo
                       0
                                                                             Partido Verde


                                             Provincias


                                        Elecciones 2007
              90000
              80000
              70000
              60000
              50000
      Votos


                                                                             Partido Azul
              40000
                                                                             Partido Blanco
              30000
                                                                             Partido Rojo
              20000
                                                                             Partido Verde
              10000
                    0
                        Provincia1 Provincia Provincia Provincia Provincia
                                      2         3         4         5
                                            Provincias

13) seleccionar el rango de celdas A2:A5 y el rango de celdas G2:G5; y construir
    los siguientes graficos.
Elecciones 2007

                   7%
            10%
                                       Partido Azul
                                       Partido Blanco
                          50%
                                       Partido Rojo
        33%                            Partido Verde


                  Elecciones 2007

                  7%
      10%

                                50%   Partido Azul
                                      Partido Blanco
33%                                   Partido Rojo
                                      Partido Verde

Más contenido relacionado

Destacado

2024 State of Marketing Report – by Hubspot
2024 State of Marketing Report – by Hubspot2024 State of Marketing Report – by Hubspot
2024 State of Marketing Report – by HubspotMarius Sescu
 
Everything You Need To Know About ChatGPT
Everything You Need To Know About ChatGPTEverything You Need To Know About ChatGPT
Everything You Need To Know About ChatGPTExpeed Software
 
Product Design Trends in 2024 | Teenage Engineerings
Product Design Trends in 2024 | Teenage EngineeringsProduct Design Trends in 2024 | Teenage Engineerings
Product Design Trends in 2024 | Teenage EngineeringsPixeldarts
 
How Race, Age and Gender Shape Attitudes Towards Mental Health
How Race, Age and Gender Shape Attitudes Towards Mental HealthHow Race, Age and Gender Shape Attitudes Towards Mental Health
How Race, Age and Gender Shape Attitudes Towards Mental HealthThinkNow
 
AI Trends in Creative Operations 2024 by Artwork Flow.pdf
AI Trends in Creative Operations 2024 by Artwork Flow.pdfAI Trends in Creative Operations 2024 by Artwork Flow.pdf
AI Trends in Creative Operations 2024 by Artwork Flow.pdfmarketingartwork
 
PEPSICO Presentation to CAGNY Conference Feb 2024
PEPSICO Presentation to CAGNY Conference Feb 2024PEPSICO Presentation to CAGNY Conference Feb 2024
PEPSICO Presentation to CAGNY Conference Feb 2024Neil Kimberley
 
Content Methodology: A Best Practices Report (Webinar)
Content Methodology: A Best Practices Report (Webinar)Content Methodology: A Best Practices Report (Webinar)
Content Methodology: A Best Practices Report (Webinar)contently
 
How to Prepare For a Successful Job Search for 2024
How to Prepare For a Successful Job Search for 2024How to Prepare For a Successful Job Search for 2024
How to Prepare For a Successful Job Search for 2024Albert Qian
 
Social Media Marketing Trends 2024 // The Global Indie Insights
Social Media Marketing Trends 2024 // The Global Indie InsightsSocial Media Marketing Trends 2024 // The Global Indie Insights
Social Media Marketing Trends 2024 // The Global Indie InsightsKurio // The Social Media Age(ncy)
 
Trends In Paid Search: Navigating The Digital Landscape In 2024
Trends In Paid Search: Navigating The Digital Landscape In 2024Trends In Paid Search: Navigating The Digital Landscape In 2024
Trends In Paid Search: Navigating The Digital Landscape In 2024Search Engine Journal
 
5 Public speaking tips from TED - Visualized summary
5 Public speaking tips from TED - Visualized summary5 Public speaking tips from TED - Visualized summary
5 Public speaking tips from TED - Visualized summarySpeakerHub
 
ChatGPT and the Future of Work - Clark Boyd
ChatGPT and the Future of Work - Clark Boyd ChatGPT and the Future of Work - Clark Boyd
ChatGPT and the Future of Work - Clark Boyd Clark Boyd
 
Getting into the tech field. what next
Getting into the tech field. what next Getting into the tech field. what next
Getting into the tech field. what next Tessa Mero
 
Google's Just Not That Into You: Understanding Core Updates & Search Intent
Google's Just Not That Into You: Understanding Core Updates & Search IntentGoogle's Just Not That Into You: Understanding Core Updates & Search Intent
Google's Just Not That Into You: Understanding Core Updates & Search IntentLily Ray
 
Time Management & Productivity - Best Practices
Time Management & Productivity -  Best PracticesTime Management & Productivity -  Best Practices
Time Management & Productivity - Best PracticesVit Horky
 
The six step guide to practical project management
The six step guide to practical project managementThe six step guide to practical project management
The six step guide to practical project managementMindGenius
 
Beginners Guide to TikTok for Search - Rachel Pearson - We are Tilt __ Bright...
Beginners Guide to TikTok for Search - Rachel Pearson - We are Tilt __ Bright...Beginners Guide to TikTok for Search - Rachel Pearson - We are Tilt __ Bright...
Beginners Guide to TikTok for Search - Rachel Pearson - We are Tilt __ Bright...RachelPearson36
 

Destacado (20)

2024 State of Marketing Report – by Hubspot
2024 State of Marketing Report – by Hubspot2024 State of Marketing Report – by Hubspot
2024 State of Marketing Report – by Hubspot
 
Everything You Need To Know About ChatGPT
Everything You Need To Know About ChatGPTEverything You Need To Know About ChatGPT
Everything You Need To Know About ChatGPT
 
Product Design Trends in 2024 | Teenage Engineerings
Product Design Trends in 2024 | Teenage EngineeringsProduct Design Trends in 2024 | Teenage Engineerings
Product Design Trends in 2024 | Teenage Engineerings
 
How Race, Age and Gender Shape Attitudes Towards Mental Health
How Race, Age and Gender Shape Attitudes Towards Mental HealthHow Race, Age and Gender Shape Attitudes Towards Mental Health
How Race, Age and Gender Shape Attitudes Towards Mental Health
 
AI Trends in Creative Operations 2024 by Artwork Flow.pdf
AI Trends in Creative Operations 2024 by Artwork Flow.pdfAI Trends in Creative Operations 2024 by Artwork Flow.pdf
AI Trends in Creative Operations 2024 by Artwork Flow.pdf
 
Skeleton Culture Code
Skeleton Culture CodeSkeleton Culture Code
Skeleton Culture Code
 
PEPSICO Presentation to CAGNY Conference Feb 2024
PEPSICO Presentation to CAGNY Conference Feb 2024PEPSICO Presentation to CAGNY Conference Feb 2024
PEPSICO Presentation to CAGNY Conference Feb 2024
 
Content Methodology: A Best Practices Report (Webinar)
Content Methodology: A Best Practices Report (Webinar)Content Methodology: A Best Practices Report (Webinar)
Content Methodology: A Best Practices Report (Webinar)
 
How to Prepare For a Successful Job Search for 2024
How to Prepare For a Successful Job Search for 2024How to Prepare For a Successful Job Search for 2024
How to Prepare For a Successful Job Search for 2024
 
Social Media Marketing Trends 2024 // The Global Indie Insights
Social Media Marketing Trends 2024 // The Global Indie InsightsSocial Media Marketing Trends 2024 // The Global Indie Insights
Social Media Marketing Trends 2024 // The Global Indie Insights
 
Trends In Paid Search: Navigating The Digital Landscape In 2024
Trends In Paid Search: Navigating The Digital Landscape In 2024Trends In Paid Search: Navigating The Digital Landscape In 2024
Trends In Paid Search: Navigating The Digital Landscape In 2024
 
5 Public speaking tips from TED - Visualized summary
5 Public speaking tips from TED - Visualized summary5 Public speaking tips from TED - Visualized summary
5 Public speaking tips from TED - Visualized summary
 
ChatGPT and the Future of Work - Clark Boyd
ChatGPT and the Future of Work - Clark Boyd ChatGPT and the Future of Work - Clark Boyd
ChatGPT and the Future of Work - Clark Boyd
 
Getting into the tech field. what next
Getting into the tech field. what next Getting into the tech field. what next
Getting into the tech field. what next
 
Google's Just Not That Into You: Understanding Core Updates & Search Intent
Google's Just Not That Into You: Understanding Core Updates & Search IntentGoogle's Just Not That Into You: Understanding Core Updates & Search Intent
Google's Just Not That Into You: Understanding Core Updates & Search Intent
 
How to have difficult conversations
How to have difficult conversations How to have difficult conversations
How to have difficult conversations
 
Introduction to Data Science
Introduction to Data ScienceIntroduction to Data Science
Introduction to Data Science
 
Time Management & Productivity - Best Practices
Time Management & Productivity -  Best PracticesTime Management & Productivity -  Best Practices
Time Management & Productivity - Best Practices
 
The six step guide to practical project management
The six step guide to practical project managementThe six step guide to practical project management
The six step guide to practical project management
 
Beginners Guide to TikTok for Search - Rachel Pearson - We are Tilt __ Bright...
Beginners Guide to TikTok for Search - Rachel Pearson - We are Tilt __ Bright...Beginners Guide to TikTok for Search - Rachel Pearson - We are Tilt __ Bright...
Beginners Guide to TikTok for Search - Rachel Pearson - We are Tilt __ Bright...
 

Trabajo Práctico Nº3 - Grafico

  • 1. Trabajo Practico Nº 3 - Gráficos Un gráfico es la representación gráfica de los datos de una hoja de cálculo y facilita su interpretación. Vamos a ver en esta unidad, cómo crear gráficos a partir de unos datos introducidos en una hoja de cálculo. La utilización de gráficos hace más sencilla e inmediata la interpretación de los datos. A menudo un gráfico nos dice mucho más que una serie de datos clasificados por filas y columnas. Cuando se crea un gráfico en Excel, podemos optar por crearlo: - Como gráfico incrustado: Insertar el gráfico en una hoja normal como cualquier otro objeto. - Como hoja de gráfico: Crear el gráfico en una hoja exclusiva para el gráfico, en las hojas de gráfico no existen celdas ni ningún otro tipo de objeto. Crear gráficos Para insertar un gráfico tenemos varias opciones, pero siempre utilizaremos la sección Gráficos que se encuentra en la pestaña Insertar. Es recomendable que tengas seleccionado el rango de celdas que quieres que participen en el gráfico, de esta forma, Excel podrá generarlo automáticamente. En caso contrario, el gráfico se mostrará en blanco o no se creará debido a un tipo de error en los datos que solicita. Como puedes ver existen diversos tipos de gráficos a nuestra disposición. Podemos seleccionar un gráfico a insertar haciendo clic en el tipo que nos interese para que se despliegue el listado de los que se encuentran disponibles. En cada uno de los tipos generales de gráficos podrás encontrar un enlace en la parte inferior del listado que muestra Todos los tipos de gráfico... Hacer clic en esa opción equivaldría a desplegar el cuadro de diálogo de Insertar gráfico que se muestra al hacer clic en la flecha de la parte inferior derecha de la sección Gráficos.
  • 2. Aquí puedes ver listados todos los gráficos disponibles, selecciona uno y pulsa Aceptar para empezar a crearlo. Si seleccionaste un rango de celdas verás tu nuevo gráfico inmediatamente y lo insertará en la hoja de cálculo con las características predeterminadas del gráfico escogido. Si has decidido probar suerte y no tenías celdas seleccionadas, deberás seguir leyendo los siguientes apartados. Trabajo Practico Nº Ejercicio Nº1: 1) crear la siguiente tabla. 2) seleccionar el rango de celdas comprendidas entre A1:F5
  • 3. 3) En la ficha Insertar, en el grupo Gráficos, haga clic en el iniciador del cuadro de diálogo Crear grafico situado junto a Gráficos. 4) En cuadro de dialogo seleccionar el tipo de grafico Columna y el subtipo Columna agrupada. Y luego hacer un clic en Aceptar. Resultado
  • 4. 5) En la ficha Diseño, en el grupo Diseño de Gráficos, haga clic en el iniciador de la ventana desplegable mas situado junto a diseño de Gráficos. 6) Seleccionar el diseño 9
  • 5. 7) resultado 8) en el cuadro de texto Titulo de grafico hacer doble clic y reemplazar el texto por el de Elecciones 2007. Y en el cuadro de texto titulo de eje que está ubicado a la izquierda reemplazar el texto por el de Votos. Y en el cuadro de texto titulo de eje que está ubicado a la en la parte inferior reemplazar el texto por el de Provincias.
  • 6. 9) Completar la columna Total de votos, puede utilizar operaciones definidas por el usuario o funciones de Excel (función suma ()). 10) resultado 11) seleccionar el rango de celdas A2:A5 y el rango de celdas G2:G5; y construir un grafico de tipo circular.
  • 7. 12) seleccionar el rango de celdas A1:G5 y construir el siguiente grafico. Elecciones 2007 100000 80000 Partido Azul Votos 60000 40000 Partido Verde Partido Blanco Partido Rojo 20000 Partido Rojo Partido Blanco 0 Partido Verde Partido Azul Provincias
  • 8. Elecciones 2007 90000 80000 70000 60000 Votos 50000 40000 Partido Azul 30000 20000 Partido Blanco 10000 Partido Rojo 0 Partido Verde Provincias Elecciones 2007 90000 80000 70000 60000 50000 Votos Partido Azul 40000 Partido Blanco 30000 Partido Rojo 20000 Partido Verde 10000 0 Provincia1 Provincia Provincia Provincia Provincia 2 3 4 5 Provincias 13) seleccionar el rango de celdas A2:A5 y el rango de celdas G2:G5; y construir los siguientes graficos.
  • 9. Elecciones 2007 7% 10% Partido Azul Partido Blanco 50% Partido Rojo 33% Partido Verde Elecciones 2007 7% 10% 50% Partido Azul Partido Blanco 33% Partido Rojo Partido Verde