
Recomendados
Más contenido relacionado
Último
Último (20)
Destacado
Destacado (20)
Histogram
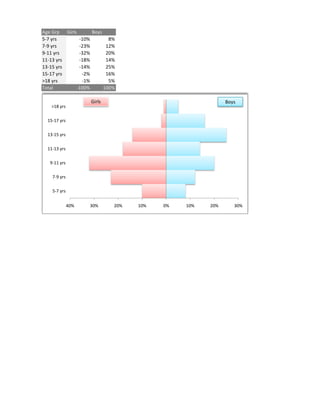
- 1. Age Grp Girls Boys 5-7 yrs -10% 8% 7-9 yrs -23% 12% 9-11 yrs -32% 20% 11-13 yrs -18% 14% 13-15 yrs -14% 25% 15-17 yrs -2% 16% >18 yrs -1% 5% Total -100% 100% Girls Boys >18 yrs 15-17 yrs 13-15 yrs 11-13 yrs 9-11 yrs 7-9 yrs 5-7 yrs 40% 30% 20% 10% 0% 10% 20% 30%