Media in the modern age - Identifying KPIs for the media industry

We recently launched the Services Benchmarking Study, designed to help brand owners understand how their organisations rate across a variety of metrics; including overall customer satisfaction, NPS and Customer Effort. Our study also focused on benchmarking the media industry, providing an overview of satisfaction across TV/film subscriptions, mobile, broadband/internet and home telephone. When it comes to customer satisfaction the UK’s media services providers face a real challenge. More than half of media service consumers have contacted their provider within the past year; higher than other service providers and media consumers are far more affected by poor customer experience and having a service that didn’t meet their needs than other service providers. Download our infographic “Media in the modern age!” which provides an overview of findings across the media industry: • Breakdown of KPI metrics across media providers • Length of time with current providers • The role of switching and ditching – just how common is it? • Key reasons for cancelling accounts • Areas of poor customer experience that cause customers to cancel The Services Benchmarking Study has compared providers’ big and small, detailing in-depth information of how your company has performed against the competition. If you’d like to know more about our Services Benchmarking Study and find out how your business compares please call or email Craig Strudley +44 (0)1865 336 400 or craig.strudley@spafuturethinking.com
Recomendados

Recomendados
Más contenido relacionado
Más de Future Thinking
Más de Future Thinking (12)
Último
Último (20)
Media in the modern age - Identifying KPIs for the media industry
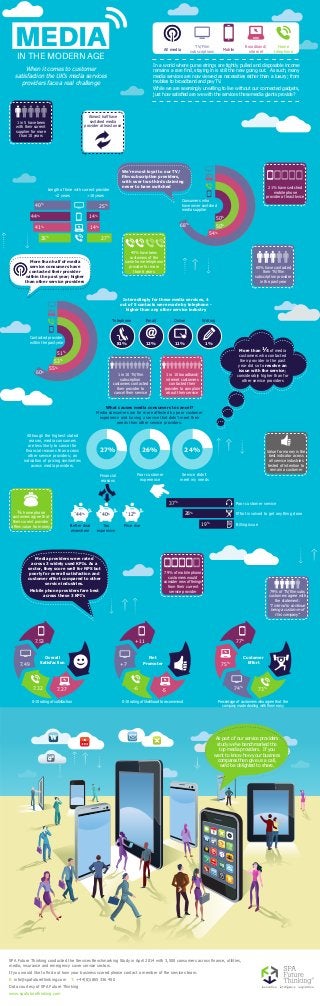
- 1. SPA Future Thinking conducted the Services Benchmarking Study in April 2014 with 3,500 consumers across finance, utilities, media, insurance and emergency cover service sectors. If you would like to find out how your business scored please contact a member of the services team. E: info@spafuturethinking.com T: +44(0)1865 336 400 Data courtesy of SPA Future Thinking www.spafuturethinking.com innovation intelligence inspiration More than ¼ of media customers who contacted their provider in the past year did so to resolve an issue with the service; considerably higher than for other service providers MEDIA IN THE MODERN AGE When it comes to customer satisfaction the UK’s media services providers face a real challenge In a world where purse strings are tightly pulled and disposable income remains a rare find, staying in is still the new going out. As such, many media services are now viewed as necessities rather than a luxury; from mobiles to broadband and pay TV. While we are seemingly unwilling to live without our connected gadgets, just how satisfied are we with the services these media giants provide? All media TV/Film subscriptions Mobile Broadband/ internet Home telephone We’re most loyal to our TV/ film subscription providers, with over two thirds claiming never to have switched Length of time with current provider <2 years >10 years 41% 14% 40% 44% 14% 35% 27% 25% 45% have been customers of the same home telephone provider for more than 6 years 21% have switched mobile phone provider at least twice 60% have contacted their TV/film subscription provider in the past year 60% 55% 53% 51% Contacted provider within the past year Consumers who have never switched media supplier 68% 54% 50% 50% Value for money is the best indicator across all service industries tested of intention to remain a customer Online 11% Writing 1% Telephone 81% Email 12% Interestingly for these media services, 4 out of 5 contacts were made by telephone - higher than any other service industry 1 in 10 TV/film subscription customers contacted their provider to cancel their service Service didn’t meet my needs Financial reasons Poor customer experience 27% 26% 24% What causes media consumers to cancel? Media consumers are far more affected by poor customer experience and having a service that didn’t meet their needs than other service providers. Although the highest stated reason, media consumers are less likely to cancel for financial reasons than across other service providers; an indication of pricing similarities across media providers. 44% 40% 12% Better deal elsewhere Too expensive Price rise Poor customer service Effort involved to get anything done Billing issue £ 37% 28% 19% Percentage of customers who agree that the company made dealing with them easy 77% 75% 74% 73% Customer Effort 0-10 rating of satisfaction 7.53 7.49 7.32 7.27 Overall Satisfaction 0-10 rating of likelihood to recommend +11 +7 -6 -5 Net Promoter Media providers were rated across 3 widely used KPIs. As a sector, they score well for NPS but poorly for overall satisfaction and customer effort compared to other service industries. Mobile phone providers fare best across these 3 KPI’s 79% of TV/film subs customers agree with the statement: “I intend to continue being a customer of this company” ¾ home phone customers agree that their current provider offers value for money 79% of mobile phone customers would consider new offerings from their current service provider As part of our service providers study we’ve benchmarked the top media providers. If you want to know how your business compares then give us a call, we’d be delighted to share. More than half of media service consumers have contacted their provider within the past year; higher than other service providers 1 in 5 have been with their current supplier for more than 10 years Almost half have switched media provider at least once 1 in 10 broadband/ internet customers contacted their provider to complain about their service