

Recomendados
Más contenido relacionado
Destacado
Destacado (16)
Más de International advisers
Más de International advisers (20)
Último
Último (20)
Review sheet
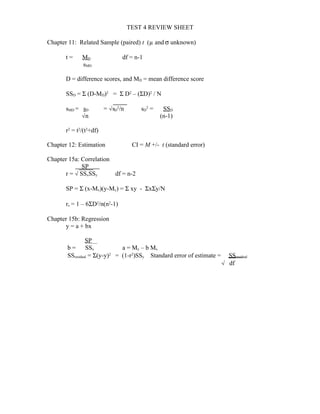
- 1. TEST 4 REVIEW SHEET Chapter 11: Related Sample (paired) t (µ and σ unknown) t = MD df = n-1 sMD D = difference scores, and MD = mean difference score SSD = Σ (D-MD)2 = Σ D2 – (ΣD)2 / N sMD = sD = s√ D 2 /n sD 2 = SSD n√ (n-1) r2 = t2 /(t2 +df) Chapter 12: Estimation CI = M +/- t (standard error) Chapter 15a: Correlation SP . r = SS√ xSSy df = n-2 SP = Σ (x-Mx)(y-My) = Σ xy - ΣxΣy/N rs = 1 – 6ΣD2 /n(n2 -1) Chapter 15b: Regression y = a + bx SP b = SSx a = My – b Mx SSresidual = Σ(y-y)2 = (1-r2 )SSy Standard error of estimate = SSresidual df√
- 2. SPSS: Suicide rates in 95 counties in TN as a function of rurality, percent of population over 45, and medium family income. Correlations suicide rurality over45 medincom suicide Pearson Correlation 1.000 .119 .285** -.249* Sig. (2-tailed) .251 .005 .015 N 95.000 95 95 95 rurality Pearson Correlation .119 1.000 .429** -.611** Sig. (2-tailed) .251 .000 .000 N 95 95.000 95 95 over45 Pearson Correlation .285** .429** 1.000 -.406** Sig. (2-tailed) .005 .000 .000 N 95 95 95.000 95 medincom Pearson Correlation -.249* -.611** -.406** 1.000 Sig. (2-tailed) .015 .000 .000 N 95 95 95 95.000 **. Correlation is significant at the 0.01 level (2-tailed). *. Correlation is significant at the 0.05 level (2-tailed).