Interactive dashboard
•Descargar como PPT, PDF•
2 recomendaciones•246 vistas

A Dashboard is a “Live Snapshot” of a business often displayed on a webpage which is linked to a database that allows reports to be constantly updated, The power of interactive dashboard Enables visual interpretation of customized data and analytics, Enables interaction with many datasets for analysis.

Recomendados
Más contenido relacionado
Similar a Interactive dashboard
Similar a Interactive dashboard (20)
Más de Sushmita Dutt
Más de Sushmita Dutt (14)
Último
Último (20)
Interactive dashboard
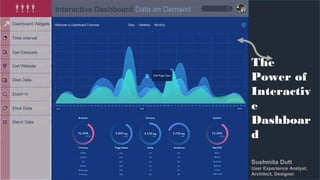
- 1. The Power of Interactiv e Dashboar d Sushmita Dutt User Experience Analyst, Architect, Designer
- 2. The Power of Interactiv e Dashboar d Sushmita Dutt User Experience Analyst, Architect, Designer A Dashboard is a “Live Snapshot” of a business often displayed on a webpage which is linked to a database that allows reports to be constantly updated
- 3. The Power of Interactiv e Dashboar d Sushmita Dutt User Experience Analyst, Architect, Designer Delivers Ease of User Use
- 4. The Power of Interactiv e Dashboar d Sushmita Dutt User Experience Analyst, Architect, Designer Visually presents Data on Demand
- 5. The Power of Interactiv e Dashboar d Sushmita Dutt User Experience Analyst, Architect, Designer Enables visual interpretation of customized data and analytics
- 6. The Power of Interactiv e Dashboar d Sushmita Dutt User Experience Analyst, Architect, Designer Enables interaction with many datasets for analysis
- 7. The Power of Interactiv e Dashboar d Sushmita Dutt User Experience Analyst, Architect, Designer Enables interaction with web resources
- 8. The Power of Interactiv e Dashboar d Sushmita Dutt User Experience Analyst, Architect, Designer Provides “Click-to-filter” option to dice, zoom in, slice and blend data to visually present information
- 9. The Power of Interactiv e Dashboar d Sushmita Dutt User Experience Analyst, Architect, Designer With click on a dataset , information can be hidden or shown
- 10. The Power of Interactiv e Dashboar d Sushmita Dutt User Experience Analyst, Architect, Designer Displays real time, factual data presented visually for quick evaluation
- 11. The Power of Interactiv e Dashboar d Sushmita Dutt User Experience Analyst, Architect, Designer Enables users slice and dice data to get deeper into levels of information
- 12. The Power of Interactiv e Dashboar d Sushmita Dutt User Experience Analyst, Architect, Designer Engages users with data insight and delivers an intuitive experience
- 13. The Power of Interactiv e Dashboar d Sushmita Dutt User Experience Analyst, Architect, Designer Enables “Chart Zoom” to enlarge chart
- 14. The Power of Interactiv e Dashboar d Sushmita Dutt User Experience Analyst, Architect, Designer Case: Citi Trade Finance
- 15. The Power of Interactiv e Dashboar d Sushmita Dutt User Experience Analyst, Architect, Designer Trade Finance: Business Scenarios • Citi's Commodity Trade Finance offers clients solutions covering the whole commodities supply chain, from the producers through commodity traders and trade processors. • Strengthening relationships with Global Trade clients, Citi introduces Trade Finance Analytics dashboard which enhances functionality so clients can view real time trade transaction data while taking advantage of the analytics reporting tools. • Visualizing and distributing critical business insights in shareable dashboards. Going instantly from data to client-ready information, charts and graphs with analysis and reports.
- 16. The Power of Interactiv e Dashboar d Sushmita Dutt User Experience Analyst, Architect, Designer The Power of Interactiv e Dashboar d Sushmita Dutt User Experience Analyst, Architect, Designer Trade Finance: Strengths and Goal • Enhanced working capital solutions that are capital efficient for banks resulting in competitive pricing. Structured facilities and transactional security that extend the available financing beyond traditional lending. • Global network that matches the geographic reach of the commodity industry. Extensive correspondent banking network and corporate coverage model. The advantage of a USD balance sheet. And, leading transactional processing capability. • Goal: Enhanced User Experience delivering consistently Real time Useful Information and analysis.
- 17. The Power of Interactiv e Dashboar d Sushmita Dutt User Experience Analyst, Architect, Designer Business ScenariosTrade Finance: First step to Personalized Service Clients’ data Personalization Trade Finance Sign In helps update user’s prior interactions with the dashboard
- 18. The Power of Interactiv e Dashboar d Sushmita Dutt User Experience Analyst, Architect, Designer Business ScenariosTrade Finance: Dashboard with Personalized Service Personalized Global service
- 19. The Power of Interactiv e Dashboar d Sushmita Dutt User Experience Analyst, Architect, Designer Business ScenariosTrade Finance: Dashboard with Personalized Service Clients’ Assets Personalization
- 20. The Power of Interactiv e Dashboar d Sushmita Dutt User Experience Analyst, Architect, Designer Business ScenariosApple Dashboard Redesigned There are four panels in this dashboard which have been visualized for enhanced user experience:
- 21. The Power of Interactiv e Dashboar d Sushmita Dutt User Experience Analyst, Architect, Designer Business ScenariosApple Dashboard with Customized Service Apple Dashboard Data Visualization needs: Existing Dashboard redesigned for – • Increased legibility • Improved interactions and • Better aesthetics • Apple guidelines followed for the look and feel, Requirement: Stay with flat design. • The design is required to convert all the data to usable graphs/charts/other gauges.
- 22. The Power of Interactiv e Dashboar d Sushmita Dutt User Experience Analyst, Architect, Designer Business ScenariosApple Dashboard with Customized Service
- 23. The Power of Interactiv e Dashboar d Sushmita Dutt User Experience Analyst, Architect, Designer Business ScenariosApple Dashboard with Customized Service
- 24. The Power of Interactiv e Dashboar d Sushmita Dutt User Experience Analyst, Architect, Designer Business ScenariosApple Dashboard with Customized Service
- 25. The Power of Interactiv e Dashboar d Sushmita Dutt User Experience Analyst, Architect, Designer Business ScenariosApple Dashboard with Customized Service
- 26. The Power of Interactiv e Dashboar d Sushmita Dutt User Experience Analyst, Architect, Designer Business ScenariosInteractive Dashboard helplines Turn Your Data Into Actionable Insights Datapine.com https://www.datapine.com/blog/interactive-dashboard- features/ Analysis & Real Time Business Intelligence Reporting Netsoft.com https://www.netsoft.com/products/StyleScope/ Dashboard Comparison https://www.softwareadvice.com/bi/dashboard-comparison/
- 27. The Power of Interactiv e Dashboar d Sushmita Dutt User Experience Analyst, Architect, Designer Key Points: A Dashboard is a “Live Snapshot” of a business often displayed on a webpage which is linked to a database that allows reports to be constantly updated. This technology is growing for easy accessibility, analysis and sharing of information. Contacts: 01-732-771-3318 Sushmita Dutt sushmitadutt@novelebiz.com