Employment and the circular economy infographic
•
1 recomendación•804 vistas

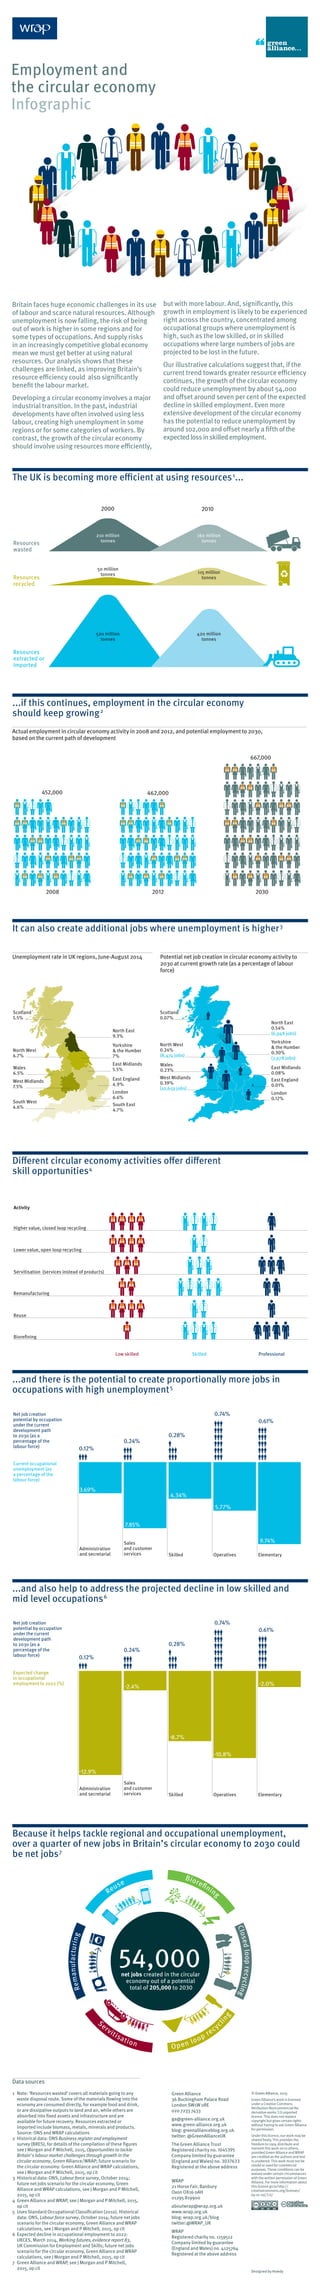
Britain faces challenges in using labour and natural resources efficiently. Developing a circular economy could significantly benefit the labour market by creating over 50,000 new jobs and offsetting the loss of skilled jobs. A more extensive circular economy could reduce unemployment by over 100,000 and offset almost a fifth of expected job losses. Improving resource efficiency through a circular economy has the potential to generate employment across different regions and occupations.
Recomendados

Recomendados
Más contenido relacionado
La actualidad más candente
La actualidad más candente (11)
Similar a Employment and the circular economy infographic
Similar a Employment and the circular economy infographic (20)
Más de Sustainable Brands
Más de Sustainable Brands (20)
Último
Último (14)
Employment and the circular economy infographic
- 1. Britain faces huge economic challenges in its use of labour and scarce natural resources. Although unemployment is now falling, the risk of being out of work is higher in some regions and for some types of occupations. And supply risks in an increasingly competitive global economy mean we must get better at using natural resources. Our analysis shows that these challenges are linked, as improving Britain’s resource efficiency could also significantly benefit the labour market. Developing a circular economy involves a major industrial transition. In the past, industrial developments have often involved using less labour, creating high unemployment in some regions or for some categories of workers. By contrast, the growth of the circular economy should involve using resources more efficiently, but with more labour. And, significantly, this growth in employment is likely to be experienced right across the country, concentrated among occupational groups where unemployment is high, such as the low skilled, or in skilled occupations where large numbers of jobs are projected to be lost in the future. Our illustrative calculations suggest that, if the current trend towards greater resource efficiency continues, the growth of the circular economy could reduce unemployment by about 54,000 and offset around seven per cent of the expected decline in skilled employment. Even more extensive development of the circular economy has the potential to reduce unemployment by around 102,000 and offset nearly a fifth ofthe expectedlossinskilledemployment. The UK is becoming more efficient at using resources1 ... Employment and the circular economy Infographic ...if this continues, employment in the circular economy should keep growing2 It can also create additional jobs where unemployment is higher3 ...and there is the potential to create proportionally more jobs in occupations with high unemployment5 ...and also help to address the projected decline in low skilled and mid level occupations6 Because it helps tackle regional and occupational unemployment, over a quarter of new jobs in Britain’s circular economy to 2030 could be net jobs7 Different circular economy activities offer different skill opportunities4 2000 2010 520 million tonnes 420 million tonnes 50 million tonnes Resources wasted Resources recycled Resources extracted or imported 115 million tonnes 210 million tonnes 160 million tonnes Actual employment in circular economy activity in 2008 and 2012, and potential employment to 2030, based on the current path of development 2008 2012 2030 452,000 462,000 667,000 Unemployment rate in UK regions, June-August 2014 Potential net job creation in circular economy activity to 2030 at current growth rate (as a percentage of labour force) Scotland 5.5% East England 4.9% London 6.6% East Midlands 5.5% Yorkshire & the Humber 7% West Midlands 7.5% Wales 6.5% North West 6.7% North East 9.3% South East 4.7% South West 4.6% Scotland 0.07% West Midlands 0.39% (10,659 jobs) Wales 0.23% North West 0.24% (8,474 jobs) East England 0.01% London 0.12% East Midlands 0.08% Yorkshire & the Humber 0.30% (7,978 jobs) North East 0.54% (6,948 jobs) Current occupational unemployment (as a percentage of the labour force) Expected change in occupational employment to 2022 (%) Net job creation potential by occupation under the current development path to 2030 (as a percentage of the labour force) Net job creation potential by occupation under the current development path to 2030 (as a percentage of the labour force) 3.69% 7.85% 5.77% 9.74% 4.34% 0.12% 0.28% 0.24% 0.74% 0.61% Administration and secretarial Skilled Sales and customer services Operatives Elementary Administration and secretarial Skilled Sales and customer services Operatives Elementary 0.12% 0.28% 0.24% 0.74% 0.61% -12.9% -8.7% -2.4% -10.8% -2.0% Current occupational unemployment (as a percentage of the labour force) Expected change in occupational employment to 2022 (%) Net job creation potential by occupation under the current development path to 2030 (as a percentage of the labour force) Net job creation potential by occupation under the current development path to 2030 (as a percentage of the labour force) 3.69% 7.85% 5.77% 9.74% 4.34% 0.12% 0.28% 0.24% 0.74% 0.61% Administration and secretarial Skilled Sales and customer services Operatives Elementary Administration and secretarial Skilled Sales and customer services Operatives Elementary 0.12% 0.28% 0.24% 0.74% 0.61% -12.9% -8.7% -2.4% -10.8% -2.0% Higher value, closed loop recycling Lower value, open loop recycling Servitisation (services instead of products) Remanufacturing Reuse Activity Biorefining Low skilled Skilled Professional Designed by Howdy 54,000 Servitisation Reuse Open loop recyc ling Remanufacturing Closedlooprecycling Biorefining net jobs created in the circular economy out of a potential total of 205,000 to 2030 © Green Alliance, 2015 Green Alliance’s work is licensed under a Creative Commons Attribution-Noncommercial-No derivative works 3.0 unported licence.This does not replace copyright but gives certain rights without having to ask Green Alliance for permission. Under this licence, our work may be shared freely.This provides the freedom to copy, distribute and transmit this work on to others, provided Green Alliance andWRAP are credited as the authors and text is unaltered.This work must not be resold or used for commercial purposes.These conditions can be waived under certain circumstances with the written permission of Green Alliance. For more information about this licence go to http:// creativecommons.org/licenses/ by-nc-nd/3.0/ Data sources 1 Note: ‘Resources wasted’ covers all materials going to any waste disposal route. Some of the materials flowing into the economy are consumed directly, for example food and drink, or are dissipative outputs to land and air, while others are absorbed into fixed assets and infrastructure and are available for future recovery. Resources extracted or imported include biomass, metals, minerals and products. Source: ONS and WRAP calculations 2 Historical data: ONS Business register and employment survey (BRES), for details of the compilation of these figures see J Morgan and P Mitchell, 2015, Opportunities to tackle Britain’s labour market challenges through growth in the circular economy, Green Alliance/WRAP; future scenario for the circular economy: Green Alliance and WRAP calculations, see J Morgan and P Mitchell, 2015, op cit 3 Historical data: ONS, Labour force survey, October 2014; future net jobs scenario for the circular economy, Green Alliance and WRAP calculations, see J Morgan and P Mitchell, 2015, op cit 4 Green Alliance and WRAP, see J Morgan and P Mitchell, 2015, op cit 5 Uses Standard Occupational Classification (2010). Historical data: ONS, Labour force survey, October 2014; future net jobs scenario for the circular economy, Green Alliance and WRAP calculations, see J Morgan and P Mitchell, 2015, op cit 6 Expected decline in occupational employment to 2022: UKCES, March 2014, Working futures, evidence report 83, UK Commission for Employment and Skills; future net jobs scenario for the circular economy, Green Alliance and WRAP calculations, see J Morgan and P Mitchell, 2015, op cit 7 Green Alliance and WRAP, see J Morgan and P Mitchell, 2015, op cit Green Alliance 36 Buckingham Palace Road London SW1W 0RE 020 7233 7433 ga@green-alliance.org.uk www.green-alliance.org.uk blog: greenallianceblog.org.uk twitter: @GreenAllianceUK The Green Alliance Trust Registered charity no. 1045395 Company limited by guarantee (England and Wales) no. 3037633 Registered at the above address WRAP 21 Horse Fair, Banbury Oxon OX16 0AH 01295 819900 aboutwrap@wrap.org.uk www.wrap.org.uk blog: wrap.org.uk/blog twitter:@WRAP_UK WRAP Registered charity no. 1159512 Company limited by guarantee (England and Wales) no. 4125764 Registered at the above address