

Recomendados
Más contenido relacionado
Más de Weydert Wealth Management
Más de Weydert Wealth Management (13)
Último
Último (20)
Dfa vector equity 9-30-2013 pdf
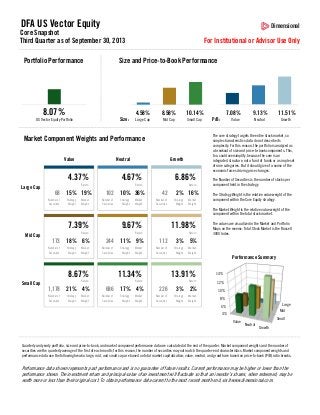
- 1. DFA US Vector Equity Dimensional Core Snapshot Third Quarter as of September 30, 2013 Portfolio Performance For Institutional or Advisor Use Only Size and Price-to-Book Performance 8.07% 4.58% Size: US Vector Equity Portfolio 8.58% 10.14% Large Cap Mid Cap Small Cap Neutral Growth 4.37% 4.67% 6.86% Return Return Return Large Cap 68 15% 19% Number of Securities Strategy Weight Market Weight 102 10% 36% Number of Securities Strategy Weight Market Weight 42 Number of Securities 2% 16% Strategy Weight Value 9.13% 11.51% Neutral Growth The core strategy targets the entire stock market, so simple characteristics data do not describe its complexity. For this reason, the portfolio is analyzed as a breakout of size and price-to-book components. This, too, could oversimplify, because the core is an integrated structure, not a fund of funds or a simple set of nine categories. But it should give of a sense of the economic forces driving price changes. Market Component Weights and Performance Value 7.08% P/B: Market Weight The Number of Securities is the number of stocks per component held in the strategy. The Strategy Weight is the relative value weight of the component within the Core Equity strategy. The Market Weight is the relative value weight of the component within the total stock market. 7.39% 9.67% 11.98% Return Return Return Mid Cap 173 18% 6% Number of Securities Strategy Weight Market Weight 244 11% 9% Number of Securities Strategy Weight Market Weight 112 Number of Securities The values are visualized in the Market and Portfolio Maps on the reverse. Total Stock Market is the Russell 3000 Index. 3% 5% Strategy Weight Market Weight Performance Summary 8.67% 11.34% 13.91% 14% Return Return Return 12% Small Cap 1,178 21% 4% Number of Securities Strategy Weight Market Weight 686 17% 4% Number of Securities Strategy Weight Market Weight 226 Number of Securities 3% 2% Strategy Weight Market Weight 10% 8% Large 6% Mid 4% Value Small Neutral Growth Quarterly and yearly portfolio, size and price-to-book, and market component performance data are calculated at the end of the quarter. Market component weights and the number of securities are the quarterly average of the first of each month; for this reason, the number of securities may not match the quarter-end characteristics. Market component weights and performance data use the following breaks: large, mid, and small cap are based on total market capitalization; value, neutral, and growth are based on price-to-book (P/B) ratio breaks. Performance data shown represents past performance and is no guarantee of future results. Current performance may be higher or lower than the performance shown. The investment return and principal value of an investment will fluctuate so that an investor’s shares, when redeemed, may be worth more or less than their original cost. To obtain performance data current to the most recent month end, visit www.dimensional.com.
- 2. DFA US Vector Equity Dimensional Core Snapshot Third Quarter as of September 30, 2013 For Institutional or Advisor Use Only Market and Portfolio Maps US Total Stock Market US Vector Equity Portfolio The market is dominated by large cap and growth stocks. The Portfolio Maps provide a quick comparison of exposures across the market. Core target weights increase small cap and value stock exposures. Total Stock Market is the Russell 3000 Index. Market Weight 16% Market Weight 16% Value 0% Large Neutral Mid Value 0% Large Neutral Mid Small Growth Small Growth Portfolio Characteristics Average Annual Total Returns 2,824 Number of Holdings: Weighted Average Market Cap (millions): $28,863 Aggregate Price-to-Book Ratio (ex negatives): 1.54 15.9 Price/Earnings Ratio (ex negatives): 1.42% Weighted Average Dividend-to-Price Ratio: 0.32% Net Expense Ratio (to investor): As of September 30, 2013 One Year 30.78 Five Years 11.35 Ten Years N/A Since Inception (December 30, 2005) 7.03 Returns for periods less than one year are not annualized. Fund holdings are subject to change. Performance data shown represents past performance and is no guarantee of future results. Current performance may be higher or lower than the performance shown. The investment return and principal value of an investment will fluctuate so that an investor's shares, when redeemed, may be worth more or less than their original cost. To obtain performance data current to the most recent month end, visit www.dimensional.com. Small company stocks may fluctuate more in price than those of large companies. Russell data copyright © Russell Investment Group 1995-2013, all rights reserved. The material in this publication is provided solely as background information for registered investment advisors and institutional investors and is not intended for public use. Dimensional Fund Advisors LP is an investment advisor registered with the Securities and Exchange Commission. Consider the investment objectives, risks, and charges and expenses of the Dimensional funds carefully before investing. For this and other information about the Dimensional funds, please read the prospectus carefully before investing. Prospectuses are available by calling Dimensional Fund Advisors collect at (310) 395-8005 or at www.dimensional.com.