Solving polynomial inequalities by graphing
•
1 recomendación•1,028 vistas

Solving polynomial inequalities by graphing

Recomendados
Recomendados
Más contenido relacionado
La actualidad más candente
La actualidad más candente (20)
Destacado
Destacado (15)
Similar a Solving polynomial inequalities by graphing
Similar a Solving polynomial inequalities by graphing (20)
Más de Tarun Gehlot
Más de Tarun Gehlot (17)
Último
Último (20)
Solving polynomial inequalities by graphing
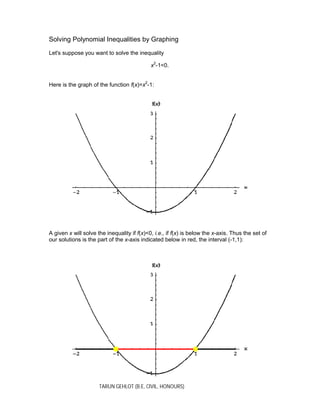
- 1. TARUN GEHLOT (B.E, CIVIL, HONOURS) Solving Polynomial Inequalities by Graphing Let's suppose you want to solve the inequality x2 -1<0. Here is the graph of the function f(x)=x2 -1: A given x will solve the inequality if f(x)<0, i.e., if f(x) is below the x-axis. Thus the set of our solutions is the part of the x-axis indicated below in red, the interval (-1,1):
- 2. TARUN GEHLOT (B.E, CIVIL, HONOURS) If we want to see the solutions of the inequality x2 -1>0, that's just as easy. Now we have to pick all values of x for which f(x)=x2 -1 is above the x- axis. As you can see, we obtain as solutions the set , indicated below in blue. Note the pivotal role played by the "yellow dots", the x-intercepts of f(x). f(x) can only change its sign by passing through an x-intercept, i.e., a solution of f(x)=0 will always separate parts of the graph of f(x) above the x-axis from parts below the x- axis. This property of polynomials is called theIntermediate Value Property of polynomials; your teacher might also refer to this property as continuity. Let us consider another example: Solve the inequality Here is the graph of the function f(x)=x4 +x3 -2x2 -2x>0:
- 3. TARUN GEHLOT (B.E, CIVIL, HONOURS) A given x will solve the inequality if , i.e., if f(x) is above the x-axis. Thus the set of our solutions is the part of the x-axis indicated below in blue, the union of the following three intervals:
- 4. TARUN GEHLOT (B.E, CIVIL, HONOURS) The (finite) endpoints are included since at these points f(x)=0 and so these x's are included in our quest of finding the solutions of . Our answer is approximate, the endpoints of the intervals were found by inspection; you can usually obtain better estimates for the endpoints by using a numerical solver to find the solutions of f(x)=0. In fact, as you will learn in the next section, the precise endpoints of the intervals are , -1, 0 and . Two more caveats: The method will only work, if your graphing window contains all x- intercepts. Here is a rather simple-minded example to illustrate the point: Suppose you want to solve the inequality x2 -10x<0. If your graphing window is set to the interval [-5,5], you will miss half of the action, and probably come up with the incorrect answer: To find the correct answer, the interval (0,10), your graphing window has to include the second x-intercept at x=10:
- 5. TARUN GEHLOT (B.E, CIVIL, HONOURS) Here is another danger: Consider the three inequalities , and . If you do not zoom in rather drastically, all three graphs look about the same: Only zooming in reveals that the solutions to the three inequalities show a rather different behavior. The first inequality has a single solution, x=0. (This also illustrates the fact that a function f(x) does not always change sign at points where f(x)=0.)
- 6. TARUN GEHLOT (B.E, CIVIL, HONOURS) The second inequality, , has as its solutions the interval [-0.01,0.01]: The third inequality, , has no solutions:
- 7. TARUN GEHLOT (B.E, CIVIL, HONOURS)