HomeRoots Pitch Deck | Investor Insights | April 2024
Amzn tightens up
1. 1
All rights reserv ed, Inflection Capital Management, LLC
The Amazon 2H’18 “Slowdown”
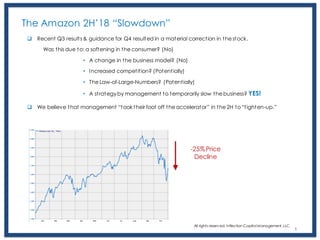
❑ Recent Q3 results & guidance for Q4 resulted in a material correction in the stock.
Was this due to: a softening in the consumer? (No)
• A change in the business model? (No)
• Increased competition? (Potentially)
• The Law-of-Large-Numbers? (Potentially)
• A strategy by management to temporarily slow the business? YES!
❑ We believe that management “took their foot off the accelerator” in the 2H to “tighten-up.”
-25% Price
Decline
2. 2
All rights reserv ed, Inflection Capital Management, LLC
The Amazon 2H’18 “Slowdown”
Why did they take their foot off?
1) Stronger-than-expected demand during 2017 created some less than ideal operational and
customer issues that management wanted buttoned-up.
2) Prime has reached such a high rate of penetration in the US, that management is now
transitioning the business’ growth to “wallet-share” from “new wallets”. Growth from wallet-
share is far more challenging and requires extremely strong execution. Consequently,
management wanted to “tighten-up” its assets and execution.
3) Given Amazon’s high penetration in core markets, Amazon has to now source significant new
areas of consumption such as experience and services. This likely entails a major acquisition.
Given their learnings from the Whole Foods acquisition, management needs to set up the
Amazon organization to more effectively integrate large acquisitions.
-25% Price
Decline
3. LOW HIGH
Q1 '17 Q2 '17 Q3 '17 Q4 '17 Q1 18 Q2 '18 Q3 '18 Q4 '18e
AWS $3,661 $4,100 $4,584 $5,113 $5,442 $6,105 $6,679 $7,414 No basis for assuming a fade
CC growth 42% 42% 44% 48% 49% 46% 45%
International Rev $11,061 $11,485 $13,714 $18,038 $14,875 $14,612 $15,549 $20,744 Assuming lift in India & Germany
CC growth 22% 28% 22% 21% 21% 15% 15% while underlying softens
North America
Subscription Services $1,322 $1,866 $2,073 $2,150 $2,184 $2,856 $3,150 $2,927 Similar QoQ Lift, minus $300m
YoY Growth 65% 53% 52% 36% accounting change
Other $767 $862 $1,011 $1,312 $1,254 $1,392 $1,700 $2,000 Similar QoQ Lift
YoY Growth 63% 61% 68% 52%
Physical Stores $1,276 $4,522 $4,263 $4,312 $4,350 $5,873 Assuming a 35% season lift (typically 40%)
1P & 3P Retail $18,903 $19,642 $21,086 $29,319 $23,023 $23,609 $25,148 $28,027 $34,027
YoY Growth 21% 22% 23% 22% 22% 20% 19% -4% 16%
Total North America $20,992 $22,370 $25,446 $37,302 $30,724 $32,169 $34,348 $38,827 $44,827 Ce moved to $44,120
Organic YoY 23% 27% 35% 25% 26% 25% 24% 4% 20%
FX -$484
Total $35,714 $37,955 $43,744 $60,453 $51,042 $52,886 $56,576 $66,500 $72,500
26% 33% 36% 39% 37% 30% 10% 20%
Guidance $66,500 $72,500
What does the Q4 guidance suggest?
1) Based upon what we interpolate, the guidance for total revenuegrowth ① implies -4% to
+16% growth for North America 1P & 3P Retail ②.
2) -4% is shockingly pessimistic and highly unlikely.
3) Consensus moved down to the high-end of implied guidance for North America. Consensus
③ is for +18% Total North America growth and +14% 1P & 3P North America Retail growth.
All rights reserv ed, Inflection Capital Management, LLC
3
1
2
3
4. 4All rights reserv ed, Inflection Capital Management, LLC
Amazon’s Tighten-up
Q1 '17 Q2 '17 Q3 '17 Q4 '17 2017 Q1 18 Q2 18 Q3 18 Q4 '18e 2018e
Fullfillment
North America
sq-footage 135,825 152,124
YoY Ch 40% 15% 12%
International
sq-footage 73,022 15% 81,785
23% 12%
Head Count 351 382.4 541.9 566 566 563.1 575.7 613.3
QoQ ex. WFM 10 31.4 68.5 24.1 -2.9 12.6 37.6
Inventory $10,600 $11,510 $13,711 $16,047 $16,047 $13,840 $14,824 $15,862
QoQ ex. WFM $10 $910 $1,730 $2,336 -$2,207 $984 $1,038
TTM-basis
Cap Ex $6,717 $8,207 $9,027 $10,058 $10,924 $11,372 $11,239
PPE from Capital Leases $3,891 $8,019 $8,905 $9,637 $10,020 $9,631 $9,704
Total $10,608 $16,226 $17,932 $19,695 $20,944 $21,003 $20,943
YoY Ch 43% 103% 109% 106% 97% 29% 17%
2
1
4
3
(thousands)
(millions)
1) Significant moderation in FC builds.
5. 5All rights reserv ed, Inflection Capital Management, LLC
Amazon’s Tighten-up
Q1 '17 Q2 '17 Q3 '17 Q4 '17 2017 Q1 18 Q2 18 Q3 18 Q4 '18e 2018e
Fullfillment
North America
sq-footage 135,825 152,124
YoY Ch 40% 15% 12%
International
sq-footage 73,022 15% 81,785
23% 12%
Head Count 351 382.4 541.9 566 566 563.1 575.7 613.3
QoQ ex. WFM 10 31.4 68.5 24.1 -2.9 12.6 37.6
Inventory $10,600 $11,510 $13,711 $16,047 $16,047 $13,840 $14,824 $15,862
QoQ ex. WFM $10 $910 $1,730 $2,336 -$2,207 $984 $1,038
TTM-basis
Cap Ex $6,717 $8,207 $9,027 $10,058 $10,924 $11,372 $11,239
PPE from Capital Leases $3,891 $8,019 $8,905 $9,637 $10,020 $9,631 $9,704
Total $10,608 $16,226 $17,932 $19,695 $20,944 $21,003 $20,943
YoY Ch 43% 103% 109% 106% 97% 29% 17%
2
1
4
3
(thousands)
(millions)
1) Significant moderation in FC builds.
2) Significant slowdown in head count additions.
6. 6All rights reserv ed, Inflection Capital Management, LLC
Amazon’s Tighten-up
Q1 '17 Q2 '17 Q3 '17 Q4 '17 2017 Q1 18 Q2 18 Q3 18 Q4 '18e 2018e
Fullfillment
North America
sq-footage 135,825 152,124
YoY Ch 40% 15% 12%
International
sq-footage 73,022 15% 81,785
23% 12%
Head Count 351 382.4 541.9 566 566 563.1 575.7 613.3
QoQ ex. WFM 10 31.4 68.5 24.1 -2.9 12.6 37.6
Inventory $10,600 $11,510 $13,711 $16,047 $16,047 $13,840 $14,824 $15,862
QoQ ex. WFM $10 $910 $1,730 $2,336 -$2,207 $984 $1,038
TTM-basis
Cap Ex $6,717 $8,207 $9,027 $10,058 $10,924 $11,372 $11,239
PPE from Capital Leases $3,891 $8,019 $8,905 $9,637 $10,020 $9,631 $9,704
Total $10,608 $16,226 $17,932 $19,695 $20,944 $21,003 $20,943
YoY Ch 43% 103% 109% 106% 97% 29% 17%
2
1
4
3
(thousands)
(millions)
1) Significant moderation in FC builds.
2) Significant slowdown in head count additions.
3) Much lower inventory added in Q2.
7. 7All rights reserv ed, Inflection Capital Management, LLC
Amazon’s Tighten-up
Q1 '17 Q2 '17 Q3 '17 Q4 '17 2017 Q1 18 Q2 18 Q3 18 Q4 '18e 2018e
Fullfillment
North America
sq-footage 135,825 152,124
YoY Ch 40% 15% 12%
International
sq-footage 73,022 15% 81,785
23% 12%
Head Count 351 382.4 541.9 566 566 563.1 575.7 613.3
QoQ ex. WFM 10 31.4 68.5 24.1 -2.9 12.6 37.6
Inventory $10,600 $11,510 $13,711 $16,047 $16,047 $13,840 $14,824 $15,862
QoQ ex. WFM $10 $910 $1,730 $2,336 -$2,207 $984 $1,038
TTM-basis
Cap Ex $6,717 $8,207 $9,027 $10,058 $10,924 $11,372 $11,239
PPE from Capital Leases $3,891 $8,019 $8,905 $9,637 $10,020 $9,631 $9,704
Total $10,608 $16,226 $17,932 $19,695 $20,944 $21,003 $20,943
YoY Ch 43% 103% 109% 106% 97% 29% 17%
2
1
4
3
(thousands)
(millions)
1) Significant moderation in FC builds.
2) Significant slowdown in head count additions.
3) Much lower inventory added in Q2.
4) Significant cut back in the growth of cap-ex spend.
8. 8
Prime’s Contribution to the Amazon Flywheel’s Momentum
2016 2017 2018e 2019e 2020e 2021e
NA GMV ($B) $137 $177 $227 $276 $331 $397
YoY $ Ch $34 $41 $50 $50 $55 $66
YoY % Ch 33% 30% 28% 22% 20% 20%
NA Prime Members EOP 70 83 95 106 115 121
YoY Ch 18 13 12 11 9 6
GMV Growth
GMV/New Member $2,150 $2,258 $2,370 $2,489 $2,613 $2,744
New Members $19 $15 $14 $14 $12 $8
Existing Members $15 $26 $35 $36 $43 $58
Ttl GMV from Ext. Members $118 $162 $212 $263 $319 $389
GMV per Member $2,246 $2,321 $2,560 $2,764 $3,010 $3,381
YoY % Ch 3% 10% 8% 9% 12%
North America (NA)
Gross MerchandiseValue
(GMV) is the total value
of merchandise sold on
Amazon.com from 1P
vendorsand 3P sellers.
The Amazon Flywheel is a commonly used expression to describe Amazon’s business model. The Flywheel effect is
where product and service offerings have self-reinforcing effects on Amazon and increase its ecosystem and business
momentum. One common example is Amazon offering lower prices, which begets more consumers and purchase
volume, which draws more brands and 3P sellers to Amazon.com, which expands the selection, which begets more
consumers and more purchase volume, which improves Amazon’s delivery route density, thus, allowing Amazon to
shorten shipping times which begets more shopper consideration, and so on a so forth.
Momentum is speed X mass. The larger the flywheel and the faster it spins, the larger its momentum. The larger a
flywheel’s momentum, the more difficult it is to slow, or stop.
All rights reserv ed, Inflection Capital Management, LLC
9. 9
2016 2017 2018e 2019e 2020e 2021e
NA GMV ($B) $137 $177 $227 $276 $331 $397
YoY $ Ch $34 $41 $50 $50 $55 $66
YoY % Ch 33% 30% 28% 22% 20% 20%
NA Prime Members EOP 70 83 95 106 115 121
YoY Ch 18 13 12 11 9 6
GMV Growth
GMV/New Member $2,150 $2,258 $2,370 $2,489 $2,613 $2,744
New Members $19 $15 $14 $14 $12 $8
Existing Members $15 $26 $35 $36 $43 $58
Ttl GMV from Ext. Members $118 $162 $212 $263 $319 $389
GMV per Member $2,246 $2,321 $2,560 $2,764 $3,010 $3,381
YoY % Ch 3% 10% 8% 9% 12%
GMV growth is the key
measure of success for
Amazon’s retail business
North America (NA)
Gross MerchandiseValue
(GMV) is the total value
of merchandise sold on
Amazon.com from 1P
vendorsand 3P sellers.
All rights reserv ed, Inflection Capital Management, LLC
Prime’s Contribution to the Amazon Flywheel’s Momentum
10. 10
2016 2017 2018e 2019e 2020e 2021e
NA GMV ($B) $137 $177 $227 $276 $331 $397
YoY $ Ch $34 $41 $50 $50 $55 $66
YoY % Ch 33% 30% 28% 22% 20% 20%
NA Prime Members EOP 70 83 95 106 115 121
YoY Ch 18 13 12 11 9 6
GMV Growth
GMV/New Member $2,150 $2,258 $2,370 $2,489 $2,613 $2,744
New Members $19 $15 $14 $14 $12 $8
Existing Members $15 $26 $35 $36 $43 $58
Ttl GMV from Ext. Members $118 $162 $212 $263 $319 $389
GMV per Member $2,246 $2,321 $2,560 $2,764 $3,010 $3,381
YoY % Ch 3% 10% 8% 9% 12%
As shown in the next slide, the
lift that GMV experiences from
Prime members spending more
(5-7X) vs. non-members is a key
driver of GMV growth
All rights reserv ed, Inflection Capital Management, LLC
Prime’s Contribution to the Amazon Flywheel’s Momentum
11. 11
1
2
I’ve seen other survey’s saying the number is above $3500
Membership Models are about Capturing Mindshare & Wallet-Share
12. 12
2016 2017 2018e 2019e 2020e 2021e
NA GMV ($B) $137 $177 $227 $276 $331 $397
YoY $ Ch $34 $41 $50 $50 $55 $66
YoY % Ch 33% 30% 28% 22% 20% 20%
NA Prime Members EOP 70 83 95 106 115 121
YoY Ch 18 13 12 11 9 6
GMV Growth
GMV/New Member $2,150 $2,258 $2,370 $2,489 $2,613 $2,744
New Members $19 $15 $14 $14 $12 $8
Existing Members $15 $26 $35 $36 $43 $58
Ttl GMV from Ext. Members $118 $162 $212 $263 $319 $389
GMV per Member $2,246 $2,321 $2,560 $2,764 $3,010 $3,381
YoY % Ch 3% 10% 8% 9% 12%
This is the growth in GMV
broken down between that
fromnew members and
that frommore spending
by existing members.
All rights reserv ed, Inflection Capital Management, LLC
Prime’s Contribution to the Amazon Flywheel’s Momentum
13. 13
Growth from
New Wallets
2016 2017 2018e 2019e 2020e 2021e
NA GMV ($B) $137 $177 $227 $276 $331 $397
YoY $ Ch $34 $41 $50 $50 $55 $66
YoY % Ch 33% 30% 28% 22% 20% 20%
NA Prime Members EOP 70 83 95 106 115 121
YoY Ch 18 13 12 11 9 6
GMV Growth
GMV/New Member $2,150 $2,258 $2,370 $2,489 $2,613 $2,744
New Members $19 $15 $14 $14 $12 $8
Existing Members $15 $26 $35 $36 $43 $58
Ttl GMV from Ext. Members $118 $162 $212 $263 $319 $389
GMV per Member $2,246 $2,321 $2,560 $2,764 $3,010 $3,381
YoY % Ch 3% 10% 8% 9% 12%
Before 2018, total GMV
growth was less reliant
on increases in per
Member spending
All rights reserv ed, Inflection Capital Management, LLC
Prime’s Contribution to the Amazon Flywheel’s Momentum
14. 14
Transitioning to wallet-share capture
Growth from
New Wallets
2016 2017 2018e 2019e 2020e 2021e
NA GMV ($B) $137 $177 $227 $276 $331 $397
YoY $ Ch $34 $41 $50 $50 $55 $66
YoY % Ch 33% 30% 28% 22% 20% 20%
NA Prime Members EOP 70 83 95 106 115 121
YoY Ch 18 13 12 11 9 6
GMV Growth
GMV/New Member $2,150 $2,258 $2,370 $2,489 $2,613 $2,744
New Members $19 $15 $14 $14 $12 $8
Existing Members $15 $26 $35 $36 $43 $58
Ttl GMV from Ext. Members $118 $162 $212 $263 $319 $389
GMV per Member $2,246 $2,321 $2,560 $2,764 $3,010 $3,381
YoY % Ch 3% 10% 8% 9% 12%
2018 is a
transitionary
period
All rights reserv ed, Inflection Capital Management, LLC
Prime’s Contribution to the Amazon Flywheel’s Momentum
15. All rights reserv ed, Inflection Capital Management, LLC 15
Prime Penetration of HHs getting very high
2016 2017 2018e 2019e 2020e 2021e
NA GMV ($B) $137 $177 $227 $276 $331 $397
YoY $ Ch $34 $41 $50 $50 $55 $66
YoY % Ch 33% 30% 28% 22% 20% 20%
(millions)
US HHs 126 126 128 130 132 134
Prime Membes/HH 56% 66% 74% 81% 87% 90%
NA Prime Members EOP 70 83 95 106 115 121
2016 2017 2018e 2019e 2020e 2021e
NA GMV ($B) $137 $177 $227 $276 $331 $397
YoY $ Ch $34 $41 $50 $50 $55 $66
YoY % Ch 33% 30% 28% 22% 20% 20%
(millions)
US HHs 126 126 128 130 132 134
Prime Membes/HH 56% 66% 74% 81% 87% 90%
NA Prime Members EOP 70 83 95 106 115 121
YoY Ch 18 13 12 11 9 6
2016 2017 2018e 2019e 2020e 2021e
NA GMV ($B) $137 $177 $227 $276 $331 $397
YoY $ Ch $34 $41 $50 $50 $55 $66
YoY % Ch 33% 30% 28% 22% 20% 20%
(millions)
US HHs 126 126 128 130 132 134
Prime Membes/HH 56% 66% 74% 81% 87% 90%
NA Prime Members EOP 70 83 95 106 115 121
YoY Ch 18 13 12 11 9 6
Churn 4 6 7 8 8 9
Net 18 13 12 11 9 6
Gross 22 19 19 19 17 15
Gross+Exisiting/HHs 59% 70% 79% 87% 94% 97%
This is the ratio of gross
new Prime Members&
Existing Prime Members to
US total households (HHs)
Prime’s Contribution to the Amazon Flywheel’s Momentum
16. All rights reserv ed, Inflection Capital Management, LLC 16
Our solving for NET new members based
upon HH penetration
2016 2017 2018e 2019e 2020e 2021e
NA GMV ($B) $137 $177 $227 $276 $331 $397
YoY $ Ch $34 $41 $50 $50 $55 $66
YoY % Ch 33% 30% 28% 22% 20% 20%
(millions)
US HHs 126 126 128 130 132 134
Prime Membes/HH 56% 66% 74% 81% 87% 90%
NA Prime Members EOP 70 83 95 106 115 121
2016 2017 2018e 2019e 2020e 2021e
NA GMV ($B) $137 $177 $227 $276 $331 $397
YoY $ Ch $34 $41 $50 $50 $55 $66
YoY % Ch 33% 30% 28% 22% 20% 20%
(millions)
US HHs 126 126 128 130 132 134
Prime Membes/HH 56% 66% 74% 81% 87% 90%
NA Prime Members EOP 70 83 95 106 115 121
YoY Ch 18 13 12 11 9 6
2016 2017 2018e 2019e 2020e 2021e
NA GMV ($B) $137 $177 $227 $276 $331 $397
YoY $ Ch $34 $41 $50 $50 $55 $66
YoY % Ch 33% 30% 28% 22% 20% 20%
(millions)
US HHs 126 126 128 130 132 134
Prime Membes/HH 56% 66% 74% 81% 87% 90%
NA Prime Members EOP 70 83 95 106 115 121
YoY Ch 18 13 12 11 9 6
Churn 4 6 7 8 8 9
Net 18 13 12 11 9 6
Gross 22 19 19 19 17 15
Gross+Exisiting/HHs 59% 70% 79% 87% 94% 97%
This is a HIGHLY
optimistic view of
wherepenetration
rates can reach.
Prime’s Contribution to the Amazon Flywheel’s Momentum
17. All rights reserv ed, Inflection Capital Management, LLC 17
2016 2017 2018e 2019e 2020e 2021e
NA GMV ($B) $137 $177 $227 $276 $331 $397
YoY $ Ch $34 $41 $50 $50 $55 $66
YoY % Ch 33% 30% 28% 22% 20% 20%
(millions)
US HHs 126 126 128 130 132 134
Prime Membes/HH 56% 66% 74% 81% 87% 90%
NA Prime Members EOP 70 83 95 106 115 121
2016 2017 2018e 2019e 2020e 2021e
NA GMV ($B) $137 $177 $227 $276 $331 $397
YoY $ Ch $34 $41 $50 $50 $55 $66
YoY % Ch 33% 30% 28% 22% 20% 20%
(millions)
US HHs 126 126 128 130 132 134
Prime Membes/HH 56% 66% 74% 81% 87% 90%
NA Prime Members EOP 70 83 95 106 115 121
YoY Ch 18 13 12 11 9 6
2016 2017 2018e 2019e 2020e 2021e
NA GMV ($B) $137 $177 $227 $276 $331 $397
YoY $ Ch $34 $41 $50 $50 $55 $66
YoY % Ch 33% 30% 28% 22% 20% 20%
(millions)
US HHs 126 126 128 130 132 134
Prime Membes/HH 56% 66% 74% 81% 87% 90%
NA Prime Members EOP 70 83 95 106 115 121
YoY Ch 18 13 12 11 9 6
Churn 4 6 7 8 8 9
Net 18 13 12 11 9 6
Gross 22 19 19 19 17 15
Gross+Exisiting/HHs 59% 70% 79% 87% 94% 97%
Our solving for NET new members based upon HH
penetration and an 8% churn rate (Costco’s is 10%)
Prime’s Contribution to the Amazon Flywheel’s Momentum
18. All rights reserv ed, Inflection Capital Management, LLC 18
2016 2017 2018e 2019e 2020e 2021e
NA GMV ($B) $137 $177 $227 $276 $331 $397
YoY $ Ch $34 $41 $50 $50 $55 $66
YoY % Ch 33% 30% 28% 22% 20% 20%
(millions)
US HHs 126 126 128 130 132 134
Prime Membes/HH 56% 66% 74% 81% 87% 90%
NA Prime Members EOP 70 83 95 106 115 121
2016 2017 2018e 2019e 2020e 2021e
NA GMV ($B) $137 $177 $227 $276 $331 $397
YoY $ Ch $34 $41 $50 $50 $55 $66
YoY % Ch 33% 30% 28% 22% 20% 20%
(millions)
US HHs 126 126 128 130 132 134
Prime Membes/HH 56% 66% 74% 81% 87% 90%
NA Prime Members EOP 70 83 95 106 115 121
YoY Ch 18 13 12 11 9 6
2016 2017 2018e 2019e 2020e 2021e
NA GMV ($B) $137 $177 $227 $276 $331 $397
YoY $ Ch $34 $41 $50 $50 $55 $66
YoY % Ch 33% 30% 28% 22% 20% 20%
(millions)
US HHs 126 126 128 130 132 134
Prime Membes/HH 56% 66% 74% 81% 87% 90%
NA Prime Members EOP 70 83 95 106 115 121
YoY Ch 18 13 12 11 9 6
Churn 4 6 7 8 8 9
Net 18 13 12 11 9 6
Gross 22 19 19 19 17 15
Gross+Exisiting/HHs 59% 70% 79% 87% 94% 97%
Our solving for NET new members based upon HH
penetration and an 8% churn rate (Costco’s is 10%)
Prime’s Contribution to the Amazon Flywheel’s Momentum
19. All rights reserv ed, Inflection Capital Management, LLC 19
2016 2017 2018e 2019e 2020e 2021e
NA GMV ($B) $137 $177 $227 $276 $331 $397
YoY $ Ch $34 $41 $50 $50 $55 $66
YoY % Ch 33% 30% 28% 22% 20% 20%
(millions)
US HHs 126 126 128 130 132 134
Prime Membes/HH 56% 66% 74% 81% 87% 90%
NA Prime Members EOP 70 83 95 106 115 121
2016 2017 2018e 2019e 2020e 2021e
NA GMV ($B) $137 $177 $227 $276 $331 $397
YoY $ Ch $34 $41 $50 $50 $55 $66
YoY % Ch 33% 30% 28% 22% 20% 20%
(millions)
US HHs 126 126 128 130 132 134
Prime Membes/HH 56% 66% 74% 81% 87% 90%
NA Prime Members EOP 70 83 95 106 115 121
YoY Ch 18 13 12 11 9 6
2016 2017 2018e 2019e 2020e 2021e
NA GMV ($B) $137 $177 $227 $276 $331 $397
YoY $ Ch $34 $41 $50 $50 $55 $66
YoY % Ch 33% 30% 28% 22% 20% 20%
(millions)
US HHs 126 126 128 130 132 134
Prime Membes/HH 56% 66% 74% 81% 87% 90%
NA Prime Members EOP 70 83 95 106 115 121
YoY Ch 18 13 12 11 9 6
Churn 4 6 7 8 8 9
Net 18 13 12 11 9 6
Gross 22 19 19 19 17 15
Gross+Exisiting/HHs 59% 70% 79% 87% 94% 97%
Should penetration not
reach these levels,
spend/Member will
have to be larger for
the same GMV.
Prime’s Contribution to the Amazon Flywheel’s Momentum
20. All rights reserv ed, Inflection Capital Management, LLC 20
1
2016 2017 2018e 2019e 2020e 2021e
NA GMV ($B) $137 $177 $227 $276 $331 $397
YoY $ Ch $34 $41 $50 $50 $55 $66
YoY % Ch 33% 30% 28% 22% 20% 20%
(millions)
US HHs 126 126 128 130 132 134
Prime Membes/HH 56% 66% 74% 81% 87% 90%
NA Prime Members EOP 70 83 95 106 115 121
2016 2017 2018e 2019e 2020e 2021e
NA GMV ($B) $137 $177 $227 $276 $331 $397
YoY $ Ch $34 $41 $50 $50 $55 $66
YoY % Ch 33% 30% 28% 22% 20% 20%
(millions)
US HHs 126 126 128 130 132 134
Prime Membes/HH 56% 66% 74% 81% 87% 90%
NA Prime Members EOP 70 83 95 106 115 121
YoY Ch 18 13 12 11 9 6
Significant slowdown in
Prime Membership
coming even under very
optimistic assumptions
Membership Growth’s Contribution to the Amazon Flywheel’s Momentum Fading
21. All rights reserv ed, Inflection Capital Management, LLC 21
How will Amazon NA GMV continue growing > 20%
with Prime Membership growth slowing?
Growth from
New Wallets
Growth from
Wallet Share
2
2016 2017 2018e 2019e 2020e 2021e
NA GMV ($B) $137 $177 $227 $276 $331 $397
YoY $ Ch $34 $41 $50 $50 $55 $66
YoY % Ch 33% 30% 28% 22% 20% 20%
NA Prime Members EOP 70 83 95 106 115 121
YoY Ch 18 13 12 11 9 6
GMV Growth
GMV/New Member $2,150 $2,258 $2,370 $2,489 $2,613 $2,744
New Members $19 $15 $14 $14 $12 $8
Existing Members $15 $26 $35 $36 $43 $58
Ttl GMV from Ext. Members $118 $162 $212 $263 $319 $389
GMV per Member $2,246 $2,321 $2,560 $2,764 $3,010 $3,381
YoY % Ch 3% 10% 8% 9% 12%
GMV growth from
existing members will
need to be the driver.
22. All rights reserv ed, Inflection Capital Management, LLC
22
Growth from
New Wallets
Growth from
Wallet Share
2016 2017 2018e 2019e 2020e 2021e
NA GMV ($B) $137 $177 $227 $276 $331 $397
YoY $ Ch $34 $41 $50 $50 $55 $66
YoY % Ch 33% 30% 28% 22% 20% 20%
NA Prime Members EOP 70 83 95 106 115 121
YoY Ch 18 13 12 11 9 6
GMV Growth
GMV/New Member $2,150 $2,258 $2,370 $2,489 $2,613 $2,744
New Members $19 $15 $14 $14 $12 $8
Existing Members $15 $26 $35 $36 $43 $58
Ttl GMV from Ext. Members $118 $162 $212 $263 $319 $389
GMV per Member $2,246 $2,321 $2,560 $2,764 $3,010 $3,381
YoY % Ch 3% 10% 8% 9% 12%
Growth from
New Wallets
How will Amazon NA GMV continue growing > 20%
with Prime Membership growth slowing?
23. Allrightsreserved,InflectionCapitalManagement,LLC
23
The Flywheel Momentum’s
will need to be driven by new areas of spending
Growth from
New Wallets
Growth from
Wallet Share
2016 2017 2018e 2019e 2020e 2021e
NA GMV ($B) $137 $177 $227 $276 $331 $397
YoY $ Ch $34 $41 $50 $50 $55 $66
YoY % Ch 33% 30% 28% 22% 20% 20%
NA Prime Members EOP 70 83 95 106 115 121
YoY Ch 18 13 12 11 9 6
GMV Growth
GMV/New Member $2,150 $2,258 $2,370 $2,489 $2,613 $2,744
New Members $19 $15 $14 $14 $12 $8
Existing Members $15 $26 $35 $36 $43 $58
Ttl GMV from Ext. Members $118 $162 $212 $263 $319 $389
GMV per Member $2,246 $2,321 $2,560 $2,764 $3,010 $3,381
YoY % Ch 3% 10% 8% 9% 12%
Growth from
New Wallets
Growth from
Wallet Share
24. Flywheel Momentum Accelerators
Alexa
Whole Foods 365
• Brand &
• PL SourcingCapability
Whole Foods Stores
• 10% off for Prime Membership
• Explore Kindle, Alexa, &
Amazon’s brands
In Home Advisor
Home Services
Fire & TV Devices
Market-3 ?
Voice Search
Healthcare
• Prescriptions
• Insurance
Market-2 ?
Entertainment
• Twitch (e-gaming)
• Video subscriptions
• Bundles (channels)
• Mov ies
24All rights reserv ed, Inflection Capital Management, LLC
Current & Near-future Drivers
Next Vintage of Drivers
26. 26
What is Market-2?
1) Large enough to move the needle for Amazon.
2) Different segment of consumption than Amazon currently serves.
3) It needs to address a customer need, pain-point, or friction-point.
4) Increases the value and affinity of a Prime Membership.
5) Synergistic to Amazon’s current assets.
6) Scale & network-effect business model.
7) Contributes relatively quickly. This likely eliminates regulated industries.
8) Scalable globally.
9) It can not suggest over-reach by Amazon that alarms consumers or
regulators.
10)Given the above, it likely needs to disrupt the status-quo of an industry
and more likely an industry where the incumbents are taking too much in
economic rent.
All rights reserv ed, Inflection Capital Management, LLC