Lease Operating Report
•Descargar como XLS, PDF•
0 recomendaciones•1,875 vistas

This is a brief example of a Lease Operating Statement

Recomendados
Más contenido relacionado
La actualidad más candente
La actualidad más candente (16)
Destacado
Destacado (20)
Similar a Lease Operating Report
Similar a Lease Operating Report (20)
Lease Operating Report
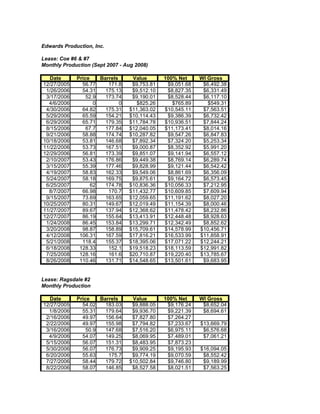
- 1. Edwards Production, Inc. Lease: Coe #6 & #7 Monthly Production (Sept 2007 - Aug 2008) Date Price Barrels Value 100% Net WI Gross 12/27/2005 56.77 171.8 $9,753.81 $9,051.68 $6,492.38 1/26/2006 54.31 175.13 $9,512.10 $8,827.35 $6,331.49 3/17/2006 52.9 173.74 $9,190.01 $8,528.44 $6,117.10 4/6/2006 0 0 $825.26 $765.89 $549.31 4/30/2006 64.82 175.31 $11,363.02 $10,545.11 $7,563.51 5/29/2006 65.59 154.21 $10,114.43 $9,386.39 $6,732.42 6/29/2006 65.71 179.35 $11,784.78 $10,936.51 $7,844.24 8/15/2006 67.7 177.84 $12,040.05 $11,173.41 $8,014.16 9/21/2006 58.88 174.74 $10,287.82 $9,547.26 $6,847.83 10/18/2006 53.81 146.68 $7,892.34 $7,324.20 $5,253.34 11/22/2006 53.73 167.51 $9,000.87 $8,352.92 $5,991.20 12/29/2006 56.81 173.39 $9,851.07 $9,141.94 $6,557.12 2/10/2007 53.43 176.86 $9,449.38 $8,769.14 $6,289.74 3/15/2007 55.39 177.46 $9,828.99 $9,121.44 $6,542.42 4/19/2007 58.83 162.33 $9,549.06 $8,861.69 $6,356.09 5/24/2007 58.18 169.75 $9,875.61 $9,164.72 $6,573.45 6/25/2007 62 174.78 $10,836.36 $10,056.33 $7,212.95 8/7/2007 66.98 170.7 $11,432.77 $10,609.85 $7,609.94 9/15/2007 73.69 163.65 $12,059.65 $11,191.62 $8,027.20 10/25/2007 80.31 149.67 $12,019.49 $11,154.39 $8,000.46 11/27/2007 89.67 137.94 $12,368.62 $11,478.42 $8,232.86 12/27/2007 86.19 155.64 $13,413.91 $12,448.48 $8,928.63 1/24/2008 86.45 153.84 $13,299.71 $12,342.49 $8,852.62 3/20/2008 98.87 158.89 $15,709.61 $14,578.99 $10,456.71 4/12/2008 106.31 167.59 $17,816.21 $16,533.99 $11,858.91 5/21/2008 118.4 155.37 $18,395.06 $17,071.22 $12,244.21 6/18/2008 128.33 152.1 $19,518.23 $18,113.59 $12,991.82 7/25/2008 128.16 161.6 $20,710.87 $19,220.40 $13,785.67 8/26/2008 110.46 131.71 $14,548.65 $13,501.61 $9,683.95 Lease: Ragsdale #2 Monthly Production Date Price Barrels Value 100% Net WI Gross 12/27/2005 54.02 183.03 $9,888.05 $9,176.24 $8,652.04 1/8/2006 55.31 179.64 $9,936.70 $9,221.39 $8,694.61 2/16/2006 49.97 156.64 $7,827.80 $7,264.27 2/22/2006 49.97 155.98 $7,794.82 $7,233.67 $13,669.79 3/16/2006 50.9 147.68 $7,516.20 $6,975.11 $6,576.68 4/9/2006 54.07 149.25 $8,069.95 $7,489.01 $7,061.21 5/15/2006 56.07 151.31 $8,483.95 $7,873.23 5/30/2006 56.07 176.73 $9,909.25 $9,195.93 $16,094.05 6/20/2006 55.63 175.7 $9,774.19 $9,070.59 $8,552.42 7/27/2006 58.44 179.72 $10,502.84 $9,746.80 $9,189.99 8/22/2006 58.07 146.85 $8,527.58 $8,021.51 $7,563.25
- 2. 9/8/2006 49.38 151.66 $7,488.97 $6,949.84 9/26/2006 49.38 139.47 $6,887.03 $6,391.23 $12,579.00 10/27/2006 43.8 181.11 $7,932.62 $7,361.51 $6,941.04 11/30/2006 42.03 174.84 $7,348.53 $6,819.45 $6,429.96 12/29/2006 45.15 183.95 $8,305.34 $7,707.40 $7,267.17 1/31/2007 39.52 180.4 $7,129.41 $6,616.09 $6,238.23 2/1/2007 44.45 178.47 $7,932.99 $7,361.85 $6,941.37 3/15/2007 46.51 140.98 $6,556.98 $6,084.92 $5,737.36 3/15/2007 46.95 41.95 $1,969.55 $1,951.09 $1,951.09 4/11/2007 49.23 183.91 $9,053.89 $8,402.10 4/26/2007 49.23 153.6 $7,561.73 $7,017.36 $14,538.67 5/12/2007 48.03 159.43 $7,657.42 $7,106.15 $6,700.24 6/12/2007 52.25 65.8 $3,438.05 $3,438.05 $3,438.05 6/12/2007 52.25 93.6 $4,890.60 $4,538.53 6/25/2007 52.25 153.54 $8,022.47 $7,444.94 $11,298.93 7/5/2007 59.69 162.29 $9,687.09 $6,989.78 7/23/2007 59.69 157.57 $9,405.35 $8,728.31 $16,705.88 8/22/2007 57.79 148.15 $8,561.59 $7,945.29 $7,491.39 9/13/2007 65.02 163.21 $10,611.91 $9,848.06 9/28/2007 65.02 153.59 $9,986.42 $9,267.58 $18,023.54 10/27/2007 72.09 153.1 $11,036.98 $10,242.55 $9,657.36 11/7/2007 80.36 156.44 $12,571.52 $11,666.69 $11,000.08 12/1/2007 75.21 151.77 $11,414.62 $10,593.05 12/22/2007 75.21 156.12 $11,741.79 $10,896.66 $20,261.86 1/15/2008 79.07 156.27 $12,356.27 $11,466.92 $10,811.74 2/7/2008 81.63 153.46 $12,526.94 $11,625.31 2/29/2008 81.63 145.48 $11,875.53 $11,020.79 $21,352.16 3/24/2008 90.61 155.08 $14,051.80 $13,040.46 $12,295.33 4/17/2008 99.59 153.41 $15,277.84 $14,178.29 $13,368.11 5/9/2008 111.09 155.13 $17,233.39 $16,122.72 5/9/2008 111.99 154.16 $17,264.38 $16,021.90 $30,307.72 6/23/2008 120.3 153.61 $18,478.51 $17,148.67 $16,168.70 7/18/2008 120.97 153.66 $18,588.45 $17,250.70 $16,264.89 8/12/2008 104.12 151.82 $15,807.45 $14,669.81 8/12/2008 104.12 155.3 $16,169.79 $15,006.06 $27,980.09 9/27/2008 92.31 154.88 $14,297.48 $13,268.48 $12,510.30
- 3. Lease: Coe #6 & #7 Monthly Production (Sept 2007 - Aug 2008) Date Price Barrels Daily Value WI Gross Expense WI Net 12/27/2005 56.77 171.8 5.7 $9,753.81 $6,492.38 $200.00 $6,292.38 1/26/2006 54.31 175.13 5.8 $9,512.10 $6,331.49 $200.00 $6,131.49 3/17/2006 52.9 173.74 5.8 $9,190.01 $6,117.10 $200.00 $5,917.10 4/6/2006 0 0 0.0 $825.26 $549.31 $200.00 $349.31 4/30/2006 64.82 175.31 5.8 $11,363.02 $7,563.51 $200.00 $7,363.51 5/29/2006 65.59 154.21 5.1 $10,114.43 $6,732.42 $200.00 $6,532.42 6/29/2006 65.71 179.35 6.0 $11,784.78 $7,844.24 $200.00 $7,644.24 8/15/2006 67.7 177.84 5.9 $12,040.05 $8,014.16 $200.00 $7,814.16 9/21/2006 58.88 174.74 5.8 $10,287.82 $6,847.83 $200.00 $6,647.83 10/18/2006 53.81 146.68 4.9 $7,892.34 $5,253.34 $200.00 $5,053.34 11/22/2006 53.73 167.51 5.6 $9,000.87 $5,991.20 $200.00 $5,791.20 12/29/2006 56.81 173.39 5.8 $9,851.07 $6,557.12 $200.00 $6,357.12 2/10/2007 53.43 176.86 5.9 $9,449.38 $6,289.74 $200.00 $6,089.74 3/15/2007 55.39 177.46 5.9 $9,828.99 $6,542.42 $200.00 $6,342.42 4/19/2007 58.83 162.33 5.4 $9,549.06 $6,356.09 $200.00 $6,156.09 5/24/2007 58.18 169.75 5.7 $9,875.61 $6,573.45 $200.00 $6,373.45 6/25/2007 62 174.78 5.8 $10,836.36 $7,212.95 $200.00 $7,012.95 8/7/2007 66.98 170.7 5.7 $11,432.77 $7,609.94 $200.00 $7,409.94 9/15/2007 73.69 163.65 5.5 $12,059.65 $8,027.20 $200.00 $7,827.20 10/25/2007 80.31 149.67 5.0 $12,019.49 $8,000.46 $200.00 $7,800.46 11/27/2007 89.67 137.94 4.6 $12,368.62 $8,232.86 $200.00 $8,032.86 12/27/2007 86.19 155.64 5.2 $13,413.91 $8,928.63 $200.00 $8,728.63 1/24/2008 86.45 153.84 5.1 $13,299.71 $8,852.62 $200.00 $8,652.62 3/20/2008 98.87 158.89 5.3 $15,709.61 $10,456.71 $200.00 $10,256.71 4/12/2008 106.31 167.59 5.6 $17,816.21 $11,858.91 $200.00 $11,658.91 5/21/2008 118.4 155.37 5.2 $18,395.06 $12,244.21 $200.00 $12,044.21 6/18/2008 128.33 152.1 5.1 $19,518.23 $12,991.82 $200.00 $12,791.82 7/25/2008 128.16 161.6 5.4 $20,710.87 $13,785.67 $200.00 $13,585.67 8/26/2008 110.46 131.71 4.4 $14,548.65 $9,683.95 $200.00 $9,483.95 2007 AVG Production: 2008 AVG Production (Jan-Aug) Monthly: 136.6 Monthly: 135.1 Daily: 4.6 Daily: 4.5 Projection Barrels Monthly Monthly Monthly Monthly Example Price per Daily WI Annual Value WI Gross Expense WI Net Month $40/barrel $40.00 135.1 4.5 $5,405.50 $3,600.06 $200.00 $3,400.06 $40,800.76 $45/barrel $45.00 135.1 4.5 $6,081.19 $4,050.07 $200.00 $3,850.07 $46,200.85 $50/barrel $50.00 135.1 4.5 $6,756.88 $4,500.08 $200.00 $4,300.08 $51,600.95 $55/barrel $55.00 135.1 4.5 $7,432.56 $4,950.09 $200.00 $4,750.09 $57,001.04
- 4. Lease: Ragsdale #2 Monthly Production 9% Date Price Barrels Daily Value WI Gross LOExpense WI Net 12/27/2005 54.02 183.03 6.1 $9,888.05 $8,652.04 $778.68 $7,873.36 1/8/2006 55.31 179.64 6.0 $9,936.70 $8,694.61 $782.51 $7,912.10 2/16/2006 49.97 156.64 5.2 $7,827.80 $- $- 2/22/2006 49.97 155.98 5.2 $7,794.82 $13,669.79 $1,230.28 $12,439.51 3/16/2006 50.9 147.68 4.9 $7,516.20 $6,576.68 $591.90 $5,984.78 4/9/2006 54.07 149.25 5.0 $8,069.95 $7,061.21 $635.51 $6,425.70 5/15/2006 56.07 151.31 5.0 $8,483.95 $- $- 5/30/2006 56.07 176.73 5.9 $9,909.25 $16,094.05 $1,448.46 $14,645.59 6/20/2006 55.63 175.7 5.9 $9,774.19 $8,552.42 $769.72 $7,782.70 7/27/2006 58.44 179.72 6.0 $10,502.84 $9,189.99 $827.10 $8,362.89 8/22/2006 58.07 146.85 4.9 $8,527.58 $7,563.25 $680.69 $6,882.56 9/8/2006 49.38 151.66 5.1 $7,488.97 $- $- 9/26/2006 49.38 139.47 4.6 $6,887.03 $12,579.00 $1,132.11 $11,446.89 10/27/2006 43.8 181.11 6.0 $7,932.62 $6,941.04 $624.69 $6,316.35 11/30/2006 42.03 174.84 5.8 $7,348.53 $6,429.96 $578.70 $5,851.26 12/29/2006 45.15 183.95 6.1 $8,305.34 $7,267.17 $654.05 $6,613.12 1/31/2007 39.52 180.4 6.0 $7,129.41 $6,238.23 $561.44 $5,676.79 2/1/2007 44.45 178.47 5.9 $7,932.99 $6,941.37 $624.72 $6,316.65 3/15/2007 46.51 140.98 4.7 $6,556.98 $5,737.36 $516.36 $5,221.00 3/15/2007 46.95 41.95 1.4 $1,969.55 $1,951.09 $175.60 $1,775.49 4/11/2007 49.23 183.91 6.1 $9,053.89 $- $- 4/26/2007 49.23 153.6 5.1 $7,561.73 $14,538.67 $1,308.48 $13,230.19 5/12/2007 48.03 159.43 5.3 $7,657.42 $6,700.24 $603.02 $6,097.22 6/12/2007 52.25 65.8 2.2 $3,438.05 $3,438.05 $309.42 $3,128.63 6/12/2007 52.25 93.6 3.1 $4,890.60 $- $- 6/25/2007 52.25 153.54 5.1 $8,022.47 $11,298.93 $1,016.90 $10,282.03 7/5/2007 59.69 162.29 5.4 $9,687.09 $- $- 7/23/2007 59.69 157.57 5.3 $9,405.35 $16,705.88 $1,503.53 $15,202.35 8/22/2007 57.79 148.15 4.9 $8,561.59 $7,491.39 $674.23 $6,817.16 9/13/2007 65.02 163.21 5.4 $10,611.91 $- $- 9/28/2007 65.02 153.59 5.1 $9,986.42 $18,023.54 $1,622.12 $16,401.42 10/27/2007 72.09 153.1 5.1 $11,036.98 $9,657.36 $869.16 $8,788.20 11/7/2007 80.36 156.44 5.2 $12,571.52 $11,000.08 $990.01 $10,010.07 12/1/2007 75.21 151.77 5.1 $11,414.62 $- $- 12/22/2007 75.21 156.12 5.2 $11,741.79 $20,261.86 $1,823.57 $18,438.29 1/15/2008 79.07 156.27 5.2 $12,356.27 $10,811.74 $973.06 $9,838.68 2/7/2008 81.63 153.46 5.1 $12,526.94 $- $- 2/29/2008 81.63 145.48 4.8 $11,875.53 $21,352.16 $1,921.69 $19,430.47 3/24/2008 90.61 155.08 5.2 $14,051.80 $12,295.33 $1,106.58 $11,188.75 4/17/2008 99.59 153.41 5.1 $15,277.84 $13,368.11 $1,203.13 $12,164.98 5/9/2008 111.09 155.13 5.2 $17,233.39 $- $- 5/9/2008 111.99 154.16 5.1 $17,264.38 $30,307.72 $2,727.69 $27,580.03 6/23/2008 120.3 153.61 5.1 $18,478.51 $16,168.70 $1,455.18 $14,713.52 7/18/2008 120.97 153.66 5.1 $18,588.45 $16,264.89 $1,463.84 $14,801.05 8/12/2008 104.12 151.82 5.1 $15,807.45 $- $- 8/12/2008 104.12 155.3 5.2 $16,169.79 $27,980.09 $2,518.21 $25,461.88 9/27/2008 92.31 154.88 5.2 $14,297.48 $12,510.30 $1,125.93 $11,384.37 2007 AVG Production 2008 AVG Production (Jan-Sept) Monthly: 229.5 Monthly: 204.7 Daily: 7.6 Daily: 6.8 Projection Barrels per Monthly Monthly Monthly Monthly Example Price Daily Month Value WI Gross Expense WI Net $40/barrel $40.00 204.7 6.8 $8,187.82 $7,164.34 $600.00 $6,564.34 $45/barrel $45.00 204.7 6.8 $9,211.30 $8,059.89 $600.00 $7,459.89 $50/barrel $50.00 204.7 6.8 $10,234.78 $8,955.43 $600.00 $8,355.43 $55/barrel $55.00 204.7 6.8 $11,258.26 $9,850.97 $600.00 $9,250.97
- 5. WI Annual $78,772.13 $89,518.65 $100,265.17 $111,011.68
- 6. Edwards Production Deal Structure Example 1. Annual Combined Lease Valuation Ragsdale #2 Cole 6& 7 Current Daily Combined 2.5x Annual 3x 4x 4.5x 5x 6x Annual Before Annual Oil Price BOPD Annual Annual Annual Annual Annual Annual Tax Before Tax Multiple 2.5 3.0 4.0 4.5 5.0 6.0 40 $78,772.13 $40,800.76 11.3 $119,573 $298,932 $358,719 $478,292 $538,078 $597,864 $717,437 45 $89,518.65 $46,200.85 11.3 $135,720 $339,299 $407,159 $542,878 $610,738 $678,598 $814,317 50 $100,265.17 $51,600.95 11.3 $151,866 $379,665 $455,598 $607,464 $683,398 $759,331 $911,197 55 $111,011.68 $57,001.04 11.3 $168,013 $420,032 $504,038 $672,051 $756,057 $840,064 $1,008,076 2. Additional Earn Out For Seller over 3 Years AVG Oil Year 1 Total 3 Price - 12 Minimum Oil Bonus Barrel Daily Total Additional Year 1 Year 2 Year 3 Earn Mos Post- Price BOPD Additional Earn Out % Earn Out Year Earn Out Out Closing Value Earn Out $60.00 $60.00 0 11.3 $- 40% $65.00 $60.00 1,800 11.3 $20,390 40% $8,156 $8,156 $8,156 $24,468 $70.00 $60.00 3,600 11.3 $40,780 40% $16,312 $16,312 $16,312 $48,936 $75.00 $60.00 5,400 11.3 $61,170 40% $24,468 $24,468 $24,468 $73,404 $80.00 $60.00 7,200 11.3 $81,560 40% $32,624 $32,624 $32,624 $97,872 $85.00 $60.00 9,000 11.3 $101,950 40% $40,780 $40,780 $40,780 $122,340 $90.00 $60.00 10,800 11.3 $122,340 40% $48,936 $48,936 $48,936 $146,808 $95.00 $60.00 12,600 11.3 $142,730 40% $57,092 $57,092 $57,092 $171,276 $100.00 $60.00 14,400 11.3 $163,120 40% $65,248 $65,248 $65,248 $195,744 3. Example: 4x Annual Purchase Price @ $50 Current Oil Price with $70 / $80 / $90 Future Oil Prices AVG Oil Total 3 Current Price - 12 Oil Price 4x Annual Mos Post- Year Total Closing Earn Out $50.00 $607,464 $70.00 $48,936 $656,400 $50.00 $607,464 $80.00 $97,872 $705,336 $50.00 $607,464 $90.00 $146,808 $754,272 4. Example: 5x Annual Purchase Price @ $55 Current Oil Price with $70 / $80 / $90 Future Oil Prices AVG Oil Total 3 Current Price - 12 Oil Price 5x Annual Mos Post- Year Total Closing Earn Out $55.00 $840,064 $70.00 $48,936 $889,000 $55.00 $840,064 $80.00 $97,872 $937,936 $55.00 $840,064 $90.00 $146,808 $986,871