2013 Toronto Top neighbouhoods - Report By Remax

Affordability remained the strongest driver of residential housing in the Toronto market in the first half of 2013, with single-detached homes in neighbourhoods east and west of the central core posting the best overall performances, according to RE/MAX Ontario-Atlantic Canada. RE/MAX examined 35 Toronto Real Estate Board districts between January and June of 2013 and found that single-detached housing values had appreciated year-over-year in close to 86 per cent of neighbourhoods in the 416 area code (30/35 districts). While the central core experienced the highest percentage gains in Don Mills, Parkwoods-Donalda, and Victoria Village (C13) at 12.7 per cent ($1,105,574 vs. $980,727) and Oakwood-Vaughan, Humewood-Cedarvale, and Forest Hill South (C03) at 11.7 per cent ($1,324,608 vs. $1,186,320), these were the only markets in the core that experienced significant growth. On the other hand, average prices increased across the board in both the west and eastern districts—with gains ranging from just under one per cent to 10 per cent. Rounding out the top five for average price appreciation were the west-end neighbourhoods of Keelesdale, Eglington West, Weston-Pellam Park (W03), posting a gain of 10.2 per cent (to $457,079); followed by Sunnylea, The Queensway, Humber Bay (W07), where prices climbed 9.4 per cent (to $833,026); and York, Glen Park, Amesbury, Brookhaven, Weston and Fairbank (W04), with a 9.2 per cent increase (to $538,469). Competition was clearly evident in the city's top five neighbourhoods. In June alone, 46 per cent of detached homes that sold between $400,000 and $1 million changed hands for over list price.

Recomendados
Recomendados
Más contenido relacionado
Último
Último (19)
Destacado
Destacado (20)
2013 Toronto Top neighbouhoods - Report By Remax
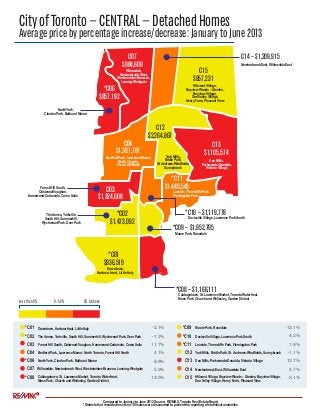
- 1. 09 ,670 W04 $538,469 W05 $555,678 W07 $833,026 *W01 $1,017,019 *C01 $936,519 E01 112 *E02 71 *E03 71 *C11 $1,440,543 *C02 $1,473,092 C03 $1,324,608W03 $457,079 W02 $819,149 C04 $1,361,781 C12 $2,264,867 *C06 $857,192 C07 $984,608 C15 $957,231 C13 $1,105,574 E04 230 E05 304 E07 223 E0 31 E08 125 *E06 14 The Westway, lowridge), –Westmount Bloor West Village, Baby Point, The Junction, High Park North Keelesdale, Eglinton West, Rockcliffe-Smythe, Weston-Pellam Park, Corso Italia High Park, South Parkdale, Swansea, Roncesvale Village Sunnylea, The Queensway, Humber Bay branch, ood coke, eane, osethorn, y, st, York, Glen Park, Amesbury (Brookhaven), Pelmo Park – Humberlea, Weston, Fairbank (Briar Hill-Belgravia), Maple Leaf, Mount Dennis Downsview, Humber Summit, Humbermede (Emery), Jane and Finch (Black Creek/Glenfield-Jane Heights), York University Heights CityofToronto—CENTRAL—DetachedHomes Averagepricebypercentageincrease/decrease:JanuarytoJune2013 -2.1% -1.2% 11.7% 4.1% 8.8% 5.9% 13.5% *C09 *C10 *C11 C12 C13 C14 C15 Downtown, Harbourfront, Little Italy The Annex, Yorkville, South Hill, Summerhill, Wychwood Park, Deer Park Forest Hill South, Oakwood-Vaughan, Humewood-Cedarvale, Corso Italia Bedford Park, Lawrence Manor, North Toronto, Forest Hill North North York, Clanton Park, Bathurst Manor Willowdale, Newtonbrook West, Westminister-Branson, Lansing-Westgate Cabbagetown, St. Lawrence Market, Toronto Waterfront, Moss Park, Church and Wellesley, Garden District Moore Park, Rosedale Davisville Village, Lawrence Park South Leaside, Thorncliffe Park, Flemingdon Park York Mills, Bridle Path, St. Andrews-Windfields, Sunnybrook Don Mills, Parkwoods-Donalda, Victoria Village Newtonbrook East, Willowdale East Hillcrest Village, Bayview Woods – Steeles, Bayview Village, Don Valley Village, Henry Farm, Pleasant View R Compared to January to June 2012 Source: RE/MAX, Toronto Real Estate Board *Districts that recorded less than 100 sales were discounted to prevent the reporting of statistical anomalies *C08 – $1,166,111 *C09 – $1,952,795 *C10 – $1,119,778 C14 – $1,209,915 Downtown, Harbourfront, Little Italy The Annex, Yorkville, South Hill, Summerhill, Wychwood Park, Deer Park Forest Hill South, Oakwood-Vaughan, Humewood-Cedarvale, Corso Italia Bedford Park, Lawrence Manor, North Toronto, Forest Hill North North York, Clanton Park, Bathurst Manor Willowdale, Newtonbrook West, Westminister-Branson, Lansing-Westgate Cabbagetown, St. Lawrence Market, Toronto Waterfront, Moss Park, Church and Wellesley, Garden District Moore Park, Rosedale Davisville Village, Lawrence Park South Leaside, Thorncliffe Park, Flemingdon Park York Mills, Bridle Path, St. Andrews-Windfields, Sunnybrook Don Mills, Parkwoods-Donalda, Victoria Village Newtonbrook East, Willowdale East Hillcrest Village, Bayview Woods – Steeles, Bayview Village, Don Valley Village, Henry Farm, Pleasant View 5% & Above0–4.9%Less than 0% *C01 *C02 C03 C04 *C06 C07 *C08 -13.1% 4.2% 1.9% -1.1% 12.7% 4.7% -3.1%
- 2. E01 $727,497 E02 $863,090 E03 $631,768 C11 150 C10 221 *C12 56 07 03 C14 644 C15 418 C13 207 E04 $464,993 E05 $649,884 E07 $598,826 E09 $450,161 E08 $569,071 E06 $579,596 E10 $546,060 E11 $484,424 C08 711 *C09 65 CityofToronto—EAST—DetachedHomes Averagepricebypercentageincrease/decrease:JanuarytoJune2013 6.4% 0.2% 6.0% 4.8% 4.9% 8.8% 6.2% 3.2% 6.2% 6.5% 3.8% E01 E02 E03 E04 E05 E06 E07 E08 E09 E10 E11 Riverdale, Danforth (Greektown), Leslieville The Beaches, Woodbine Corridor Danforth (Greektown), East York, Playter Estates, Broadview North (Old East York), O’Connor-Parkview, Crescent Town The Golden Mile, Dorset Park, Wexford, Maryvale, Scarborough Junction (Kennedy Park), Ionview, Clairlea Steeles, L’Amoreaux, Tam O’Shanter-Sullivan Birch Cliff, Oakridge, Hunt Club, Cliffside Agincourt North Scarborough Village, Cliffcrest, Guildwood, Eglinton East (Knob Hill) Scarborough City Centre, Woburn, Morningside, Bendale (Cedarbrae) Rouge (South), Port Union (Centennial Scarborough), West Hill, Highland Creek R 5% & Above0–4.9%Less than 0% Compared to January to June 2012 Source: RE/MAX, Toronto Real Estate Board *Districts that recorded less than 100 sales were discounted to prevent the reporting of statistical anomalies Riverdale, Danforth (Greektown), Leslieville The Beaches, Woodbine Corridor Danforth (Greektown), East York, Playter Estates, Broadview North (Old East York), O’Connor-Parkview, Crescent Town The Golden Mile, Dorset Park, Wexford, Maryvale, Scarborough Junction (Kennedy Park), Ionview, Clairlea Steeles, L’Amoreaux, Tam O’Shanter-Sullivan Birch Cliff, Oakridge, Hunt Club, Cliffside Agincourt North Scarborough Village, Cliffcrest, Guildwood, Eglinton East (Knob Hill) Scarborough City Centre, Woburn, Morningside, Bendale (Cedarbrae) Rouge (South), Port Union (Centennial Scarborough), West Hill, Highland Creek Rouge (West), Malvern Rouge (West), Malvern
- 3. W10 $442,394 W09 $617,670 W04 $538,469 W05 $555,678 W08 $962,146 W06 $560,390 W07 $833,026 W01 $1,17,019 C01 1798 E0 11 C11 150 C10 221 C02 184 *C03 34*W03 $457,079 W02 $819,149 C04 116 *C12 56 *C06 83 C07 303 C14 644 C08 711 *C09 65 Kingsview Village, The Westway, Richview (Willowridge), Humber Heights–Westmount Bloor West Village, Baby Point, The Junction, High Park North Keelesdale, Eglinton West, Rockcliffe-Smythe, Weston-Pellam Park, Corso Italia High Park, South Parkdale, Swansea, Roncesvalles VillageSunnylea, The Queensway, Humber Bay New Toronto, Longbranch, Mimico, Alderwood The Kingsway, Central Etobicoke, Eringate-Centennial-West Deane, Princess Ann Manor/Gardens-Rosethorn, Edenbridge-Humber Valley, Islington-City Centre West, Markland Wood York, Glen Park, Amesbury (Brookhaven), Pelmo Park – Humberlea, Weston, Fairbank (Briar Hill-Belgravia), Maple Leaf, Mount Dennis Downsview, Humber Summit, Humbermede (Emery), Jane and Finch (Black Creek/Glenfield-Jane Heights), York University Heights CityofToronto—WEST—DetachedHomes Averagepricebypercentageincrease/decrease:January 4.8% 1.9% 10.2% 9.2% 8.6% 1.4% 9.4% 6.2% 2.2% 3.9% W01 W02 *W03 W04 W05 W06 W07 W08 W09 W10 High Park, South Parkdale, Swansea, Roncesvalles Village Bloor West Village, Baby Point, The Junction, High Park North Keelesdale, Eglinton West, Rockcliffe-Smythe, Weston-Pellam Park, Corso Italia York, Glen Park, Amesbury (Brookhaven), Pelmo Park – Humberlea, Weston, Fairbank (Briar Hill-Belgravia), Maple Leaf, Mount Dennis Downsview, Humber Summit, Humbermede (Emery), Jane and Finch (Black Creek/Glenfield-Jane Heights), York University Heights New Toronto, Longbranch, Mimico, Alderwood Sunnylea, The Queensway, Humber Bay The Kingsway, Central Etobicoke, Eringate-Centennial-West Deane, Princess Ann Manor/ Gardens-Rosethorn, Edenbridge-Humber Valley, Islington-City Centre West, Markland Wood Kingsview Village, The Westway, Richview (Willowridge), Humber Heights–Westmount Rexdale, Clairville, Thistletown–Beaumond Heights, Smithfield: Mount Olive-Silverstone-Jamestown, The Elms (Elms-Old Rexdale)R 5% & Above0–4.9%Less than 0% Compared to January to June 2012 Source: RE/MAX, Toronto Real Estate Board *Districts that recorded less than 100 sales were discounted to prevent the reporting of statistical anomalies Rexdale, Clairville, Thistletown–Beaumond Heights, Smithfield: Mount Olive-Silverstone-Jamestown, The Elms (Elms-Old Rexdale)
- 4. 09 ,670 W04 $538,469 W05 $555,678 W07 $833,026 *W01 $1,017,019 C01 $426,376 E01 112 *E02 71 *E03 71 C11 $233,947 C02 $809,330 *C03 $664,882W03 $457,079 W02 $819,149 C04 $494,757 *C12 $697,005 *C06 $317,080 C07 $354,035 C15 $369,464 C13 $335,818 E04 230 E05 304 E07 223 E0 31 E08 125 *E06 14 The Westway, lowridge), –Westmount Bloor West Village, Baby Point, The Junction, High Park North Keelesdale, Eglinton West, Rockcliffe-Smythe, Weston-Pellam Park, Corso Italia High Park, South Parkdale, Swansea, Roncesvale Village Sunnylea, The Queensway, Humber Bay branch, ood coke, eane, osethorn, y, st, York, Glen Park, Amesbury (Brookhaven), Pelmo Park – Humberlea, Weston, Fairbank (Briar Hill-Belgravia), Maple Leaf, Mount Dennis Downsview, Humber Summit, Humbermede (Emery), Jane and Finch (Black Creek/Glenfield-Jane Heights), York University Heights CityofToronto—CENTRAL—CondominiumApartments&Towns Averagepricebypercentageincrease/decrease:JanuarytoJune2013 0.7% -3.3% 3.8% -7.3% -7.3% -1.3% 2.9% *C09 C10 C11 *C12 C13 C14 C15 Downtown, Harbourfront, Little Italy The Annex, Yorkville, South Hill, Summerhill, Wychwood Park, Deer Park Forest Hill South, Oakwood-Vaughan, Humewood-Cedarvale, Corso Italia Davisville Village, Lawrence Park South Leaside, Thorncliffe Park, Flemingdon Park York Mills, Bridle Path, St. Andrews-Windfields, Sunnybrook Don Mills, Parkwoods-Donalda, Victoria Village Newtonbrook East, Willowdale East Hillcrest Village, Bayview Woods – Steeles, Bayview Village, Don Valley Village, Henry Farm, Pleasant View R Compared to January to June 2012 Source: RE/MAX, Toronto Real Estate Board *Districts that recorded less than 100 sales were discounted to prevent the reporting of statistical anomalies C08 – $416,326 *C09 – $759,657 C10 – $467,140 C14 – $403,541 Downtown, Harbourfront, Little Italy The Annex, Yorkville, South Hill, Summerhill, Wychwood Park, Deer Park Forest Hill South, Oakwood-Vaughan, Humewood-Cedarvale, Corso Italia Bedford Park, Lawrence Manor, North Toronto, Forest Hill North North York, Clanton Park, Bathurst Manor Willowdale, Newtonbrook West, Westminister-Branson, Lansing-Westgate Cabbagetown, St. Lawrence Market, Toronto Waterfront, Moss Park, Church and Wellesley, Garden District Moore Park, Rosedale Davisville Village, Lawrence Park South Leaside, Thorncliffe Park, Flemingdon Park York Mills, Bridle Path, St. Andrews-Windfields, Sunnybrook Don Mills, Parkwoods-Donalda, Victoria Village Newtonbrook East, Willowdale East Hillcrest Village, Bayview Woods – Steeles, Bayview Village, Don Valley Village, Henry Farm, Pleasant View 5% & Above0–4.9%Less than 0% C01 C02 *C03 C04 *C06 C07 C08 25.5% -2.9% 5.1% -5.7% 5.7% 0.1% 0.2% Bedford Park, Lawrence Manor, North Toronto, Forest Hill North North York, Clanton Park, Bathurst Manor Willowdale, Newtonbrook West, Westminister-Branson, Lansing-Westgate Cabbagetown, St. Lawrence Market, Toronto Waterfront, Moss Park, Church and Wellesley, Garden District Moore Park, Rosedale
- 5. E01 $427,155 *E02 $492,243 *E03 $219,704 C11 150 C10 221 *C12 56 07 03 C14 644 C15 418 C13 207 E04 $222,755 E05 $285,147 E07 $257,603 E09 $243,388 E08 $209,768 *E06 $356,243 *E10 $211,620 E11 $207,574 C08 711 *C09 65 CityofToronto—EAST—CondominiumApartments&Towns Averagepricebypercentageincrease/decrease:JanuarytoJune2013 -3.6% 6.8% -7.0% -3.0% 3.1% -7.6% 4.1% 1.8% 0.1% 9.8% 3.1% E01 *E02 *E03 E04 E05 *E06 E07 E08 E09 *E10 E11 Riverdale, Danforth (Greektown), Leslieville The Beaches, Woodbine Corridor Danforth (Greektown), East York, Playter Estates, Broadview North (Old East York), O’Connor-Parkview, Crescent Town The Golden Mile, Dorset Park, Wexford, Maryvale, Scarborough Junction (Kennedy Park), Ionview, Clairlea Steeles, L’Amoreaux, Tam O’Shanter-Sullivan Birch Cliff, Oakridge, Hunt Club, Cliffside Agincourt North Scarborough Village, Cliffcrest, Guildwood, Eglinton East (Knob Hill) Scarborough City Centre, Woburn, Morningside, Bendale (Cedarbrae) Rouge (South), Port Union (Centennial Scarborough), West Hill, Highland Creek R 5% & Above0–4.9%Less than 0% Compared to January to June 2012 Source: RE/MAX, Toronto Real Estate Board *Districts that recorded less than 100 sales were discounted to prevent the reporting of statistical anomalies Riverdale, Danforth (Greektown), Leslieville The Beaches, Woodbine Corridor Danforth (Greektown), East York, Playter Estates, Broadview North (Old East York), O’Connor-Parkview, Crescent Town The Golden Mile, Dorset Park, Wexford, Maryvale, Scarborough Junction (Kennedy Park), Ionview, Clairlea Steeles, L’Amoreaux, Tam O’Shanter-Sullivan Birch Cliff, Oakridge, Hunt Club, Cliffside Agincourt North Scarborough Village, Cliffcrest, Guildwood, Eglinton East (Knob Hill) Scarborough City Centre, Woburn, Morningside, Bendale (Cedarbrae) Rouge (South), Port Union (Centennial Scarborough), West Hill, Highland Creek Rouge (West), Malvern Rouge (West), Malvern
- 6. W10 $179,352 W09 $210,750 W04 $216,232 W05 $213,378 W08 $327,382 W06 $389,455 *W07 $599,167 W01 $394,086 C01 1798 E0 11 C11 150 C10 221 C02 184 *C03 34*W03 $279,250 W02 $398,588 C04 116 *C12 56 *C06 83 C07 303 C14 644 C08 711 *C09 65 Rexdale, Clairville, Thistletown–Beaumond Heights, Smithfield: Mount Olive-Silverstone-Jamestown, The Elms (Elms-Old Rexdale) Kingsview Village, The Westway, Richview (Willowridge), Humber Heights–Westmount Bloor West Village, Baby Point, The Junction, High Park North Keelesdale, Eglinton West, Rockcliffe-Smythe, Weston-Pellam Park, Corso Italia High Park, South Parkdale, Swansea, Roncesvalles VillageSunnylea, The Queensway, Humber Bay New Toronto, Longbranch, Mimico, Alderwood The Kingsway, Central Etobicoke, Eringate-Centennial-West Deane, Princess Ann Manor/Gardens-Rosethorn, Edenbridge-Humber Valley, Islington-City Centre West, Markland Wood York, Glen Park, Amesbury (Brookhaven), Pelmo Park – Humberlea, Weston, Fairbank (Briar Hill-Belgravia), Maple Leaf, Mount Dennis Downsview, Humber Summit, Humbermede (Emery), Jane and Finch (Black Creek/Glenfield-Jane Heights), York University Heights CityofToronto—WEST—CondominiumApartments&Towns Averagepricebypercentageincrease/decrease:JanuarytoJune2013 1.4% 1.0% 9.0% 0.7% 2.0% 2.0% 32.9% 1.7% 3.9% -0.8% W01 W02 *W03 W04 W05 W06 *W07 W08 W09 W10 High Park, South Parkdale, Swansea, Roncesvalles Village Bloor West Village, Baby Point, The Junction, High Park North Keelesdale, Eglinton West, Rockcliffe-Smythe, Weston-Pellam Park, Corso Italia York, Glen Park, Amesbury (Brookhaven), Pelmo Park – Humberlea, Weston, Fairbank (Briar Hill-Belgravia), Maple Leaf, Mount Dennis Downsview, Humber Summit, Humbermede (Emery), Jane and Finch (Black Creek/Glenfield-Jane Heights), York University Heights New Toronto, Longbranch, Mimico, Alderwood Sunnylea, The Queensway, Humber Bay The Kingsway, Central Etobicoke, Eringate-Centennial-West Deane, Princess Ann Manor/ Gardens-Rosethorn, Edenbridge-Humber Valley, Islington-City Centre West, Markland Wood Kingsview Village, The Westway, Richview (Willowridge), Humber Heights–Westmount Rexdale, Clairville, Thistletown–Beaumond Heights, Smithfield: Mount Olive-Silverstone-Jamestown, The Elms (Elms-Old Rexdale)R 5% & Above0–4.9%Less than 0% Compared to January to June 2012 Source: RE/MAX, Toronto Real Estate Board *Districts that recorded less than 100 sales were discounted to prevent the reporting of statistical anomalies